3571
Power BI Employee Performance & Productivity Dashboard
Power BI Employee Performance & Productivity Dashboard
More Report pages
Report Author: Andreas Miftakhul Pratama
3571
Share template with others
Summary
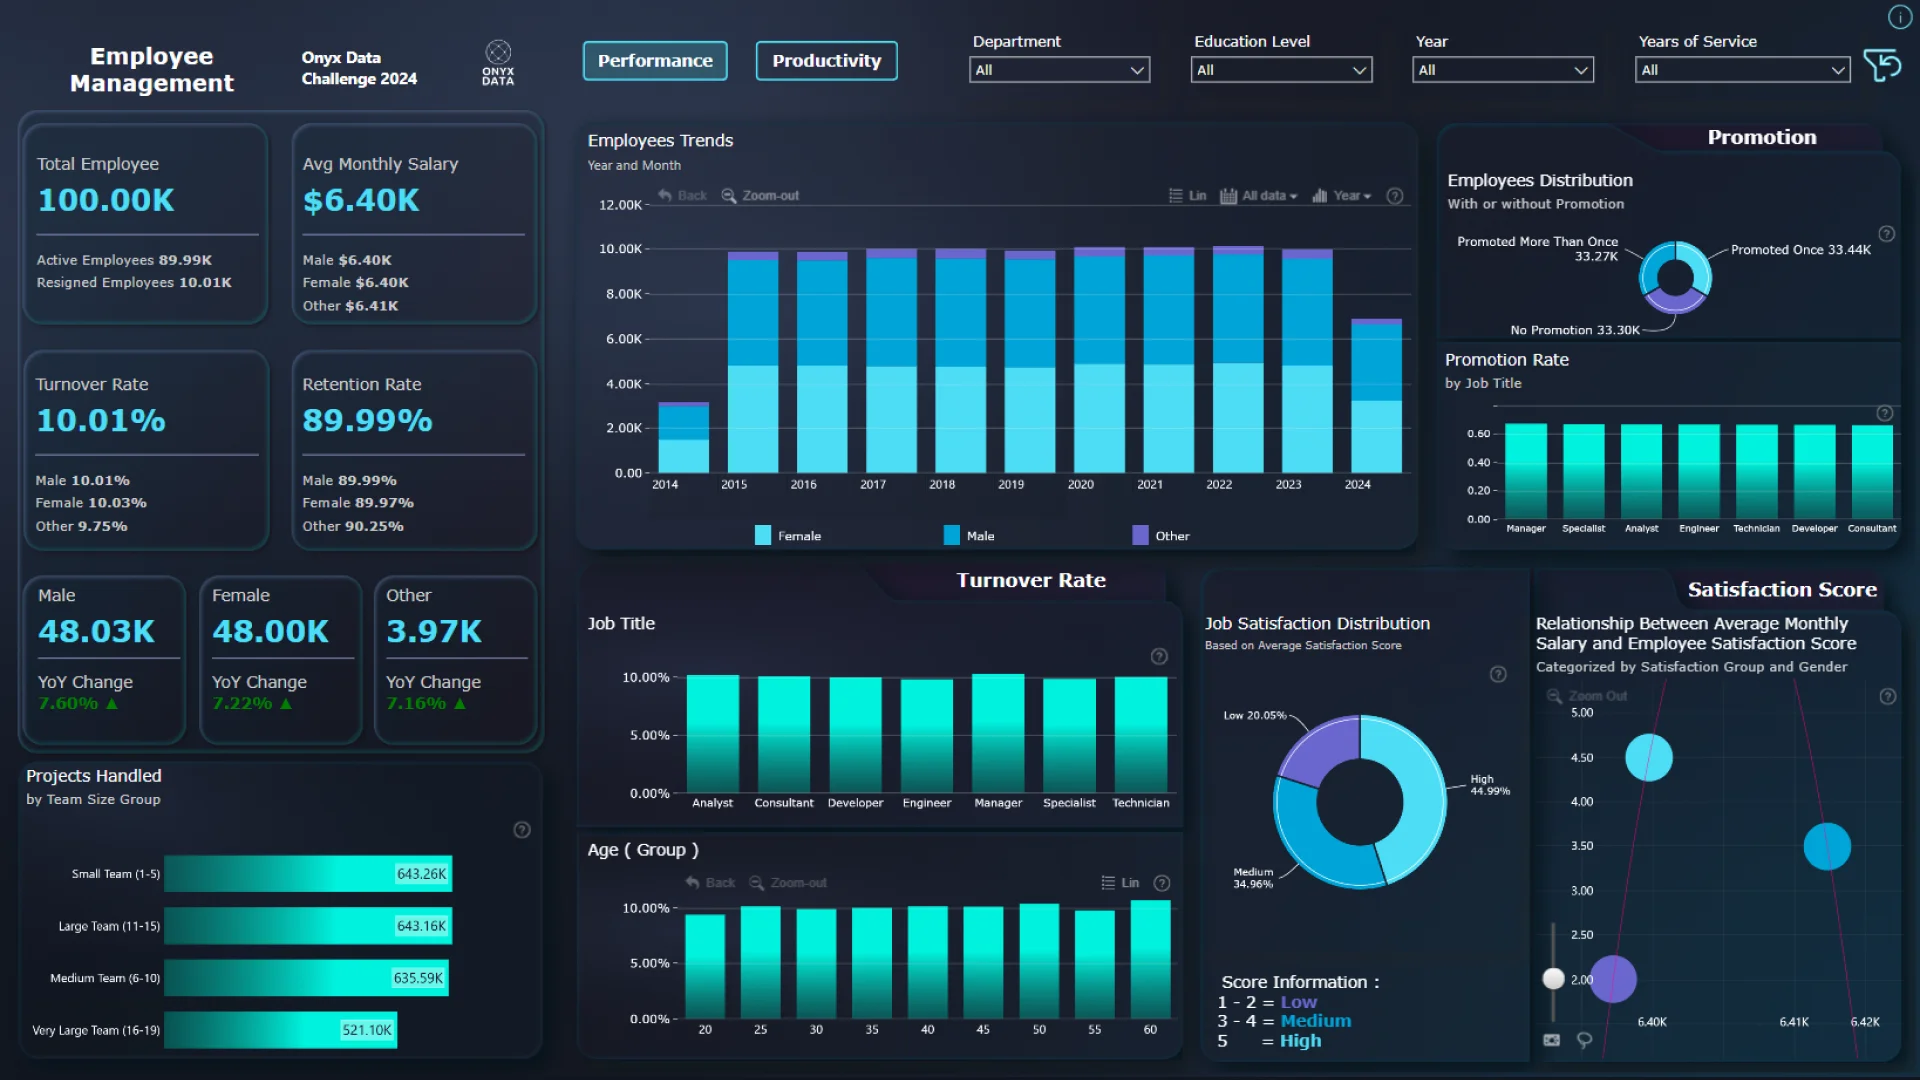
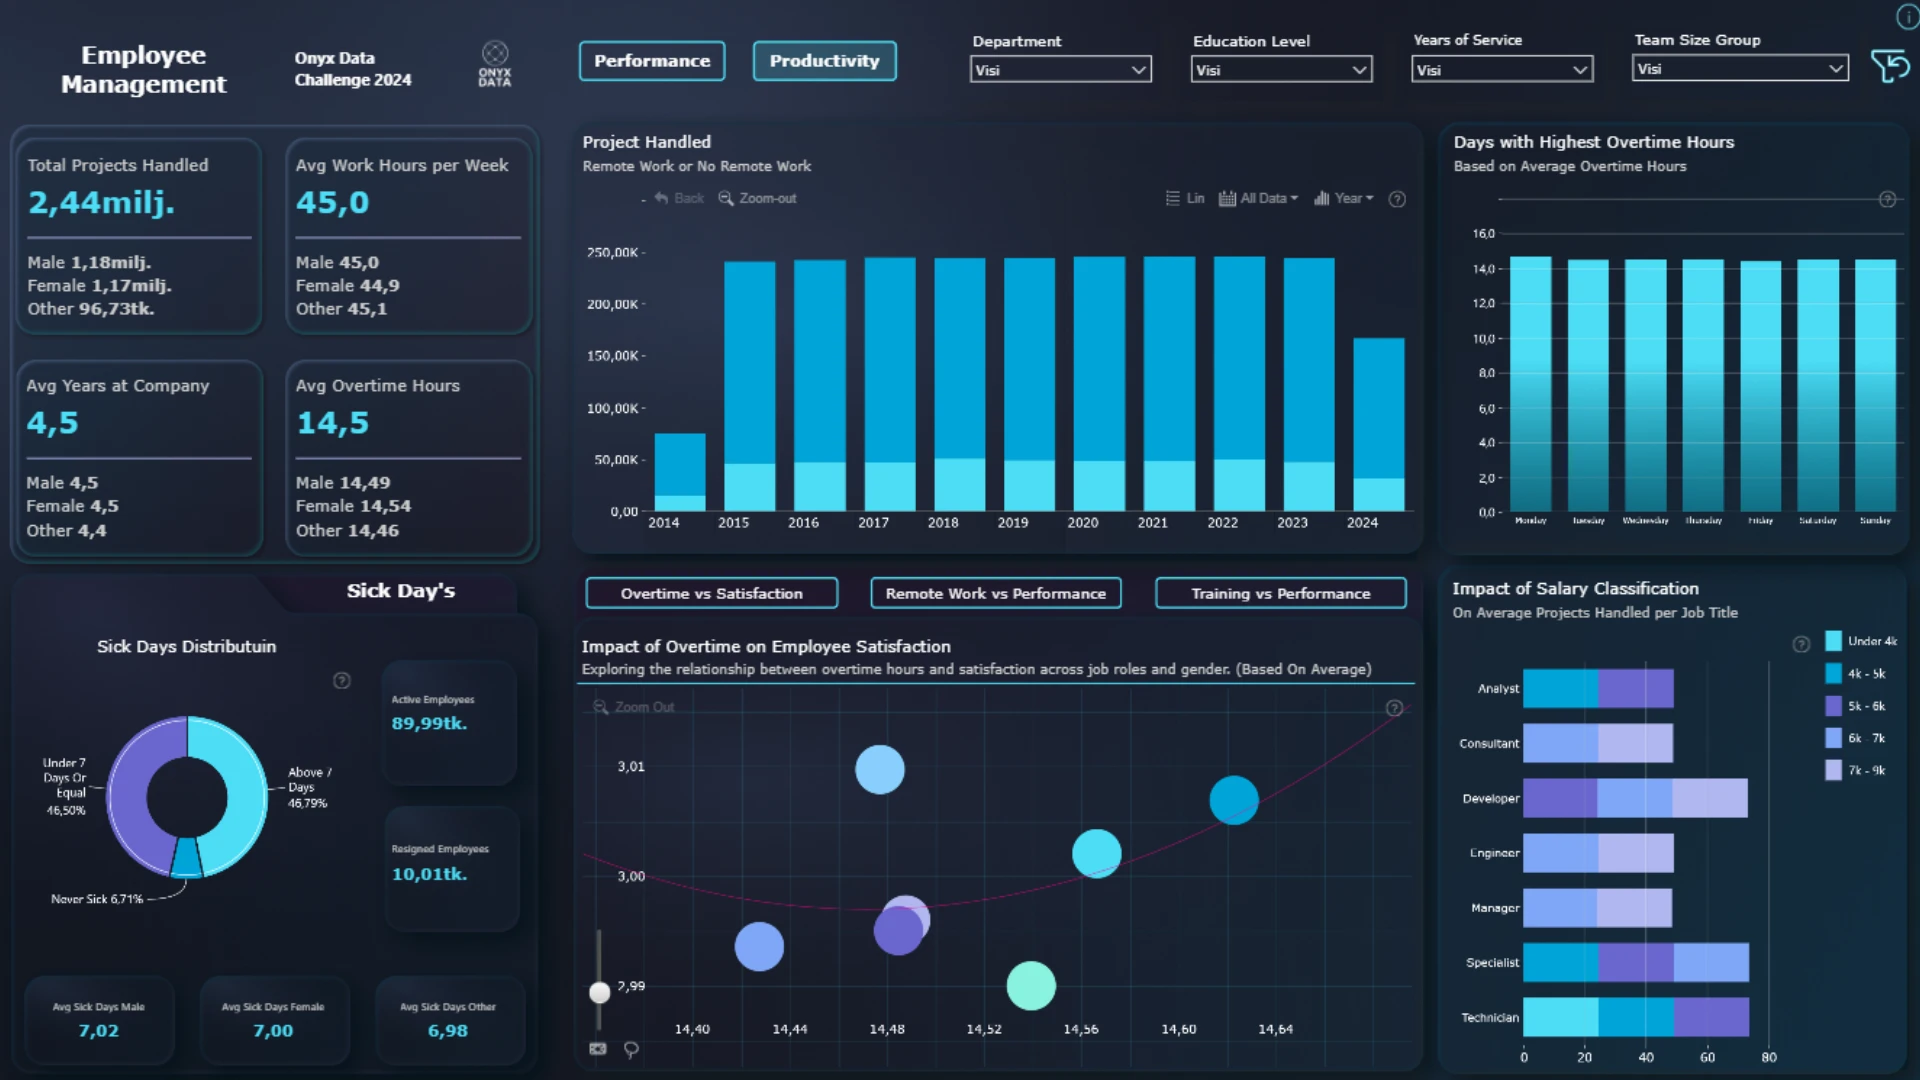
This two-page Power BI employee performance dashboard helps HR teams and managers monitor workforce performance, productivity, and related employee metrics. It provides interactive views for comparing workforce groups, tracking changes, and exploring factors associated with employee results.
Created by Andreas Miftakhul Pratama using the Employee Performance dataset, the report was the winning submission in the October 2024 Onyx Data DataDNA ZoomCharts Mini Challenge. It uses trend, relationship, category, and composition visuals for detailed workforce analysis.
Key Insights of the Power BI Employee Performance & Productivity Dashboard
- Employee performance: Review performance measures and compare results across workforce segments.
- Productivity metrics: Analyze employee output and the work-related factors associated with productivity.
- Metric relationships: Use scatter analysis to investigate connections between performance, productivity, and employee characteristics.
- Workforce comparisons: Compare results across departments, job roles, demographic groups, or other available categories.
- Performance trends: Track changes in employee measures across the available time periods.
- Workforce composition: Explore how employees are distributed across organizational and demographic dimensions.
How to Use This Power BI Employee Performance & Productivity Dashboard
Preview the report online and navigate between its two pages to review employee performance and productivity from different perspectives. Select workforce groups or data points within the visuals to filter the report and investigate specific segments.
Download the PBIX template and open it in Power BI Desktop to review the report structure, measures, and drill-down configuration. Replace the sample employee data with your own HR dataset, map the corresponding fields, refresh the model, and customize the dashboard for workforce reporting.
ZoomCharts visuals used





4U Report Challenges
Participate in data challenges, build and submit reports to get free template downloads.
Join CommunityMobile view allows you to interact with the report. To Download the template please switch to desktop view.
How to use a PBIX template
Preview the interactive report, download the PBIX file, open it in Power BI Desktop, and replace the same data connection with your own dataset.
Preview and download
Explore the report online and download the PBIX template file.
Open in Power BI Desktop
Open the downloaded PBIX file in Power BI Desktop.
Connect your data
Replace the sample data source with your own dataset.
Refresh and adjust
Refresh the model and update fields or visual were needed.
Save and share
Save your report and publish it for your audience.


