967
HR Dashboard Example for Workforce Analytics
HR Dashboard Example for Workforce Analytics
More Report pages
Report Author: Gbenga Emmanuel Popoola
967
Share template with others
Summary
This HR dashboard Power BI example was created for the ZoomCharts 4U Report Challenge July 2026 using an HR workforce planning dataset.
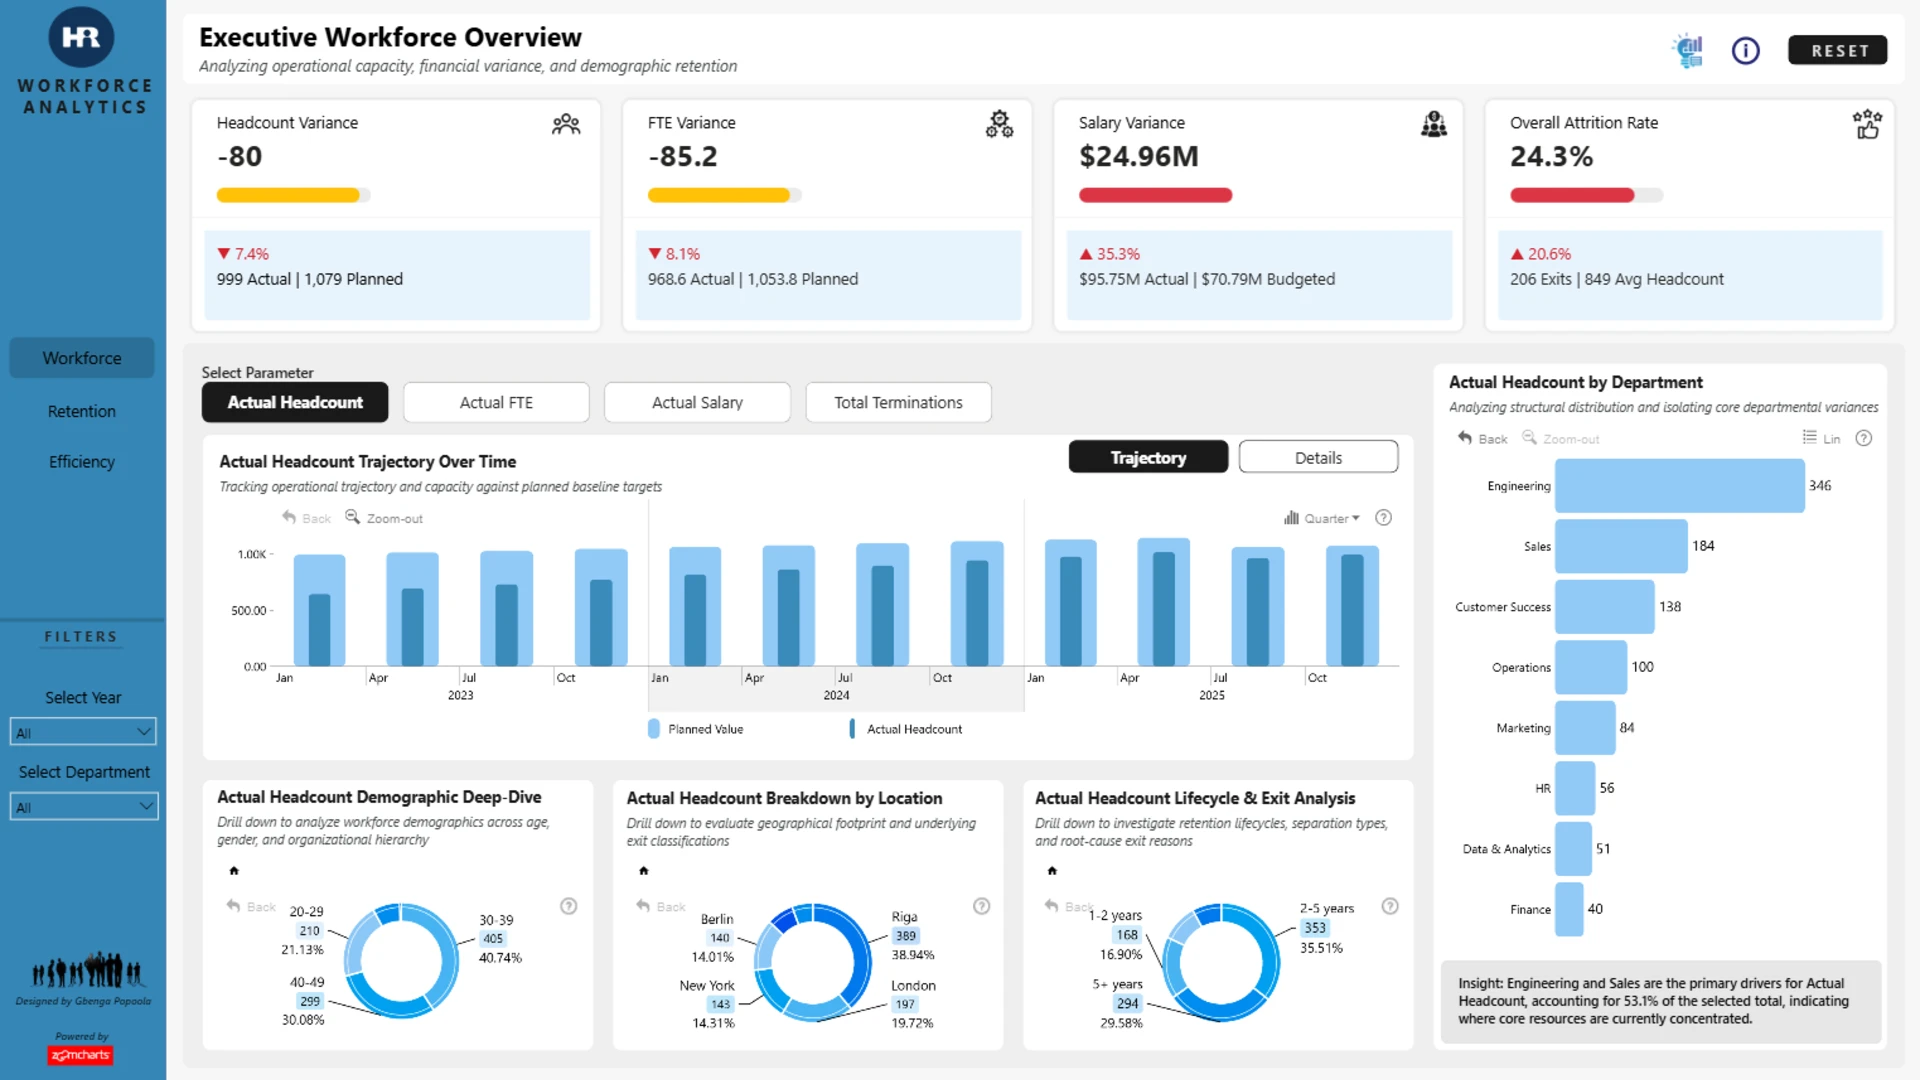
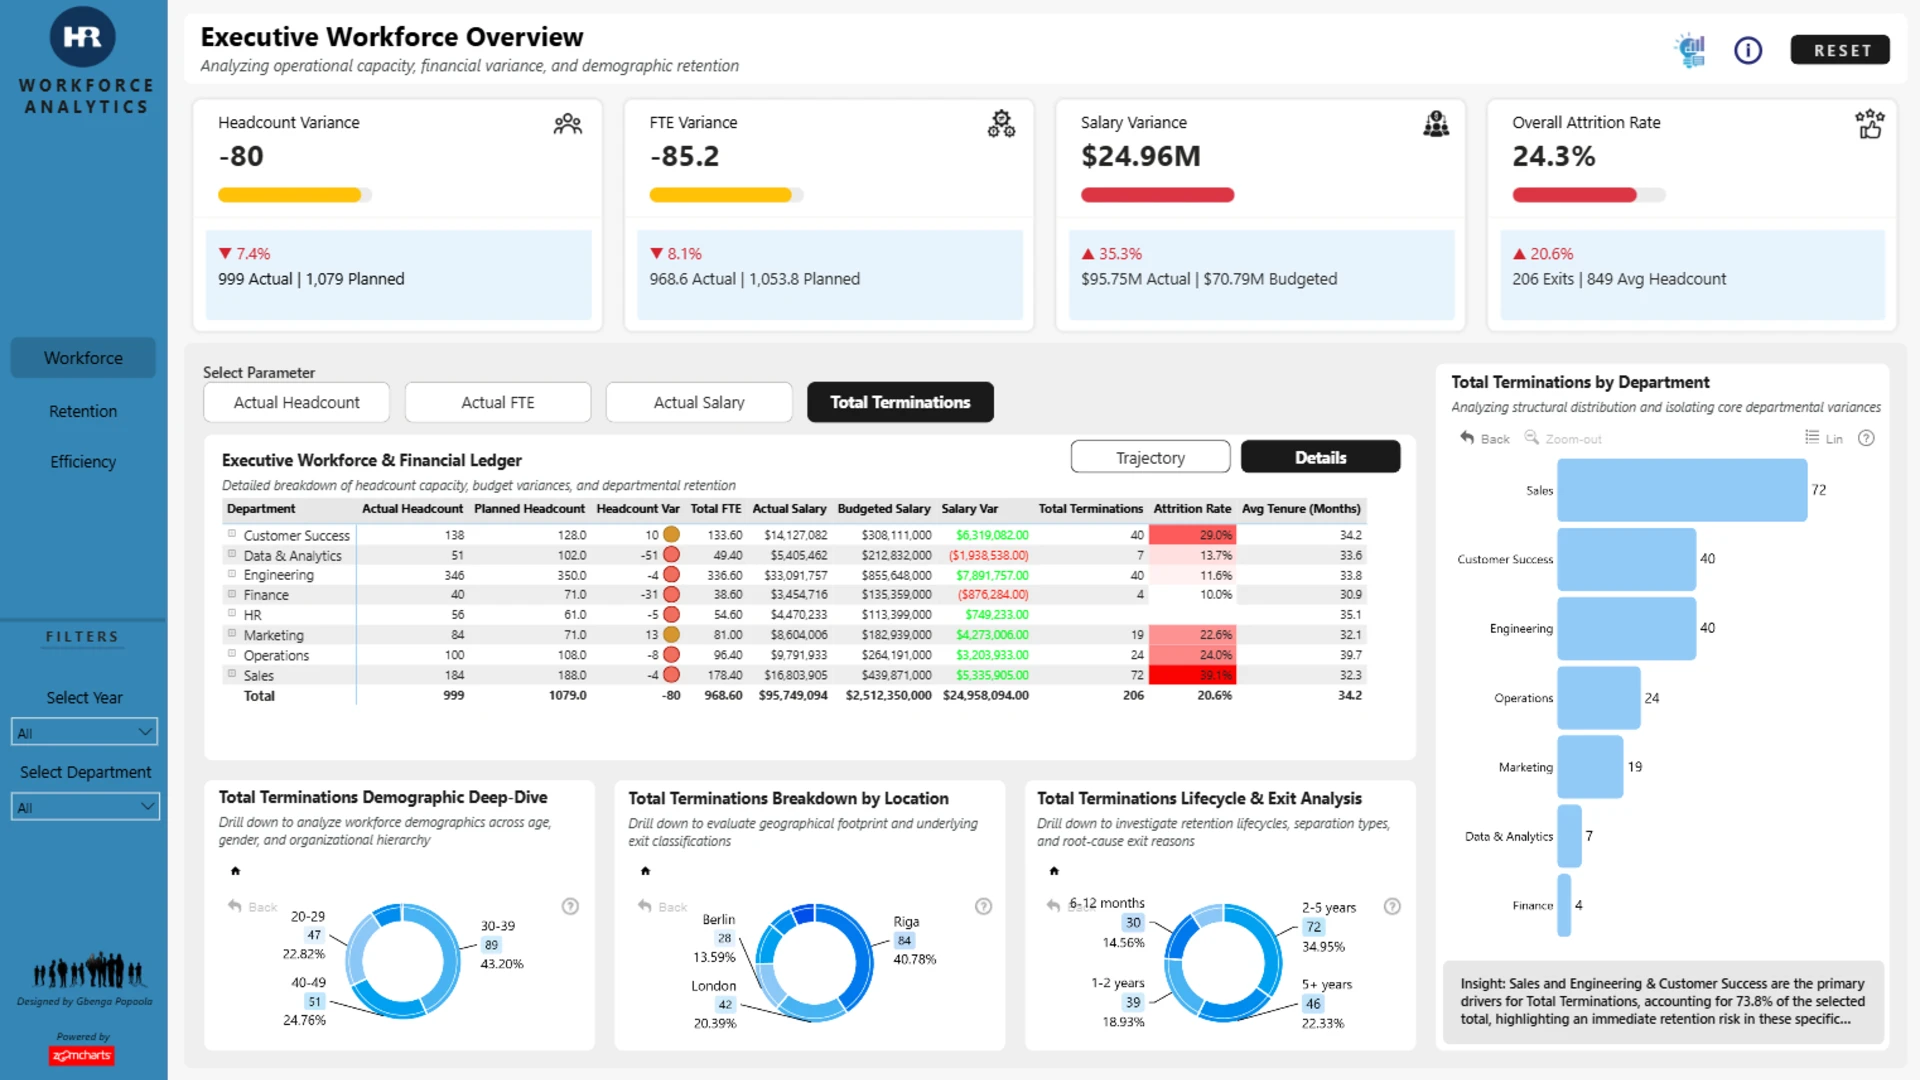
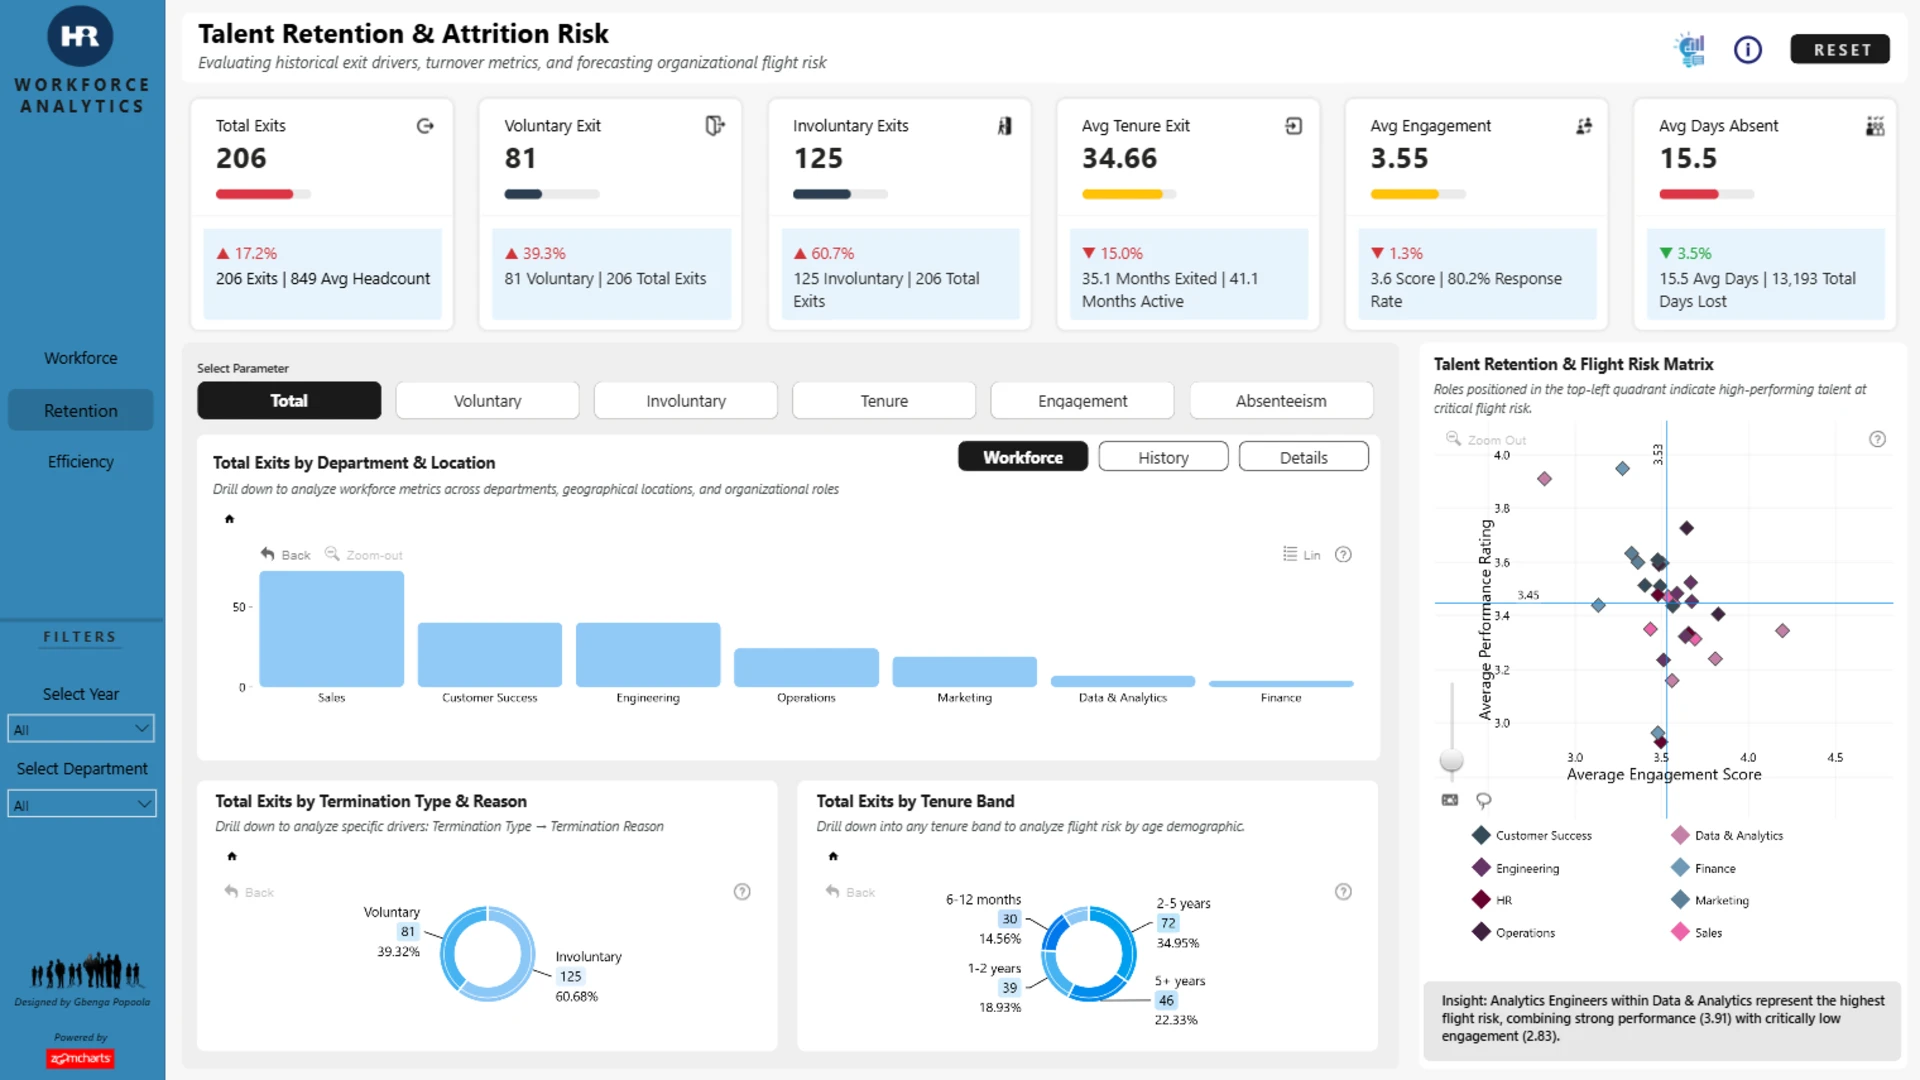
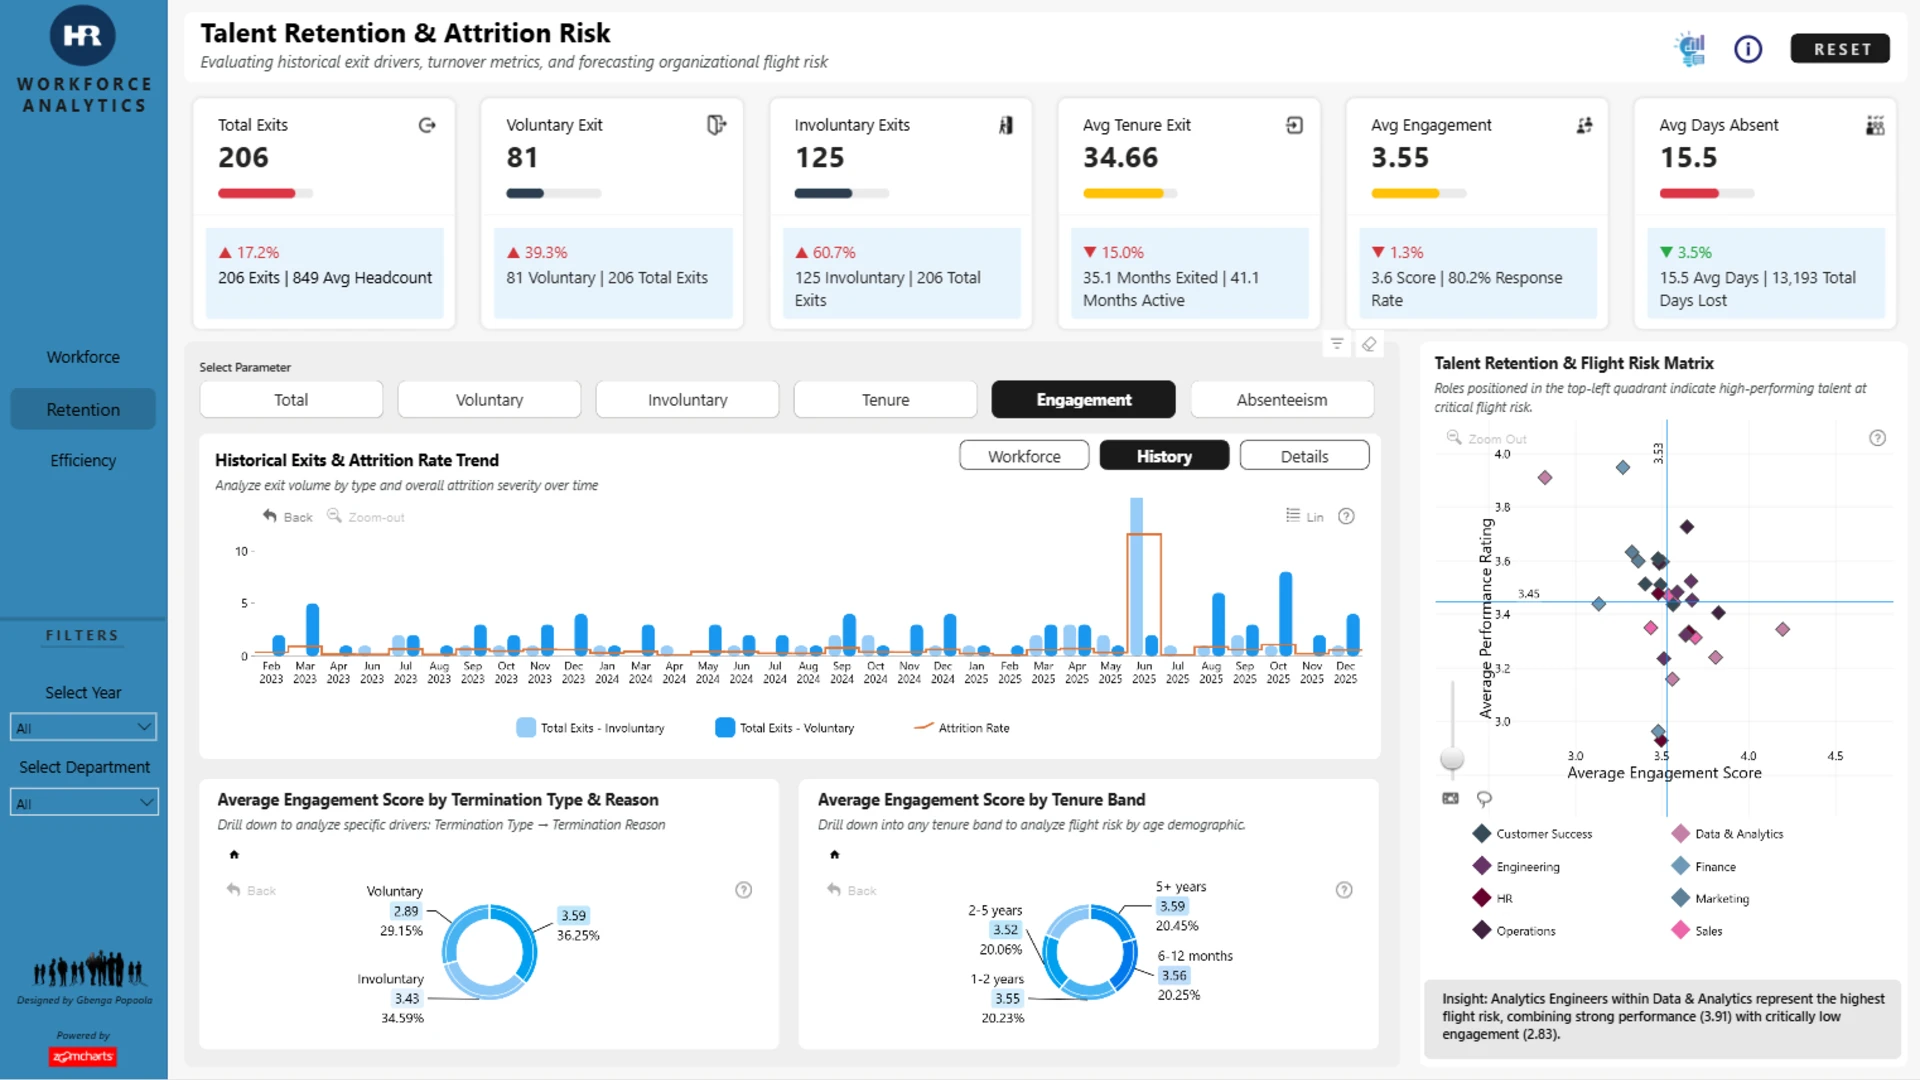
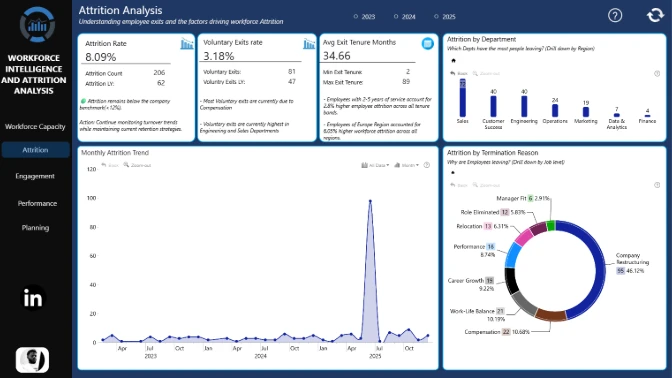
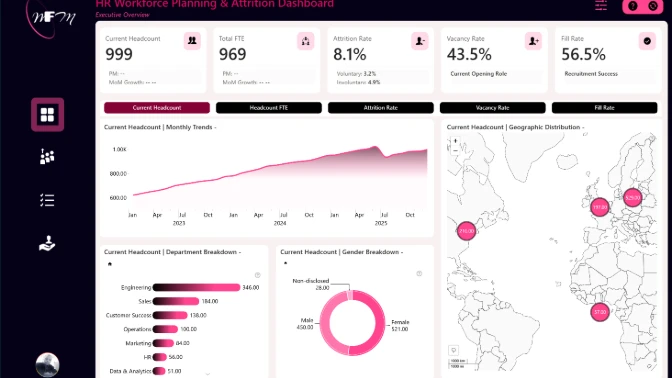
It is a strong example of using Power BI for workforce analytics, giving HR leaders and business teams a clear view of hiring activity, headcount trends, employee terminations, retention risks, and workforce planning performance.
Key Insights of Power BI HR Workforce Analytics Dashboard
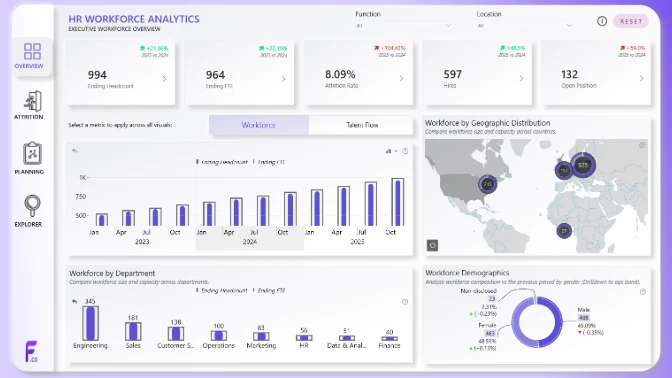
The report is structured as a multi-page executive HR dashboard. It combines a multi-year workforce baseline with a focused 2025 operating view, helping users analyze organizational health from several perspectives. Some of the main insights include:
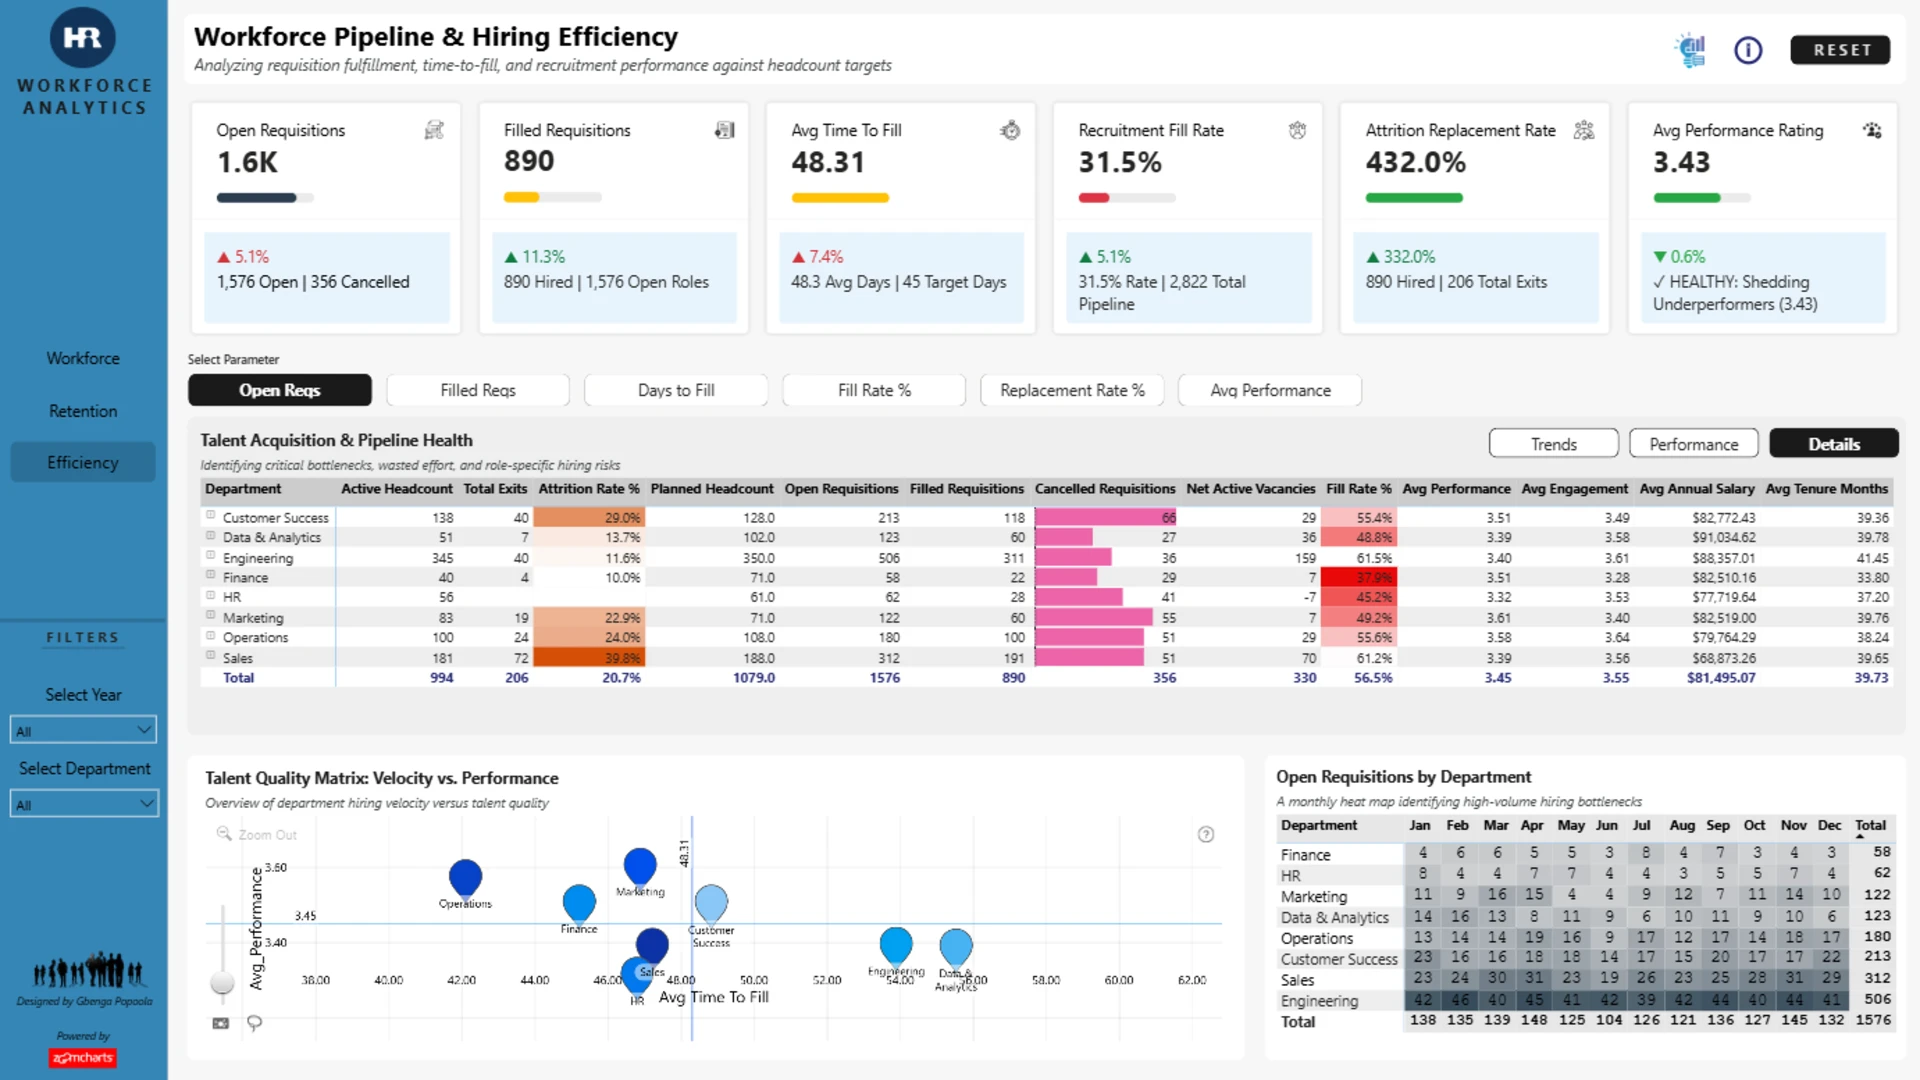
- Workforce health: active headcount, workforce gaps, and salary budget variance
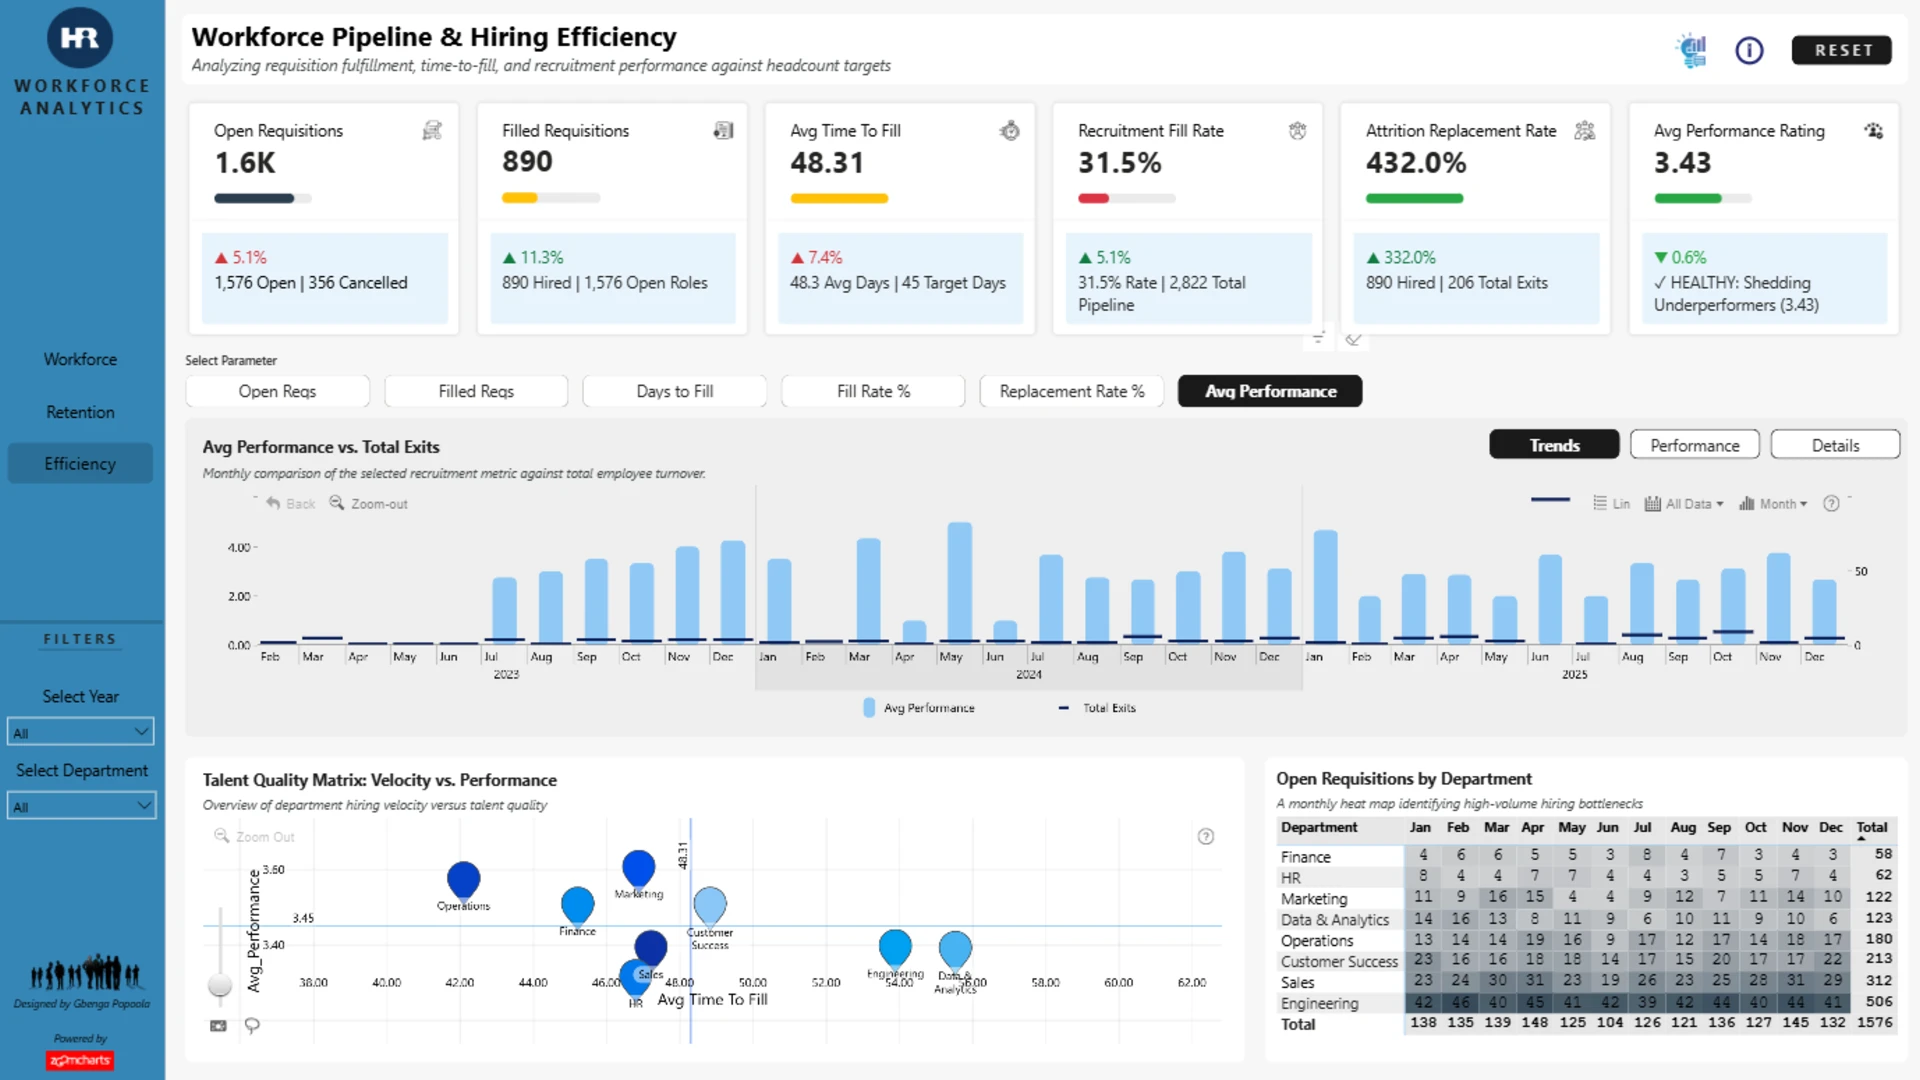
- Hiring performance: recruitment velocity, requisition backlogs, and pipeline bottlenecks
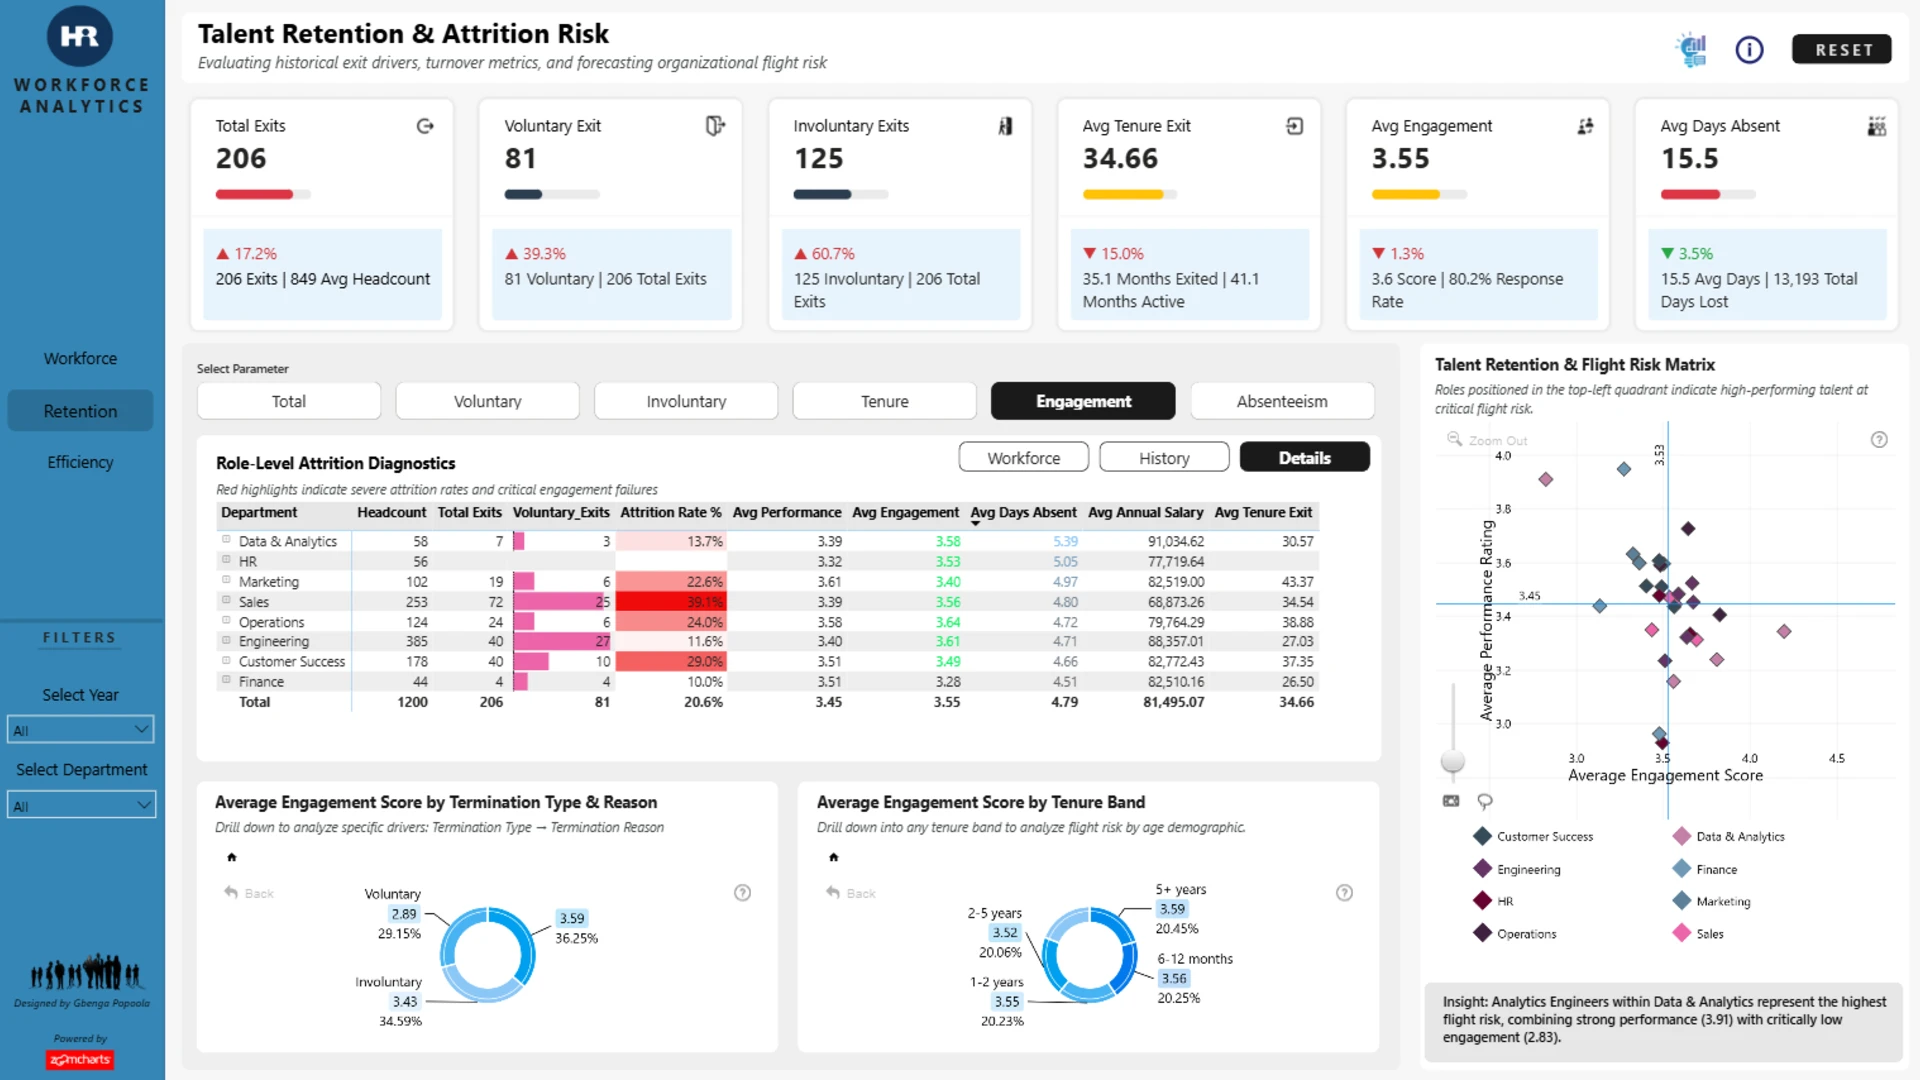
- Employee lifecycle trends: hiring, workforce snapshots, terminations, and retention factors
- Talent retention: flight risk analysis for high-performing employees with low engagement
- Workforce breakdowns by department, geography, tenure, and other HR dimensions
With a clear executive layout and interactive ZoomCharts visuals, this Power BI HR dashboard makes it easier to identify workforce risks, compare HR performance across teams, and drill into the factors behind hiring delays, retention challenges, and employee movement.
This report is based on the ZoomCharts 4U Report Challenge submission by Gbenga Emmanuel Popoola, with the dashboard designed to support strategic HR planning and workforce decision-making.
How to Use This Power BI HR Workforce Analytics Dashboard
To interact with this Power BI HR analytics dashboard, click on any active element directly on the charts. The visuals work together to filter the report, allowing users to explore workforce trends by department, location, tenure, hiring stage, and retention segment.
Download the .pbix file to review the report structure, visual settings, formulas, and calculations. You can also adapt the dashboard for your own HR data to monitor workforce planning, hiring performance, employee retention, and organizational health.
ZoomCharts visuals used





4U Report Challenges
Participate in data challenges, build and submit reports to get free template downloads.
Join CommunityMobile view allows you to interact with the report. To Download the template please switch to desktop view.
How to use a PBIX template
Preview the interactive report, download the PBIX file, open it in Power BI Desktop, and replace the same data connection with your own dataset.
Preview and download
Explore the report online and download the PBIX template file.
Open in Power BI Desktop
Open the downloaded PBIX file in Power BI Desktop.
Connect your data
Replace the sample data source with your own dataset.
Refresh and adjust
Refresh the model and update fields or visual were needed.
Save and share
Save your report and publish it for your audience.


