706
Electronics Product Ratings and Reviews
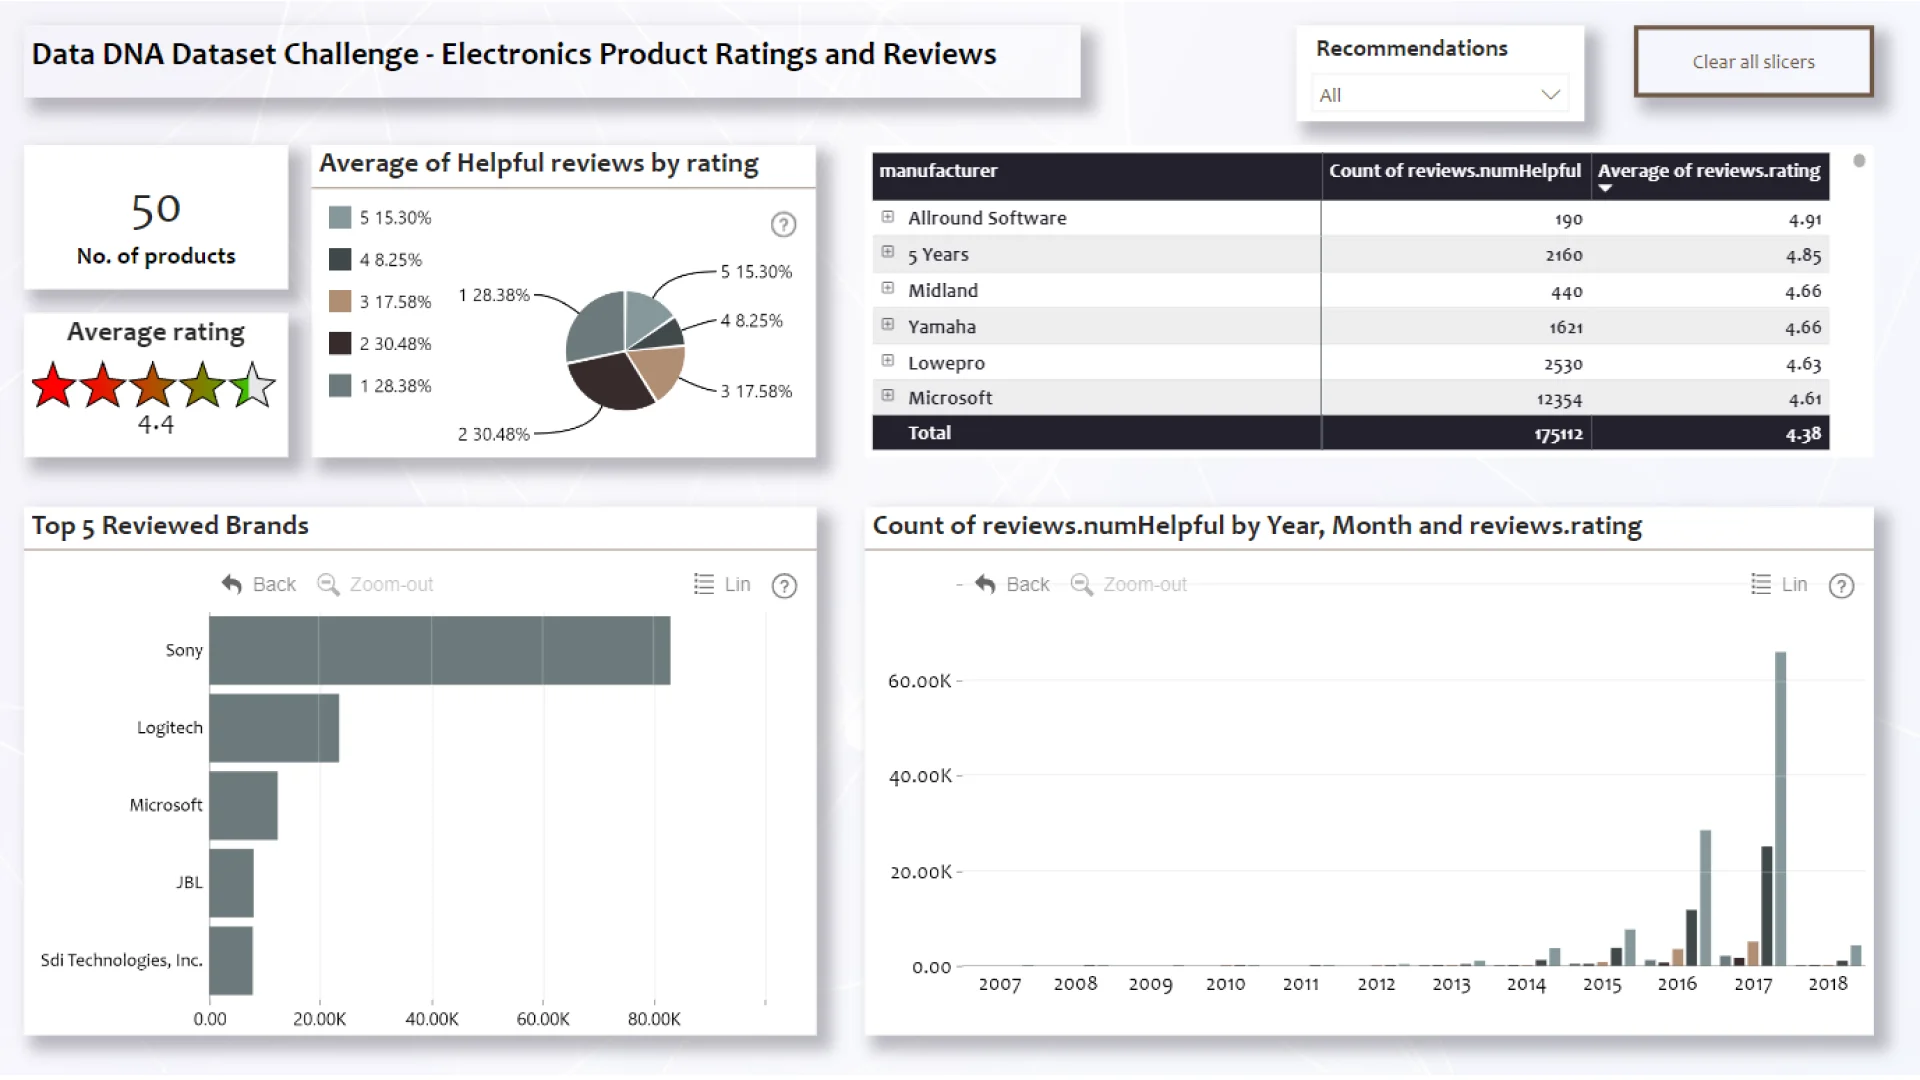
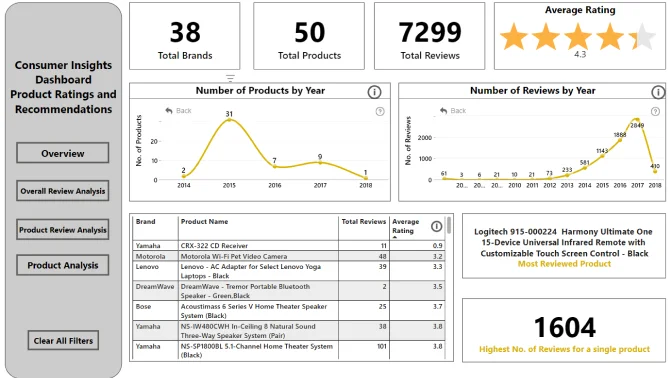
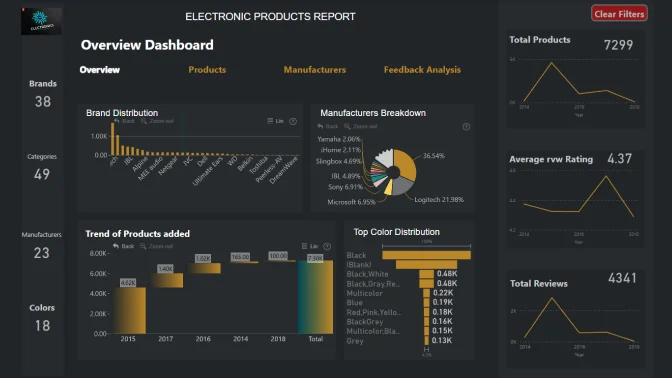
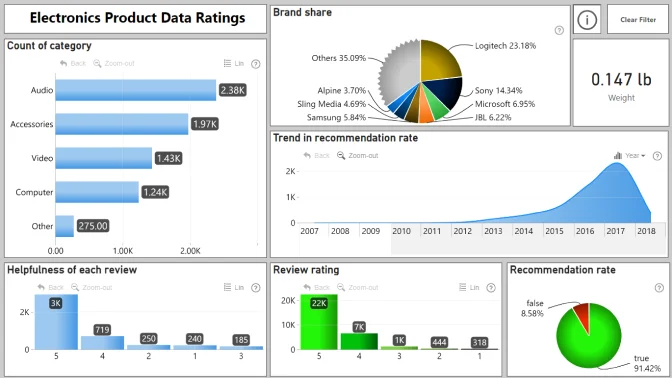
Electronics Product Ratings and Reviews
Report Author: Dave Amri
706
Share template with others
Report submitted for Onyx Data DataDNA ZoomCharts Mini Challenge, February 2024. The report was built based on Electronics Product Data Ratings dataset and includes ZoomCharts custom Drill Down PRO visuals for Power BI.
Author's description:
The challenge was to create an interactive visual exploring how product ratings and recommendations relate, what effect product features have on ratings, and to determine which brands have the highest satisfaction rating.
4U Report Challenges
Participate in data challenges, build and submit reports to get free template downloads.
Join CommunityMobile view allows you to interact with the report. To Download the template please switch to desktop view.
Was this helpful? Thank you for your feedback!
Sorry about that.
How can we improve it?