5464
Power BI Customer Satisfaction & Loyalty Dashboard
Power BI Customer Satisfaction & Loyalty Dashboard


More Report pages
Report Author: Andreas Miftakhul Pratama
5464
Share template with others
Summary
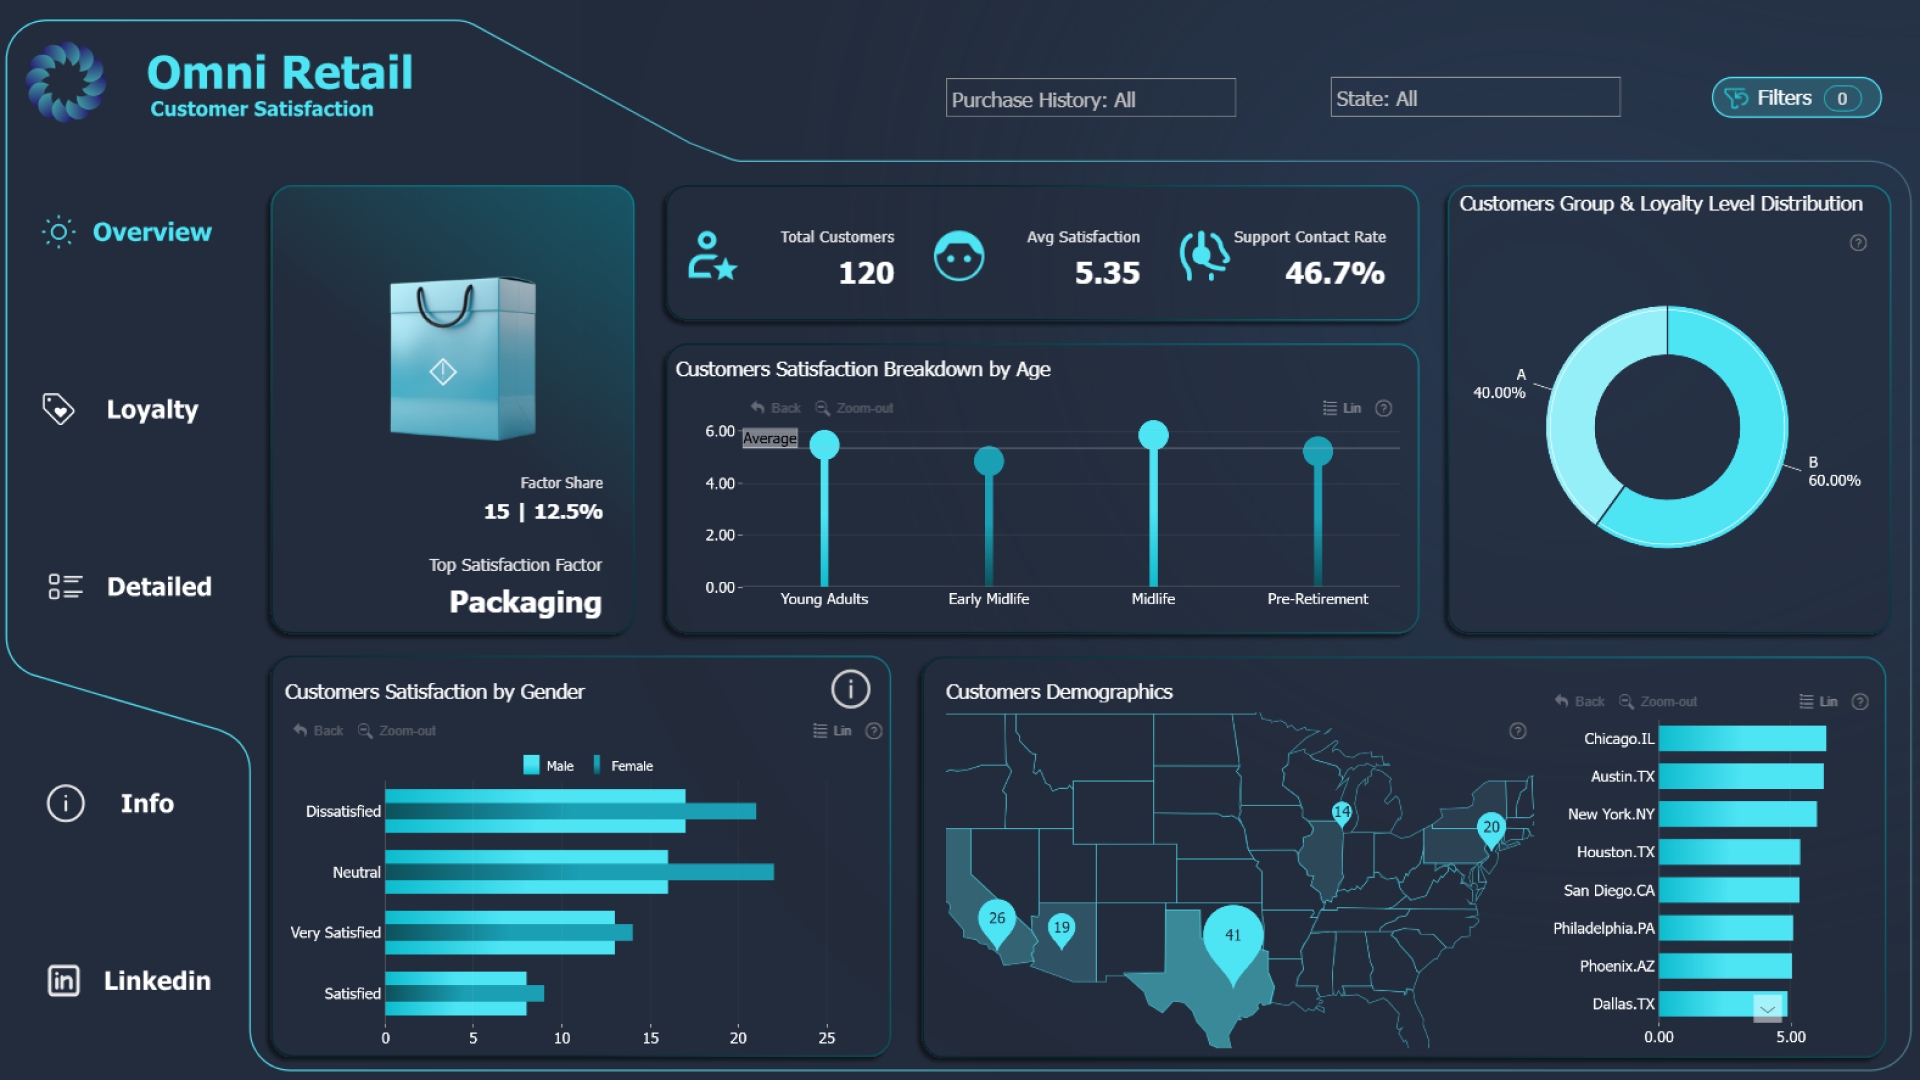
This Power BI customer satisfaction and loyalty dashboard analyzes 2024 feedback for OmniRetail, a U.S. retailer selling electronics and smart-home products online and in physical stores.
Created by Andreas Miftakhul Pratama, the report won the Onyx Data July 2025 ZoomCharts Mini Challenge. It helps users explore customer satisfaction and loyalty across purchasing behavior, demographics, support history, and location data.
Key insights of this dashboard
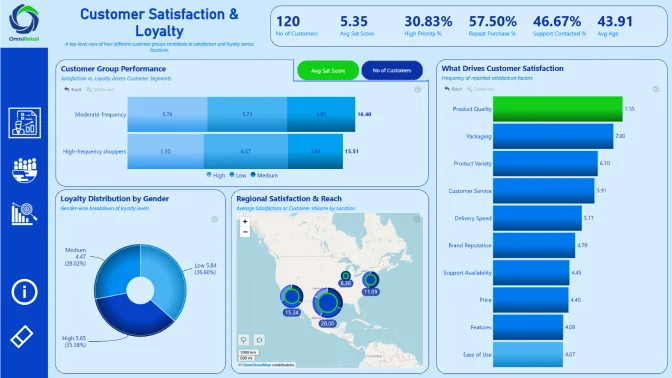
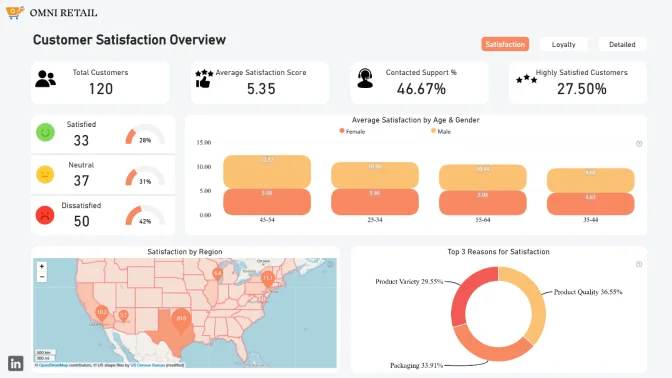
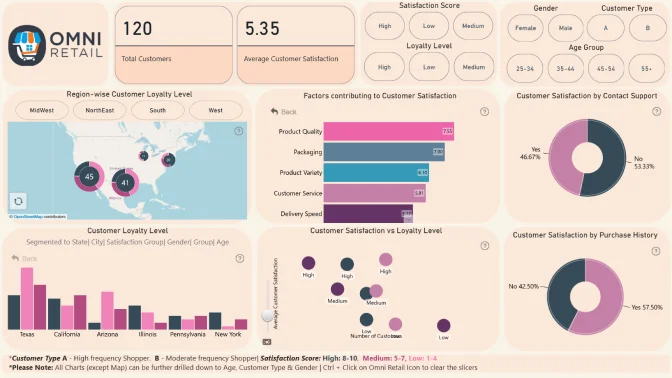
Three report pages cover several areas of retail customer experience analysis. Users can explore:
- Customer satisfaction and loyalty across different customer groups
- Purchasing behavior in relation to customer feedback
- Customer demographics and differences between audience segments
- Support history and customer service experiences
- Geographic patterns across customer locations
The dashboard uses Drill Down Scatter PRO, Drill Down Combo Bar PRO, Drill Down Map PRO, and Drill Down Donut PRO visuals to present the data from multiple perspectives and support interactive exploration.
This report was created by Andreas Miftakhul Pratama for the Customer Satisfaction and Loyalty Analytics Challenge.
How to use this dashboard
Click active chart elements to filter the displayed data. Use the available drill-down controls to move from high-level customer experience results into more detailed categories, segments, and locations.
Download the PBIX template to examine the report setup, calculations, and visual configurations in Power BI Desktop. Replace the sample data connection with your own customer feedback dataset to adapt the dashboard for your organization.
ZoomCharts visuals used



4U Report Challenges
Participate in data challenges, build and submit reports to get free template downloads.
Join CommunityMobile view allows you to interact with the report. To Download the template please switch to desktop view.
How to use a PBIX template
Preview the interactive report, download the PBIX file, open it in Power BI Desktop, and replace the same data connection with your own dataset.
Preview and download
Explore the report online and download the PBIX template file.
Open in Power BI Desktop
Open the downloaded PBIX file in Power BI Desktop.
Connect your data
Replace the sample data source with your own dataset.
Refresh and adjust
Refresh the model and update fields or visual were needed.
Save and share
Save your report and publish it for your audience.


