Registration Open
Registration Open
01 July | 04:00
-
Reset your password
We'll email you instructions on how to reset your password
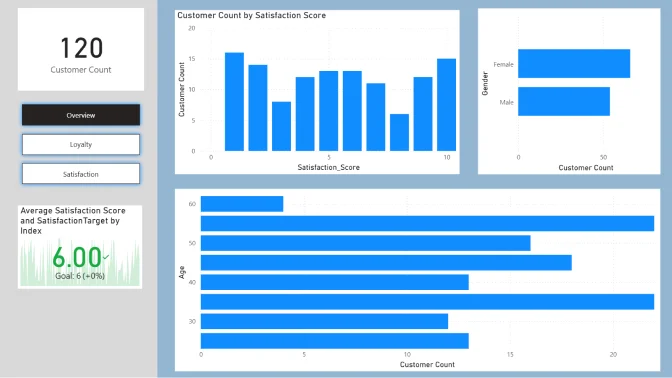
Join the DataDNA ZoomCharts Mini Challenge! Analyze customer satisfaction trends for a retail company using Power BI. Guide leadership in improving retention, loyalty, and the overall customer experience.
Workshop | Power BI Workshop: Building Customer Satisfaction and Loyalty Reports
Workshop | Power BI Workshop: Building Customer Satisfaction and Loyalty Reports
03 July | 08:00
-
Webinar | Top Power BI Reports for Customer Satisfaction Analytics
Webinar | Top Power BI Reports for Customer Satisfaction Analytics
29 July | 08:00
01 July - 24 July
ZoomCharts Mini Challenge is part of the global DataDNA – Dataset Challenge by Onyx Data, which unites 25K+ data enthusiasts worldwide, ranging from beginners to seasoned professionals, including Microsoft MVPs. Read more about the DataDNA challenge on the Onyx Data DataDNA website. Join the community on LinkedIn
The ZoomCharts Mini Challenge provides additional benefits and a platform for a growing community to learn how to build PRO reports, helping business users explore data quickly and intuitively, including:
The creator of the best report submitted to the Mini Challenge will receive a $300 Amazon gift card from ZoomCharts.
1. Register for the challenge:
2. Build your report in Power BI:
3. Improve your report and learn new skills:
4. Submit your challenge entry:
If your submission doesn’t match the challenge criteria, you will be notified by email indicating the reason. Don't worry if this happens! You can fix the issue and resubmit your report.
Note: Feel free to resubmit your entry as many times as necessary before the deadline.
5. Finalize your participation to compete for the prize
6. Attend challenge closing webinar to hear the results:
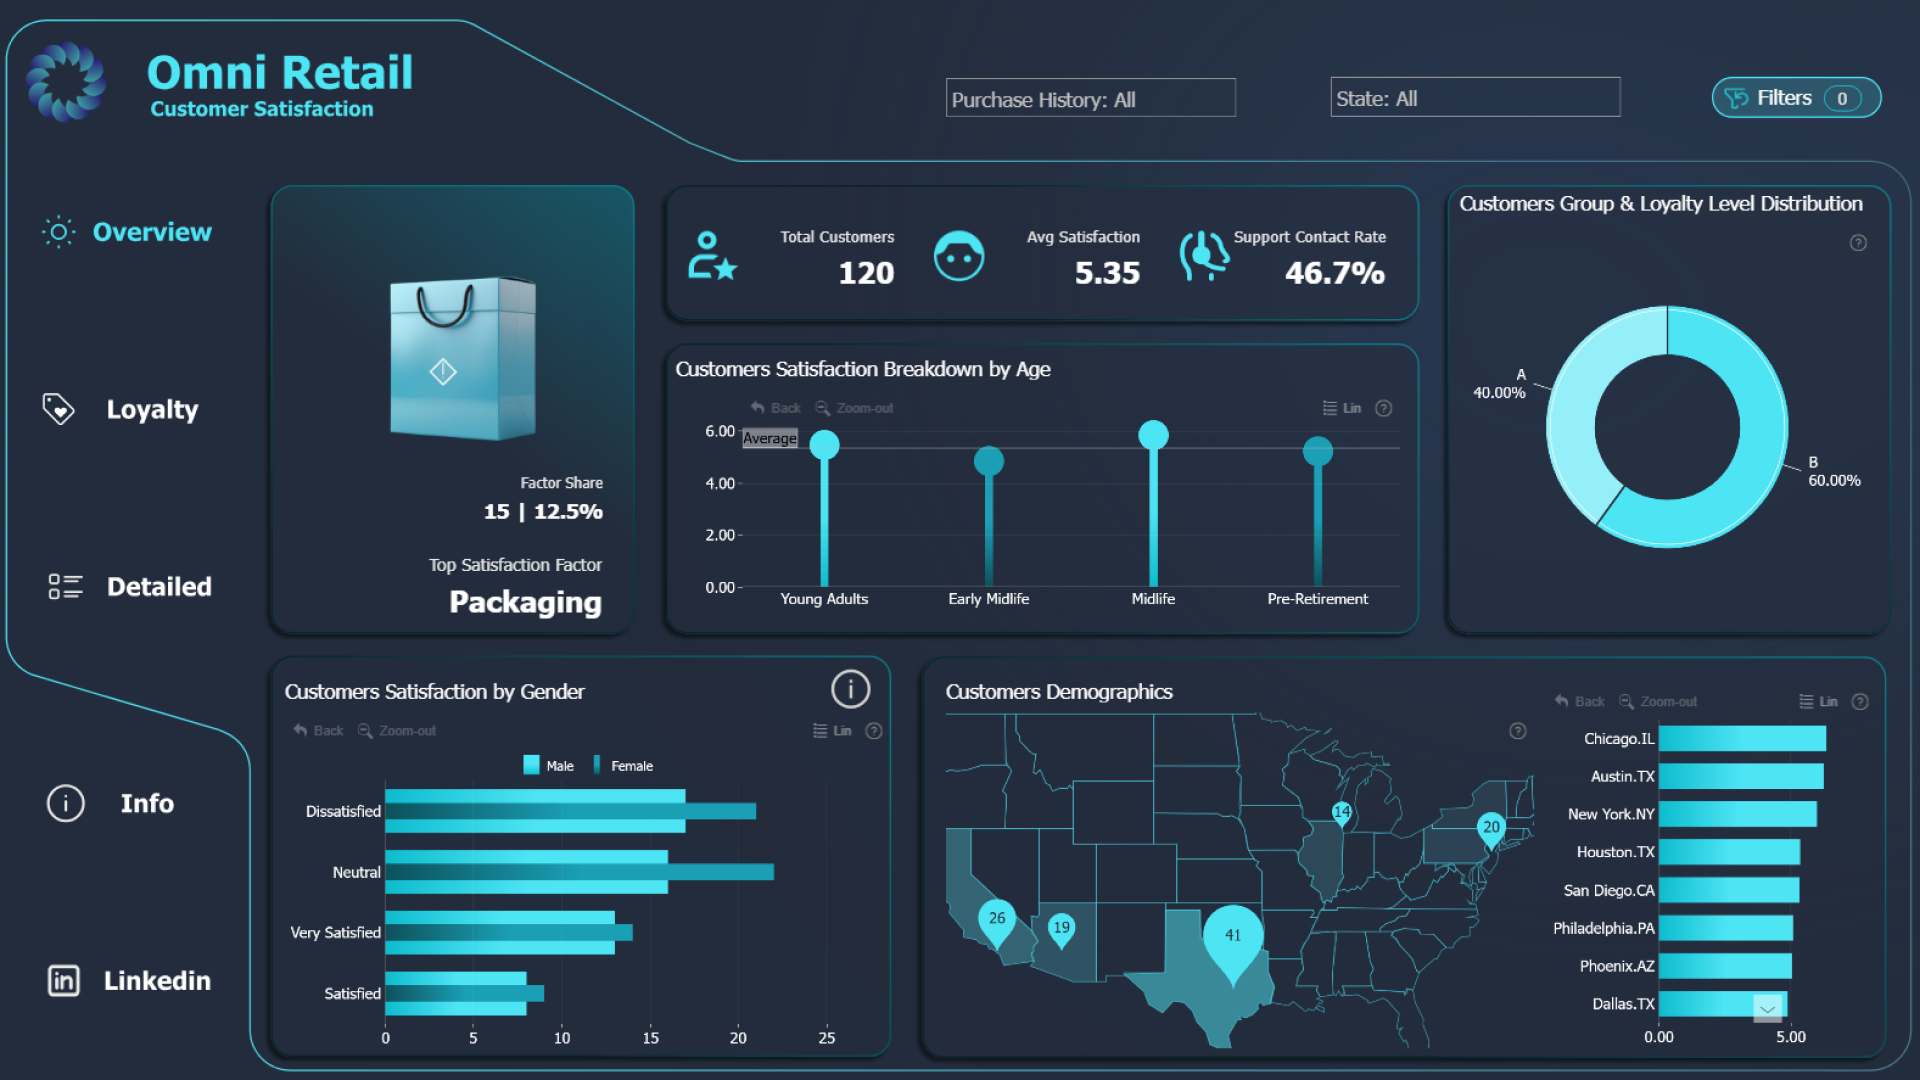
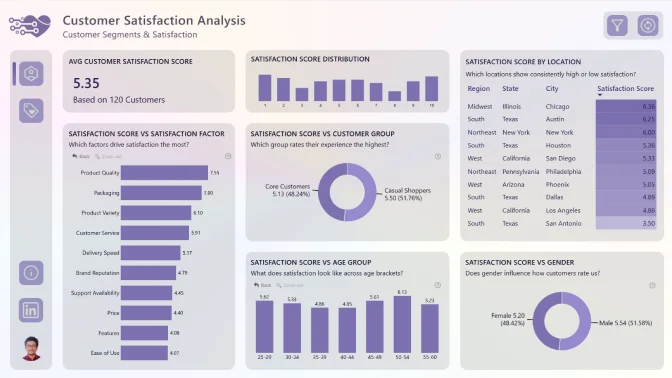
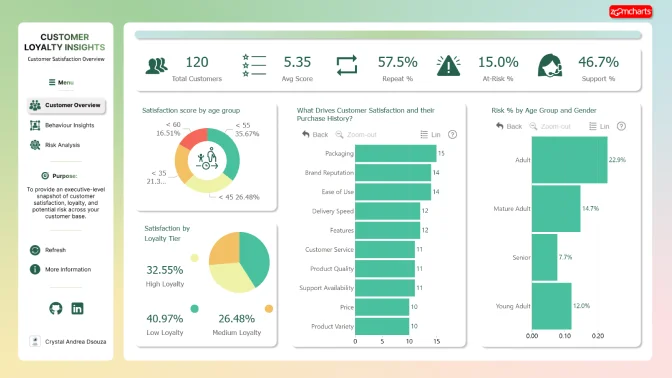
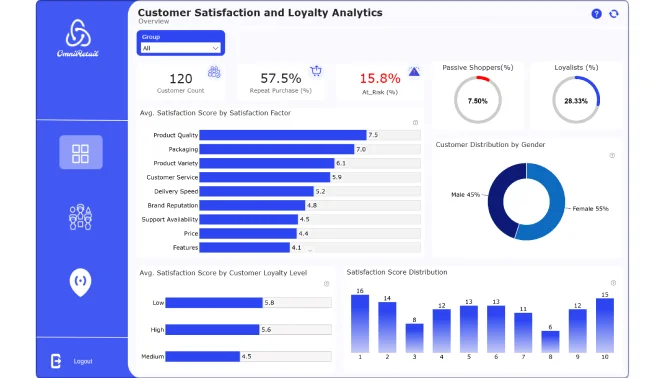
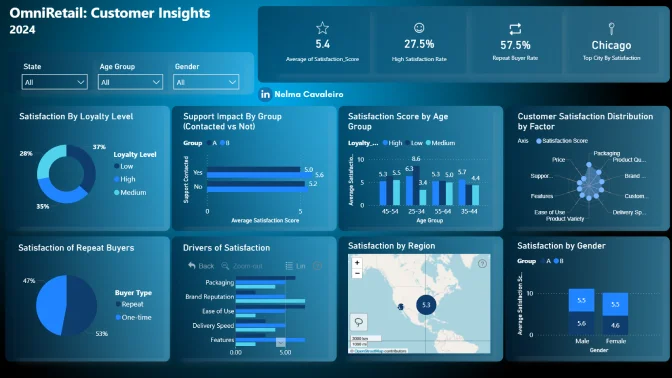
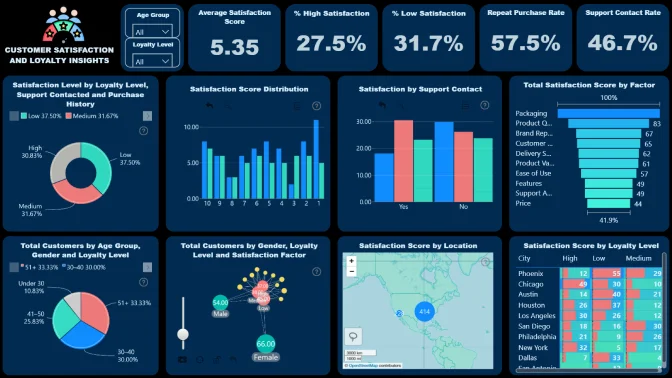
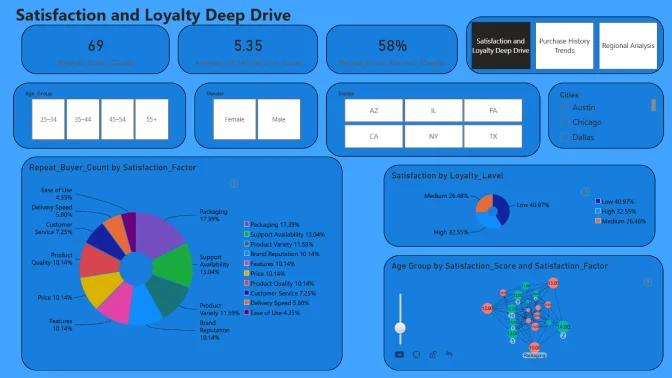
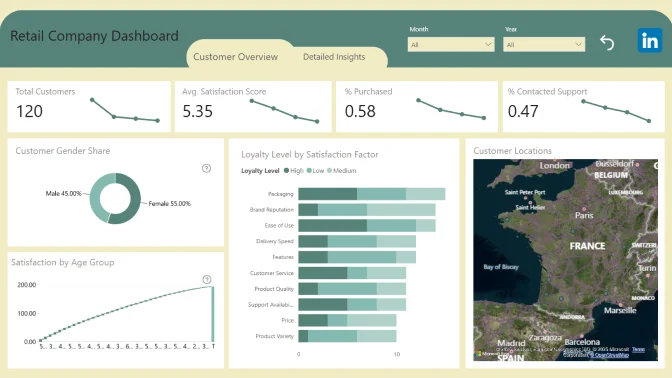
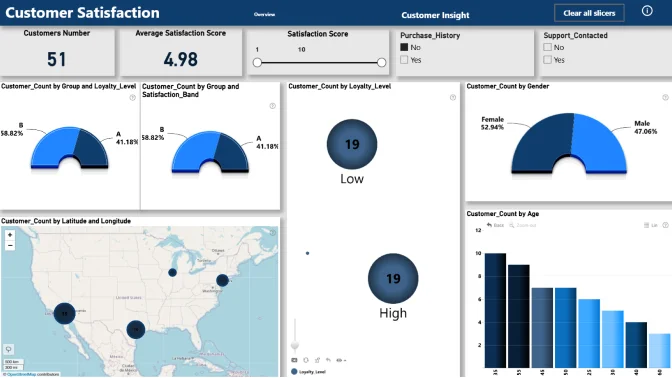
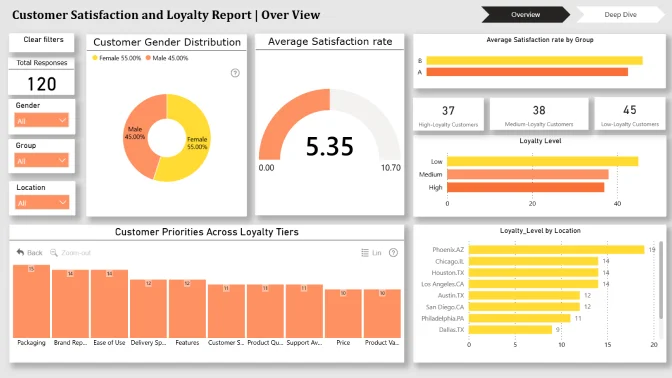
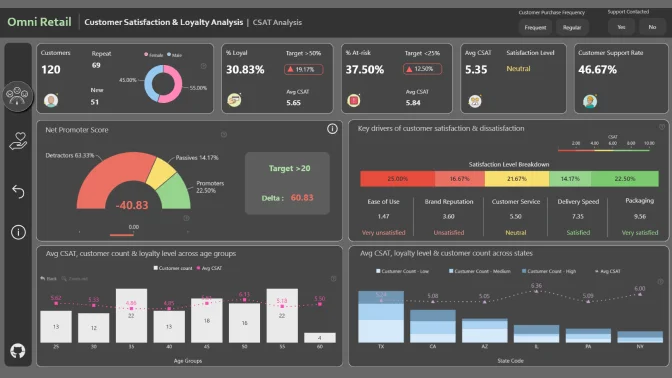
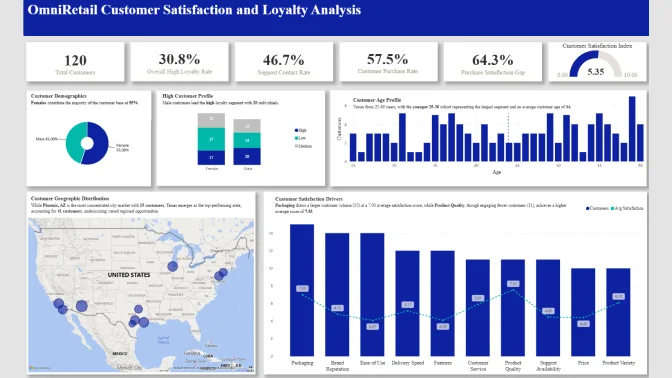
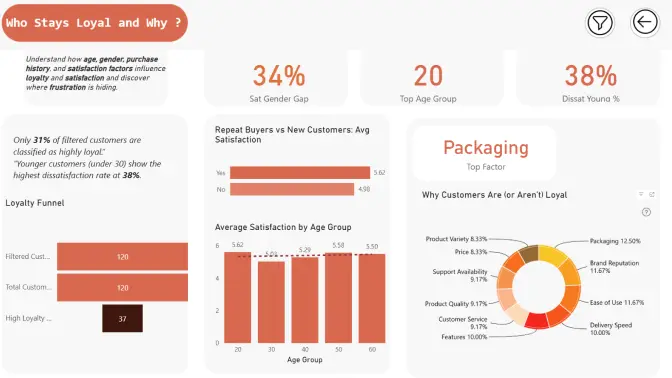
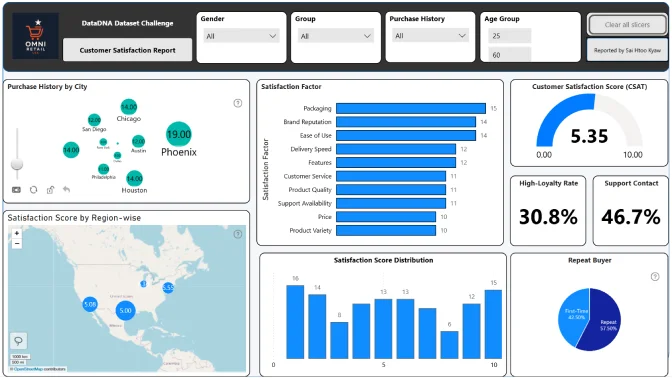
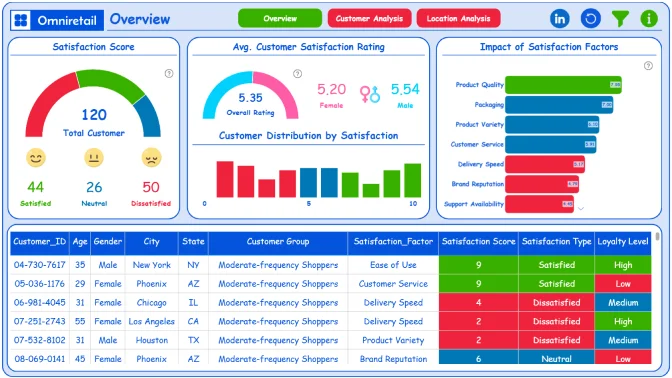
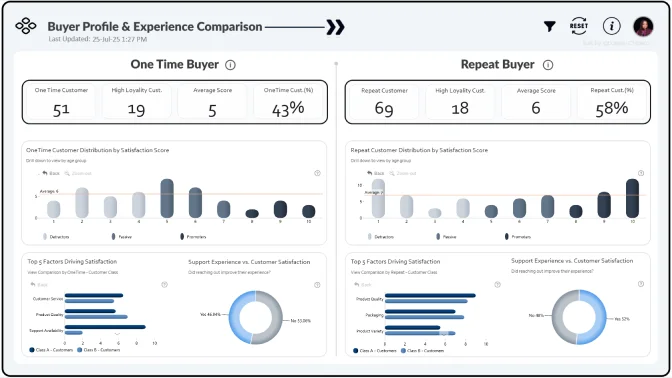
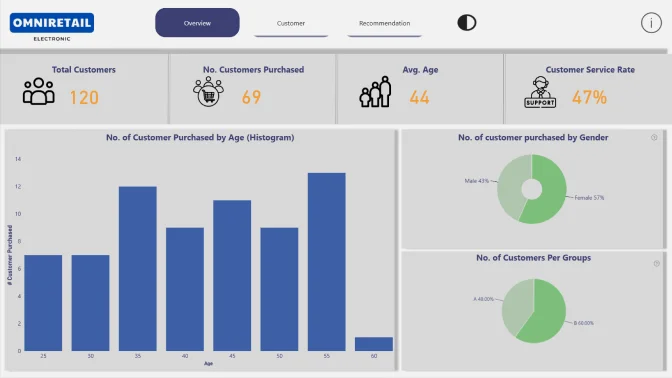
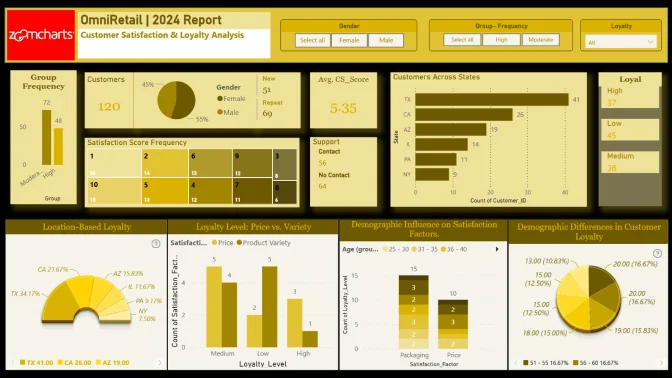
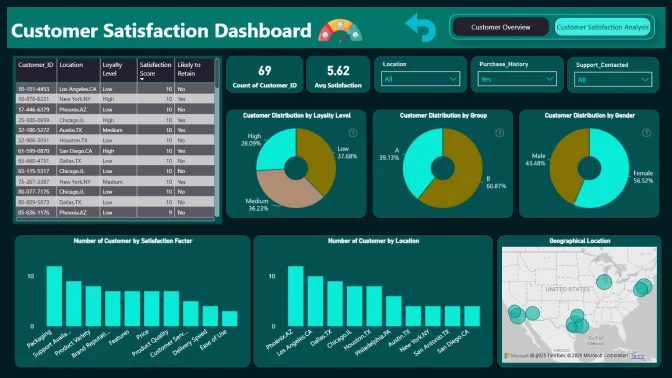
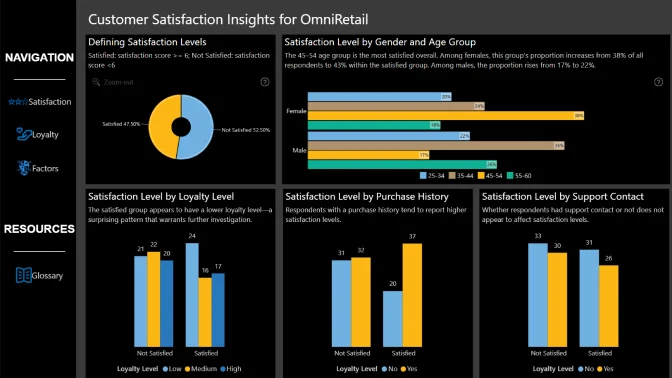
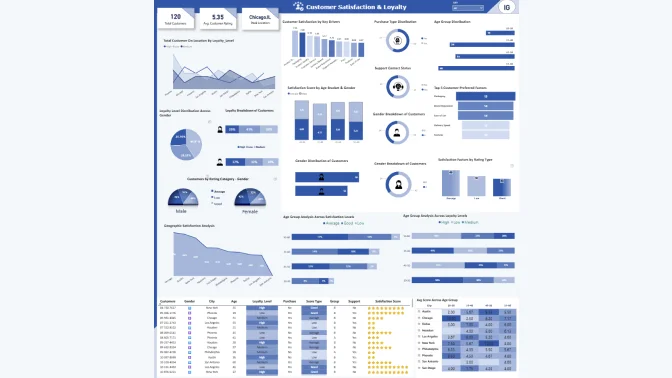
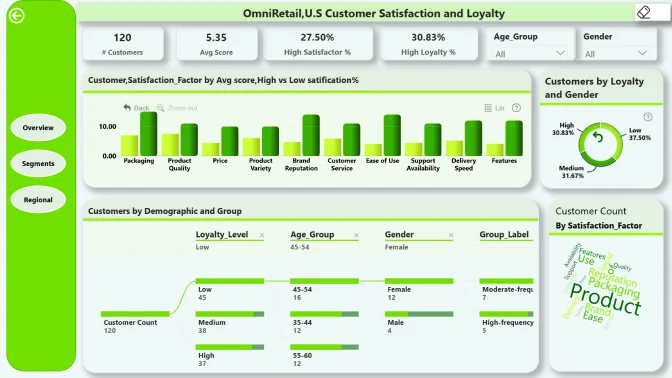
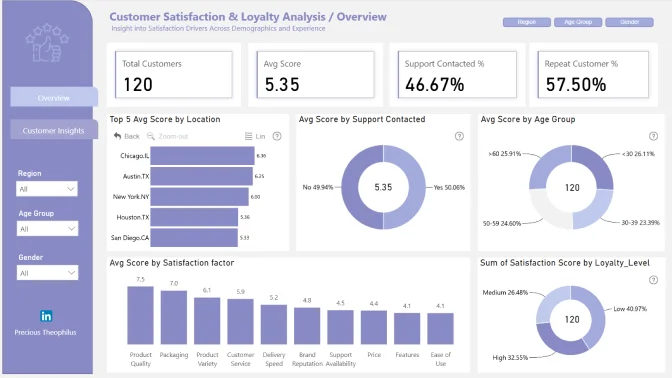
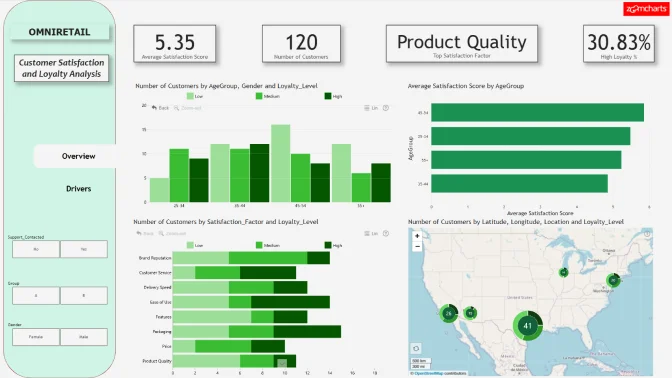
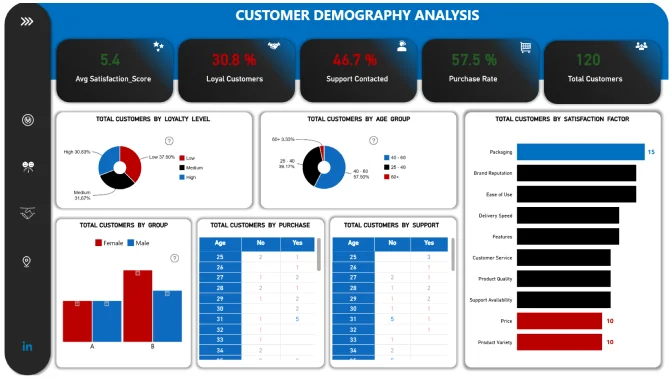
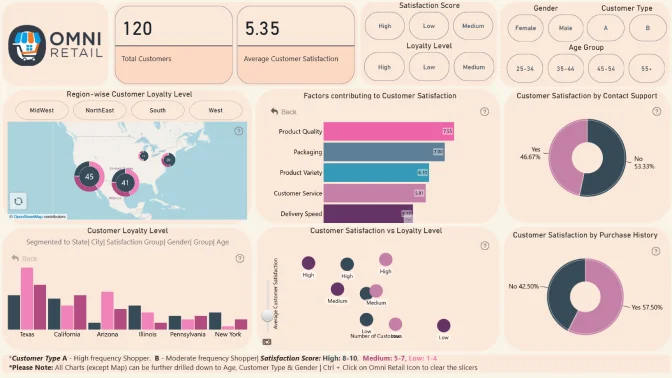
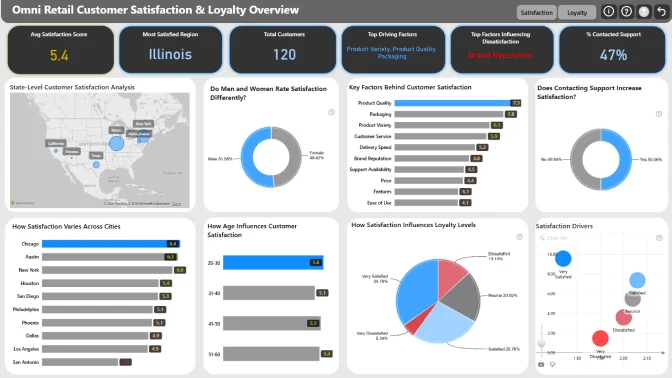
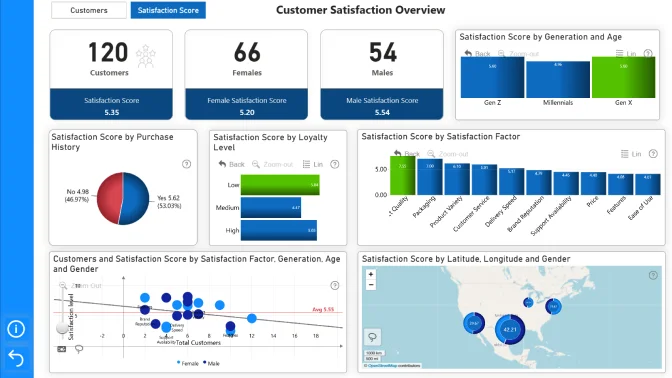
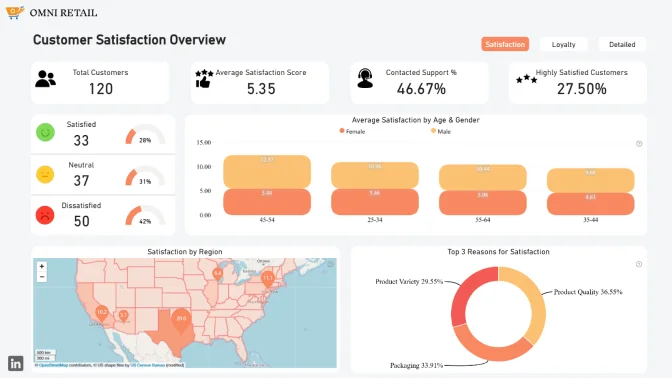
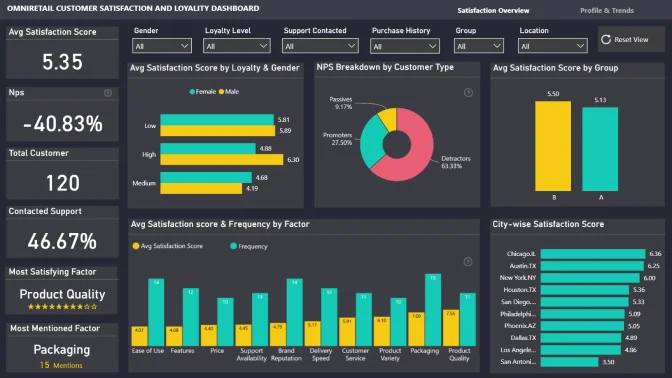
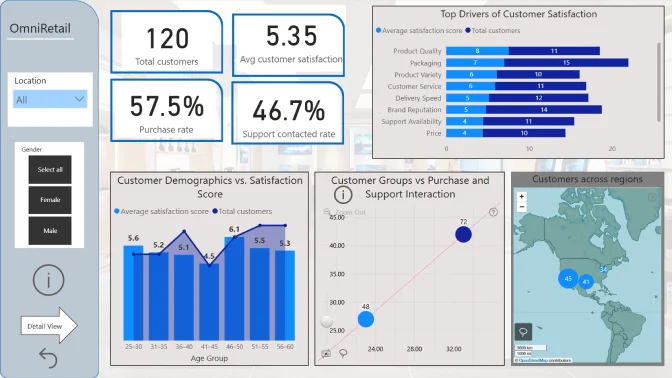
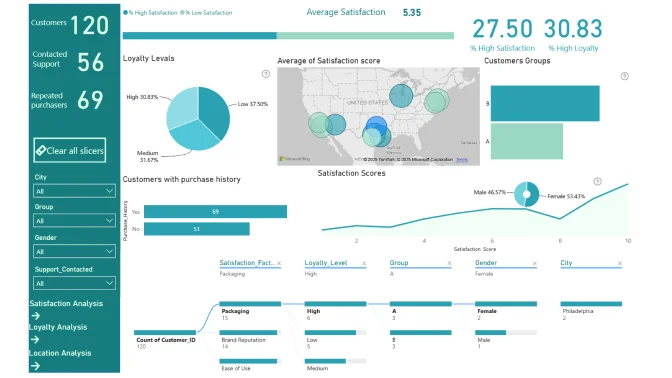
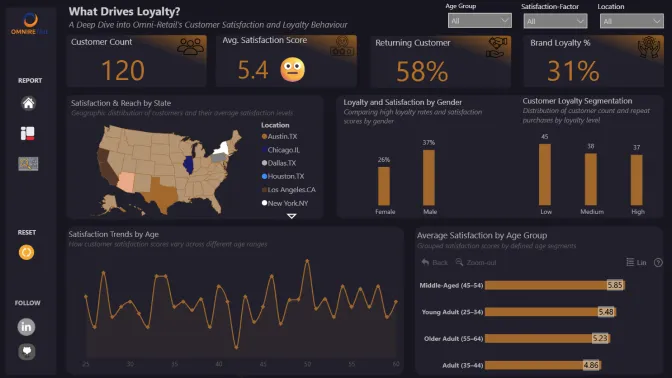
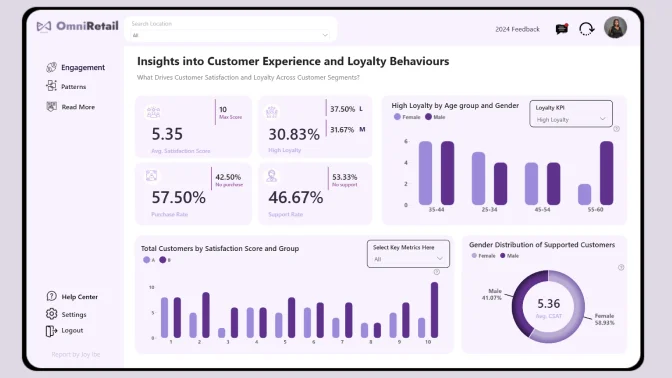
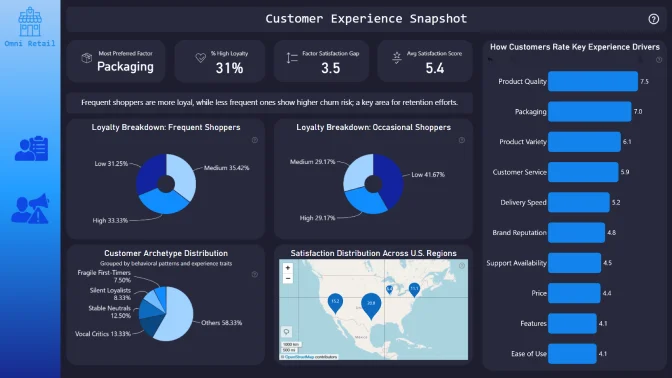
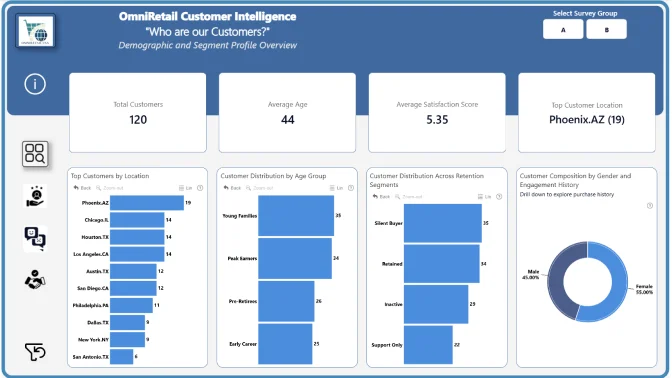
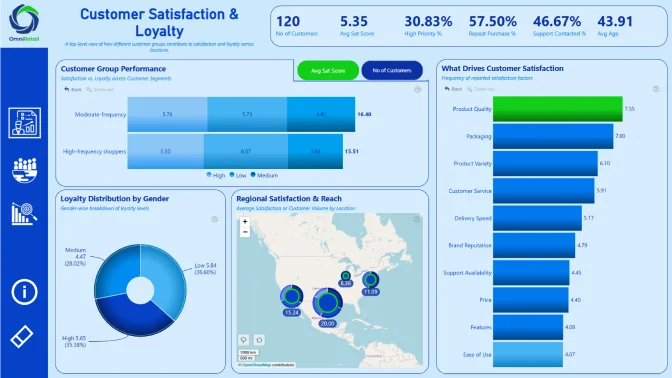
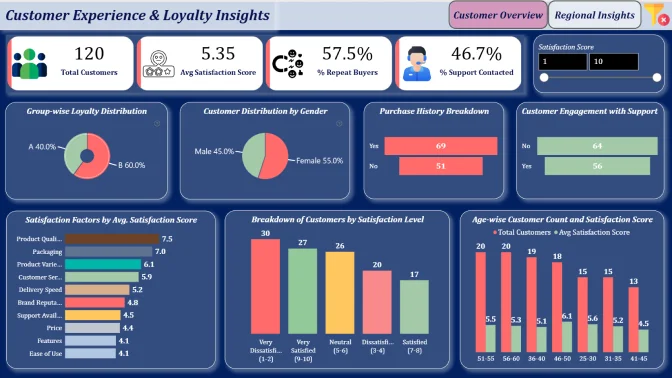
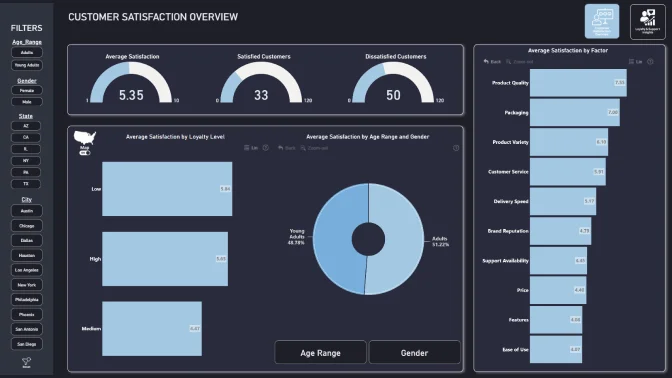
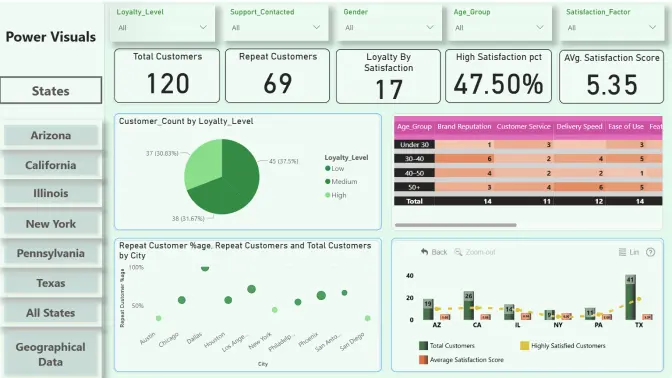
Step into the role of a data analyst at OmniRetail, a U.S. retail chain selling electronics and smart home products through both online and physical stores. To improve customer satisfaction and retention, the company has collected feedback throughout 2024.
You’ve been provided with a customer satisfaction dataset combining satisfaction scores, purchasing behavior, demographics, support history, and location data.
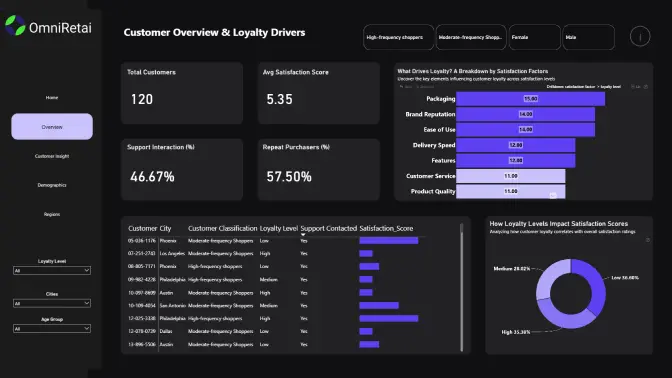
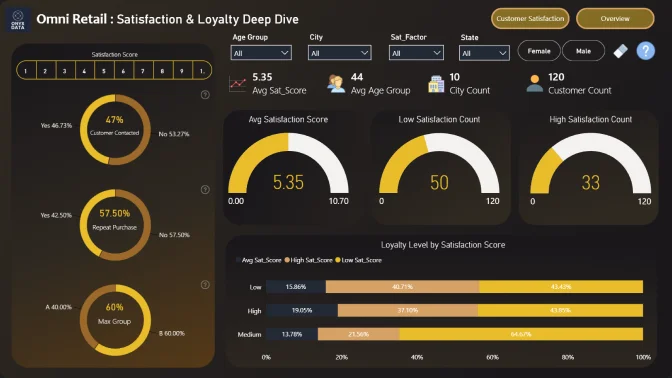
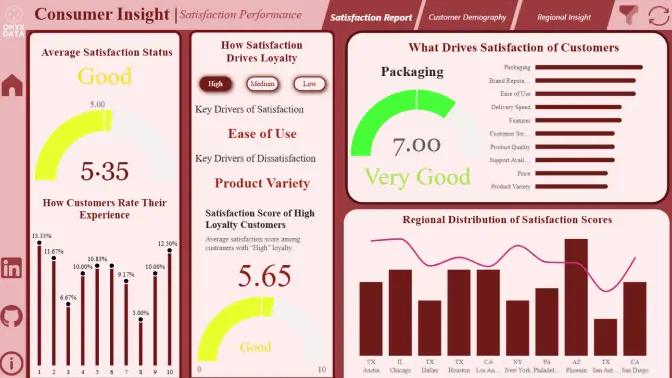
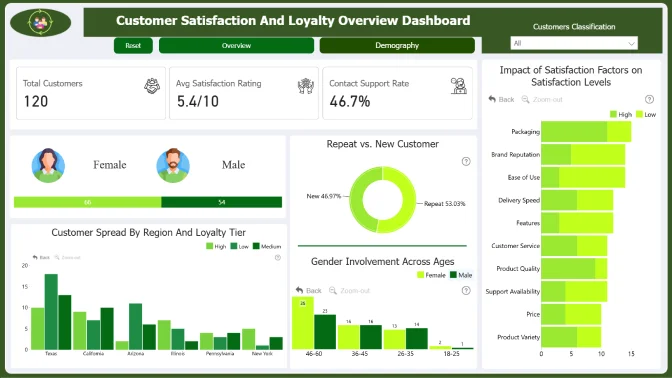
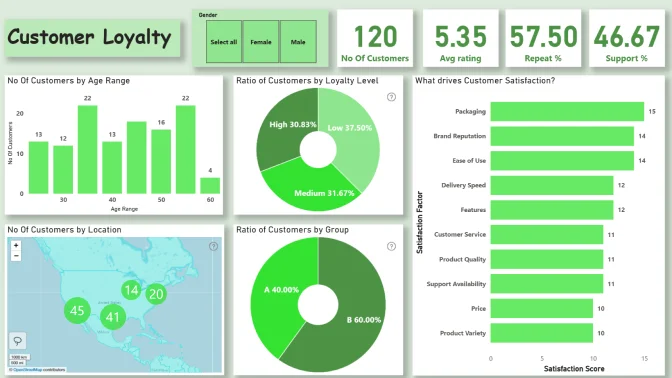
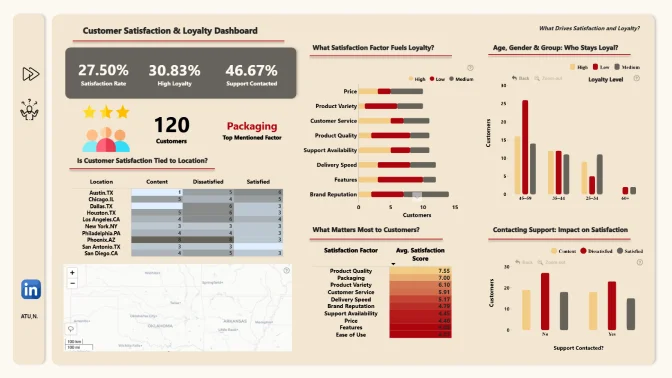
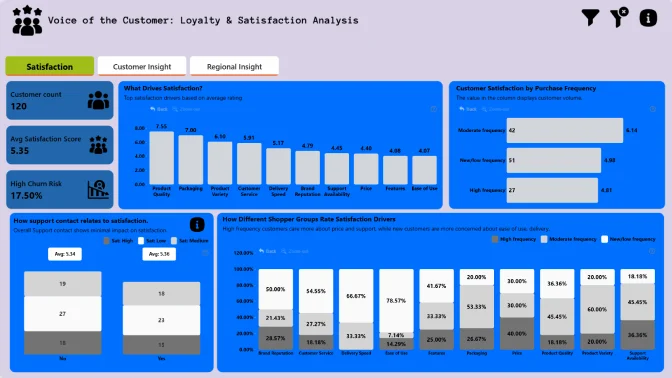
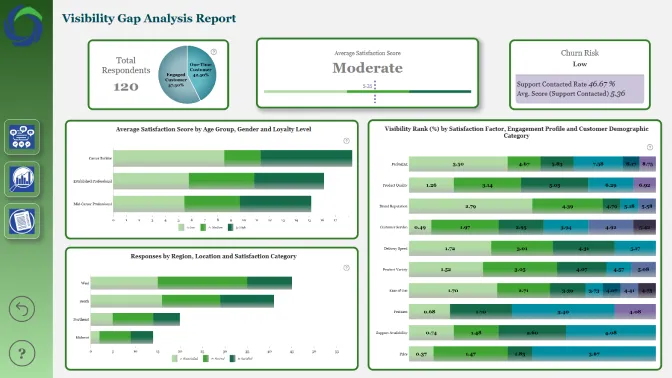
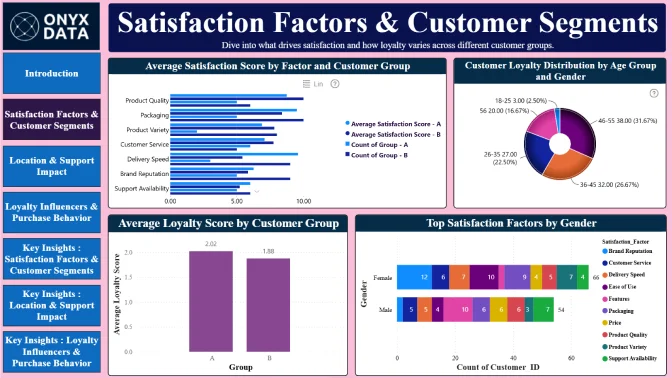
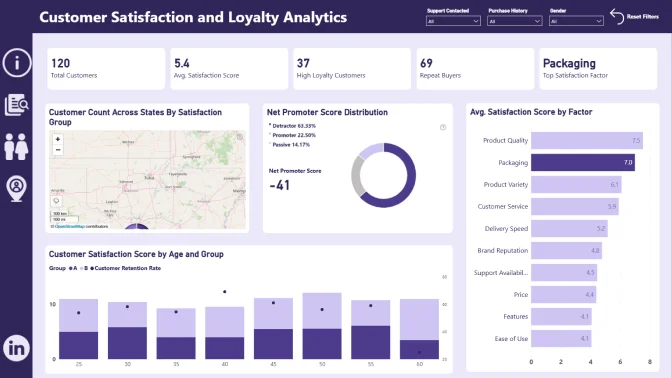
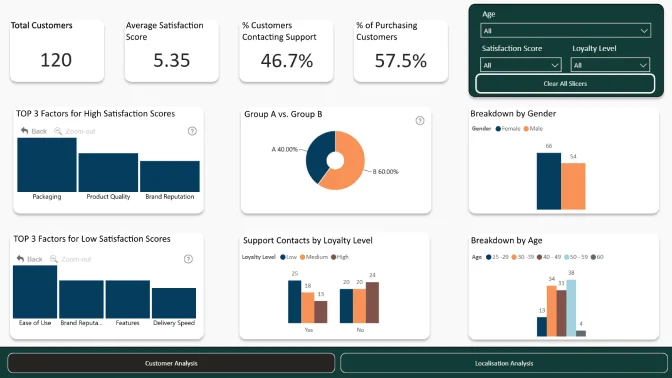
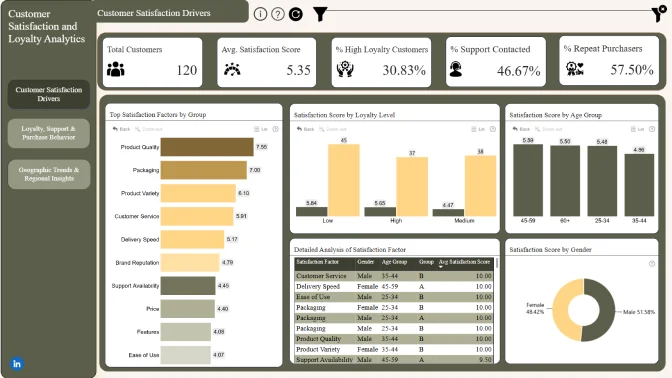
Your mission is to create an analytical report that identifies the key factors influencing customer satisfaction and loyalty across different regions, customer demographics, and support experiences.
Key questions to guide your analysis:
Use these questions as a springboard - don’t hesitate to explore deeper relationships. Your insights could help reshape the customer experience strategy for the brand.
|
Column Name |
Description |
|
Customer_ID |
Unique customer identifier (for internal use only) |
|
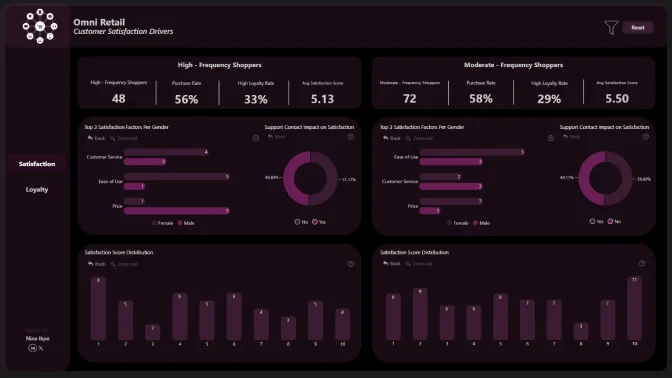
Group |
Customer classification: A, B, or C • Group A: High-frequency shoppers • Group B: Moderate-frequency • Group C: New or low-frequency |
|
Satisfaction_Score |
Customer’s rating of their experience (1 = very poor, 10 = excellent) |
|
Age and Gender |
Demographic attributes |
|
Location |
City and State (e.g., Austin.TX), with Latitude and Longitude for geographic mapping |
|
Purchase_History |
Indicates if the customer has made purchases (Yes/No) |
|
Support_Contacted |
Whether the customer interacted with support |
|
Loyalty_Level |
OmniRetail’s internal rating: Low / Medium / High loyalty |
|
Satisfaction_Factor |
The main reason influencing the satisfaction score (e.g., Price, Product Variety, Packaging) |
Each report is evaluated based on three main criteria: intuitiveness, insightfulness, and interactivity. These factors ensure that the reports are not only accurate and functional, but also meet the target audience's needs and are ready to be presented to the end-users.
Workshop | Power BI Workshop: Building Customer Satisfaction and Loyalty Reports
Workshop | Power BI Workshop: Building Customer Satisfaction and Loyalty Reports
03 July | 08:00
-
Webinar | Top Power BI Reports for Customer Satisfaction Analytics
Webinar | Top Power BI Reports for Customer Satisfaction Analytics
29 July | 08:00
01 July - 24 July