987
Consumer Financial Complaints Report Template
Consumer Financial Complaints Report Template
Report Author: Abhinav Shandilya
987
Share template with others
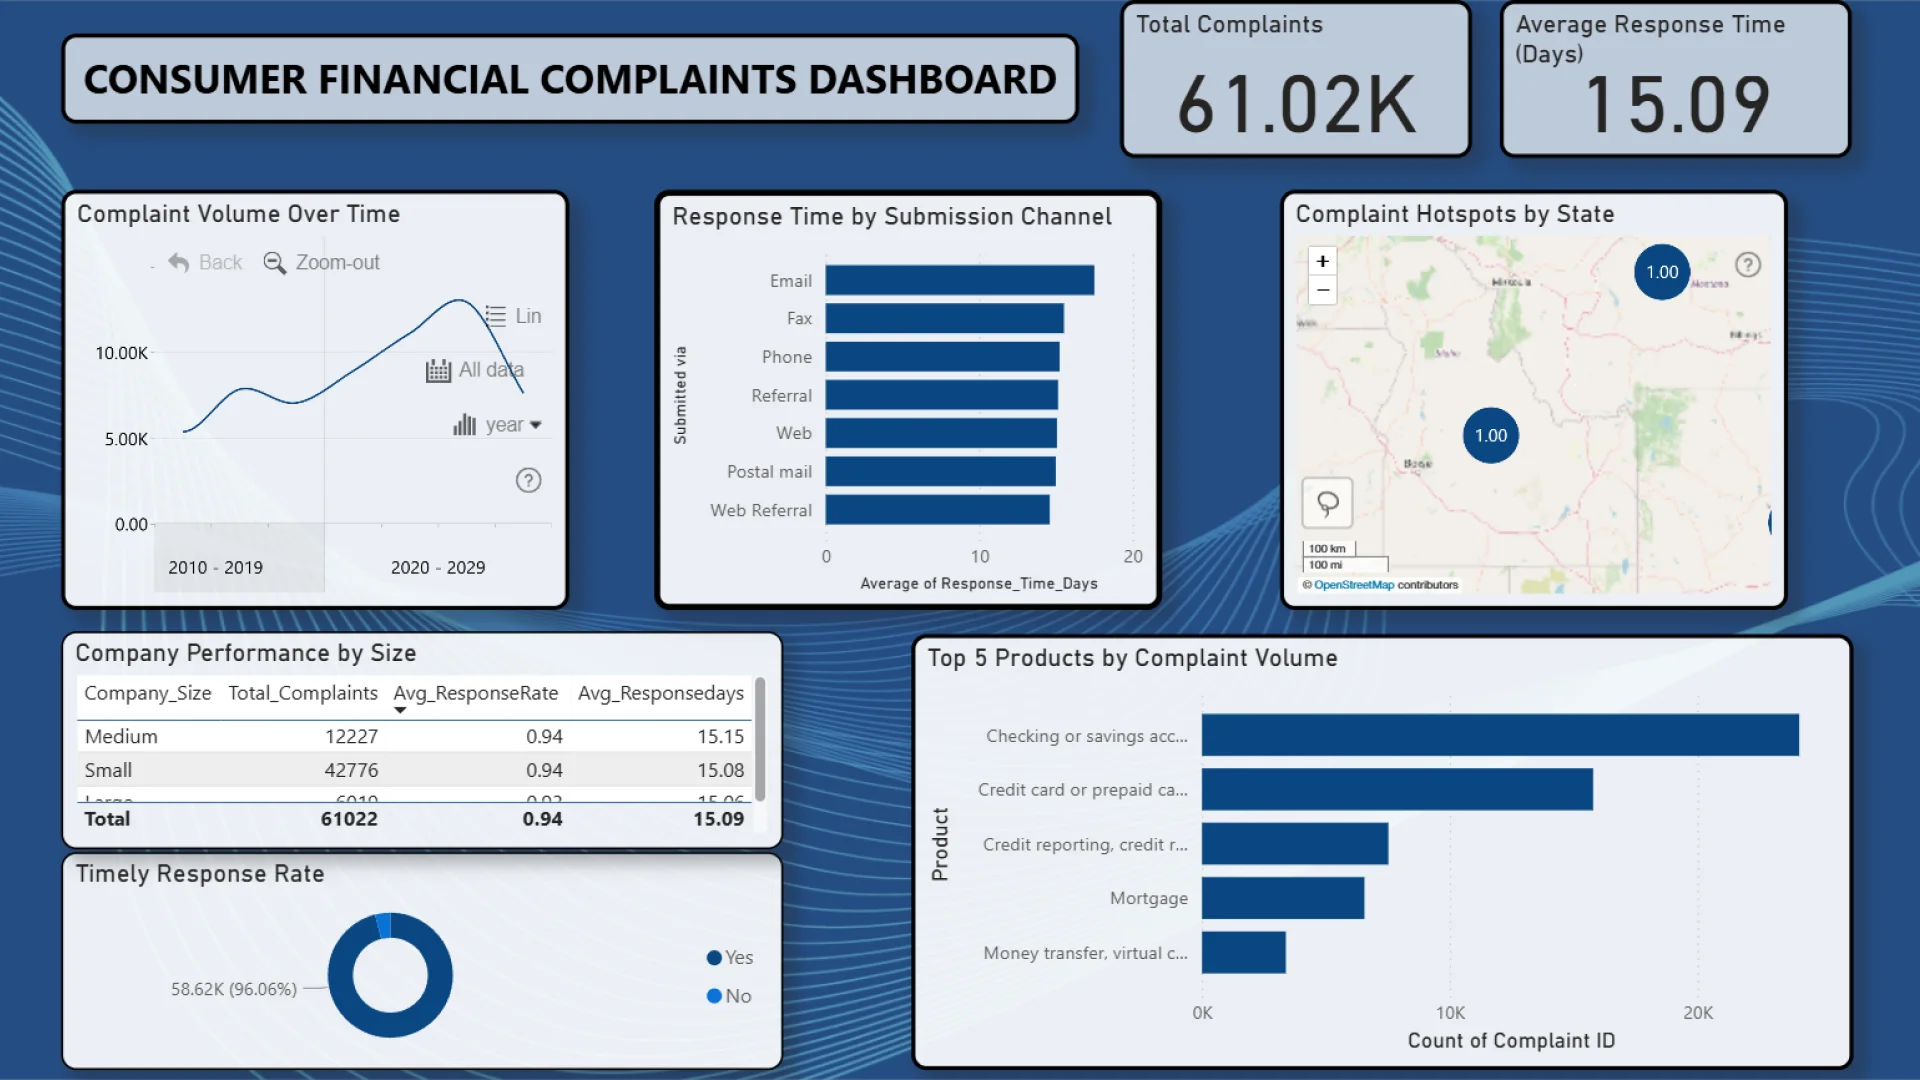
This Consumer Financial Complaints Report Template helps Power BI users build a report for tracking complaint trends, company accountability, and resolution channels.
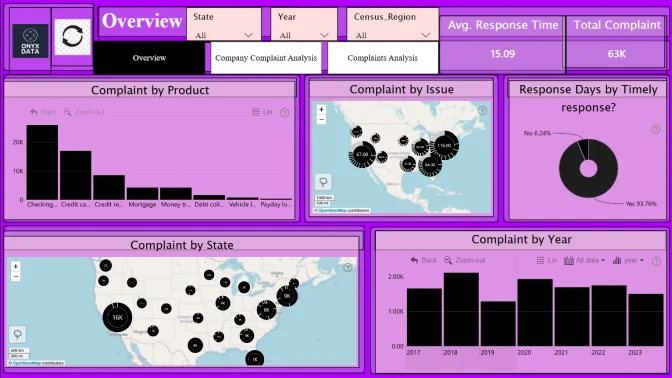
A Power BI dashboard analyzing the CFPB Consumer Financial Complaints dataset. This report identifies key complaint trends over time, geographic hotspots (using ZoomCharts Map PRO), top products by complaint volume, and evaluates company performance on response times and timeliness.
This Power BI report uses the Consumer Financial Complaints Dataset and features ZoomCharts Drill Down PRO custom visuals and native Power BI visuals. It was submitted to the Onyx Data DataDNA ZoomCharts Mini Challenge in October 2025.
4U Report Challenges
Participate in data challenges, build and submit reports to get free template downloads.
Join CommunityMobile view allows you to interact with the report. To Download the template please switch to desktop view.

Was this helpful? Thank you for your feedback!
Sorry about that.
How can we improve it?