803
Candy Market Share Analysis Project Challenge
Candy Market Share Analysis Project Challenge
More Report pages
Report Author: Shelly Nagar
803
Share template with others
Report submitted for the FP20 Analytics ZoomCharts Challenge, November 2024. The report was built using the Candy Market Share dataset and includes ZoomCharts custom Drill Down PRO visuals for Power BI.
Author's description:
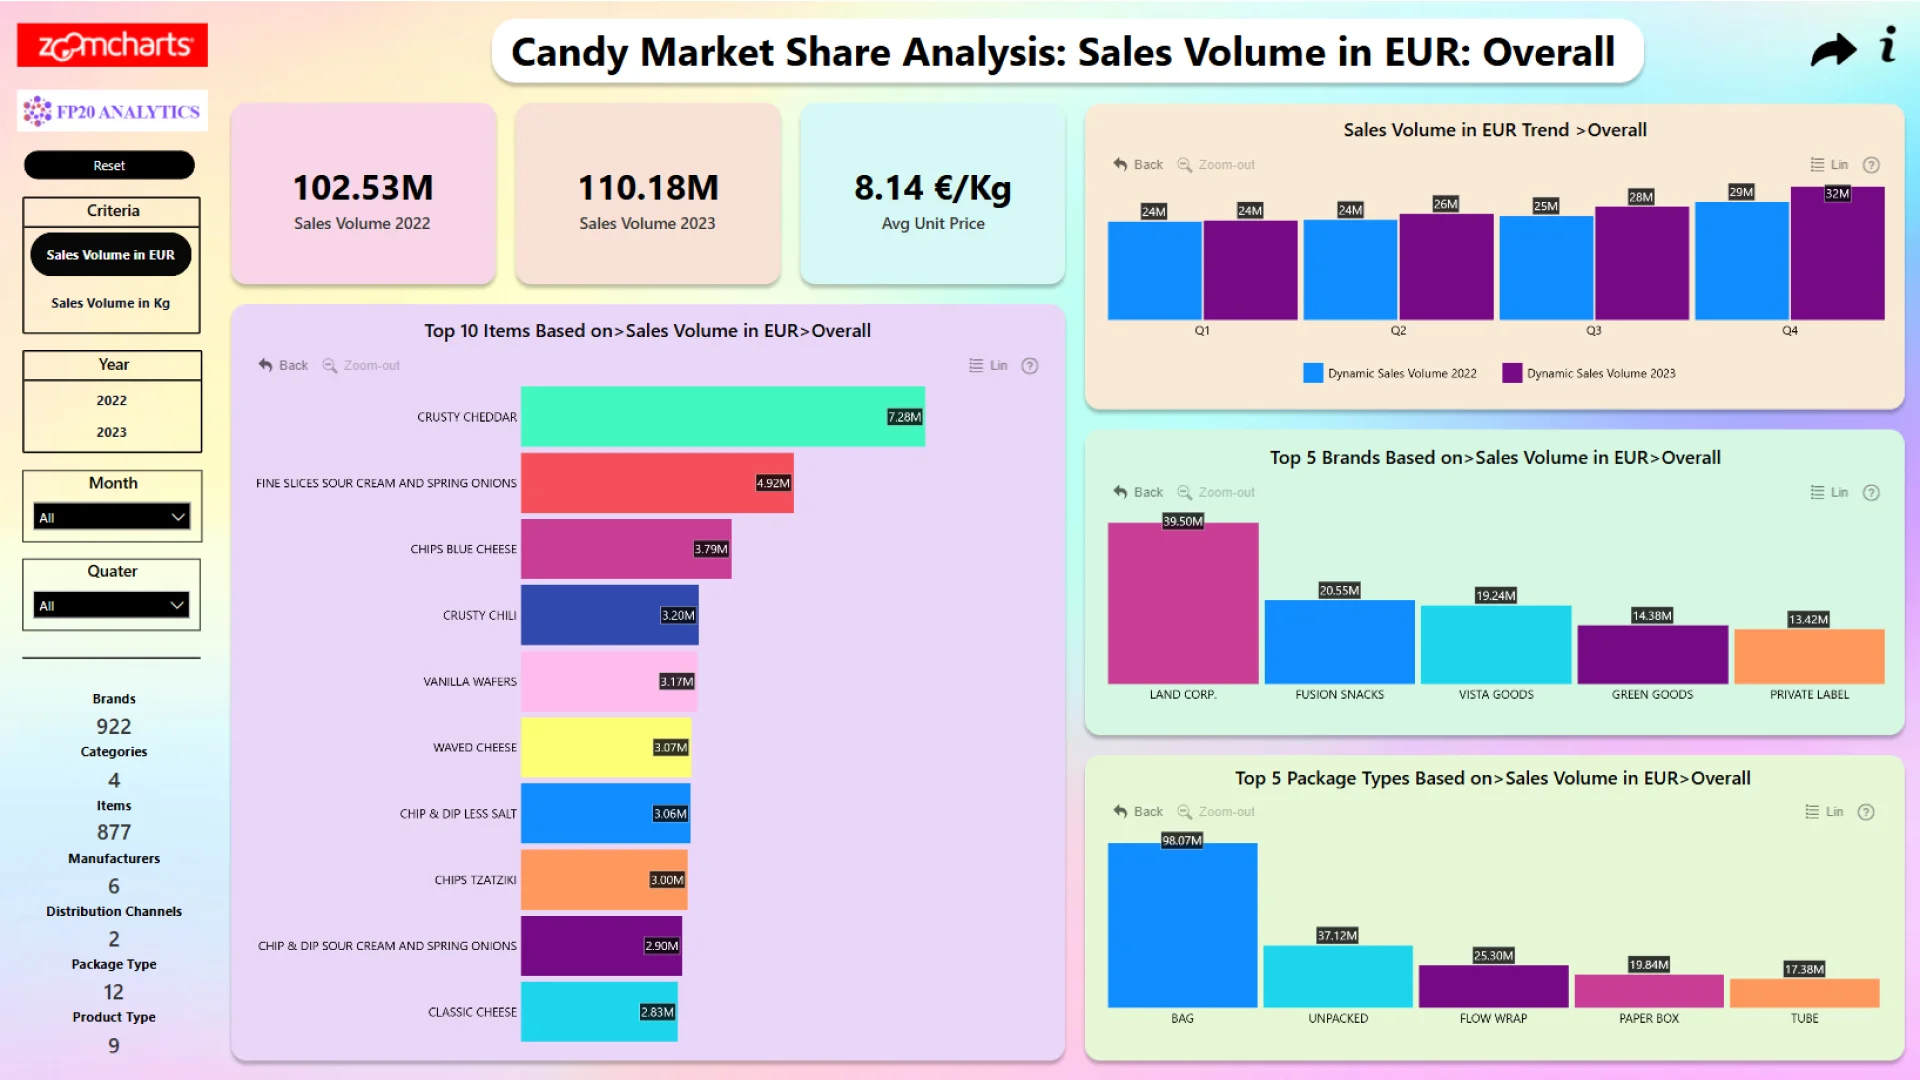
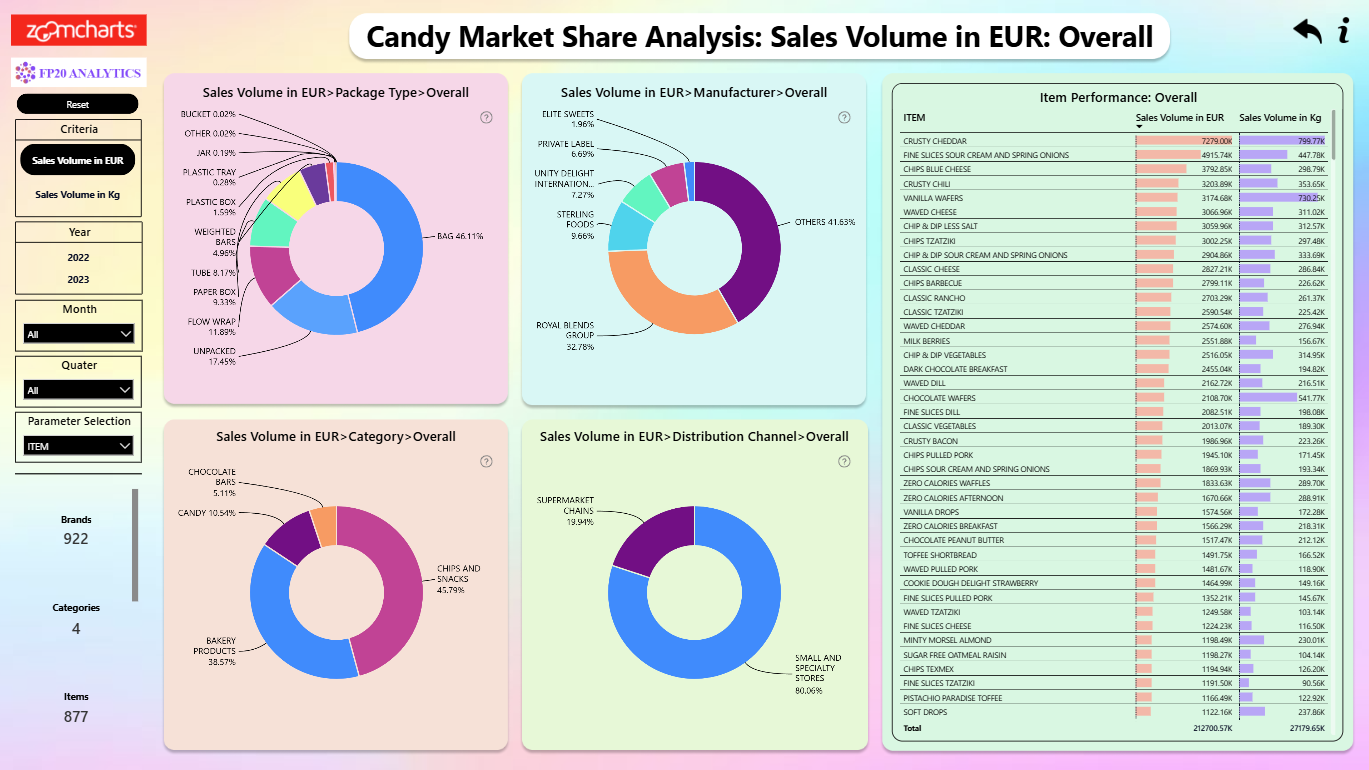
This Power BI project analyzes confectionery market data from a leading European market research company, focusing on manufacturers, brands, packaging types, and sales volumes. The interactive report visualizes market share dynamics, sales trends, and category-level insights, addressing key business questions such as identifying top-selling candy items, analyzing sales by weight and revenue, and evaluating the performance of manufacturers, brands, and distribution channels. Using custom DAX measures and calculated tables, the report enhances interactivity and provides actionable insights to support strategic decision-making, helping stakeholders optimize product strategies and drive business growth.
4U Report Challenges
Participate in data challenges, build and submit reports to get free template downloads.
Join CommunityMobile view allows you to interact with the report. To Download the template please switch to desktop view.

Was this helpful? Thank you for your feedback!
Sorry about that.
How can we improve it?