701
Candy Market Share Analysis 6
Candy Market Share Analysis 6
More Report pages
Report Author: Sushree Jena
701
Share template with others
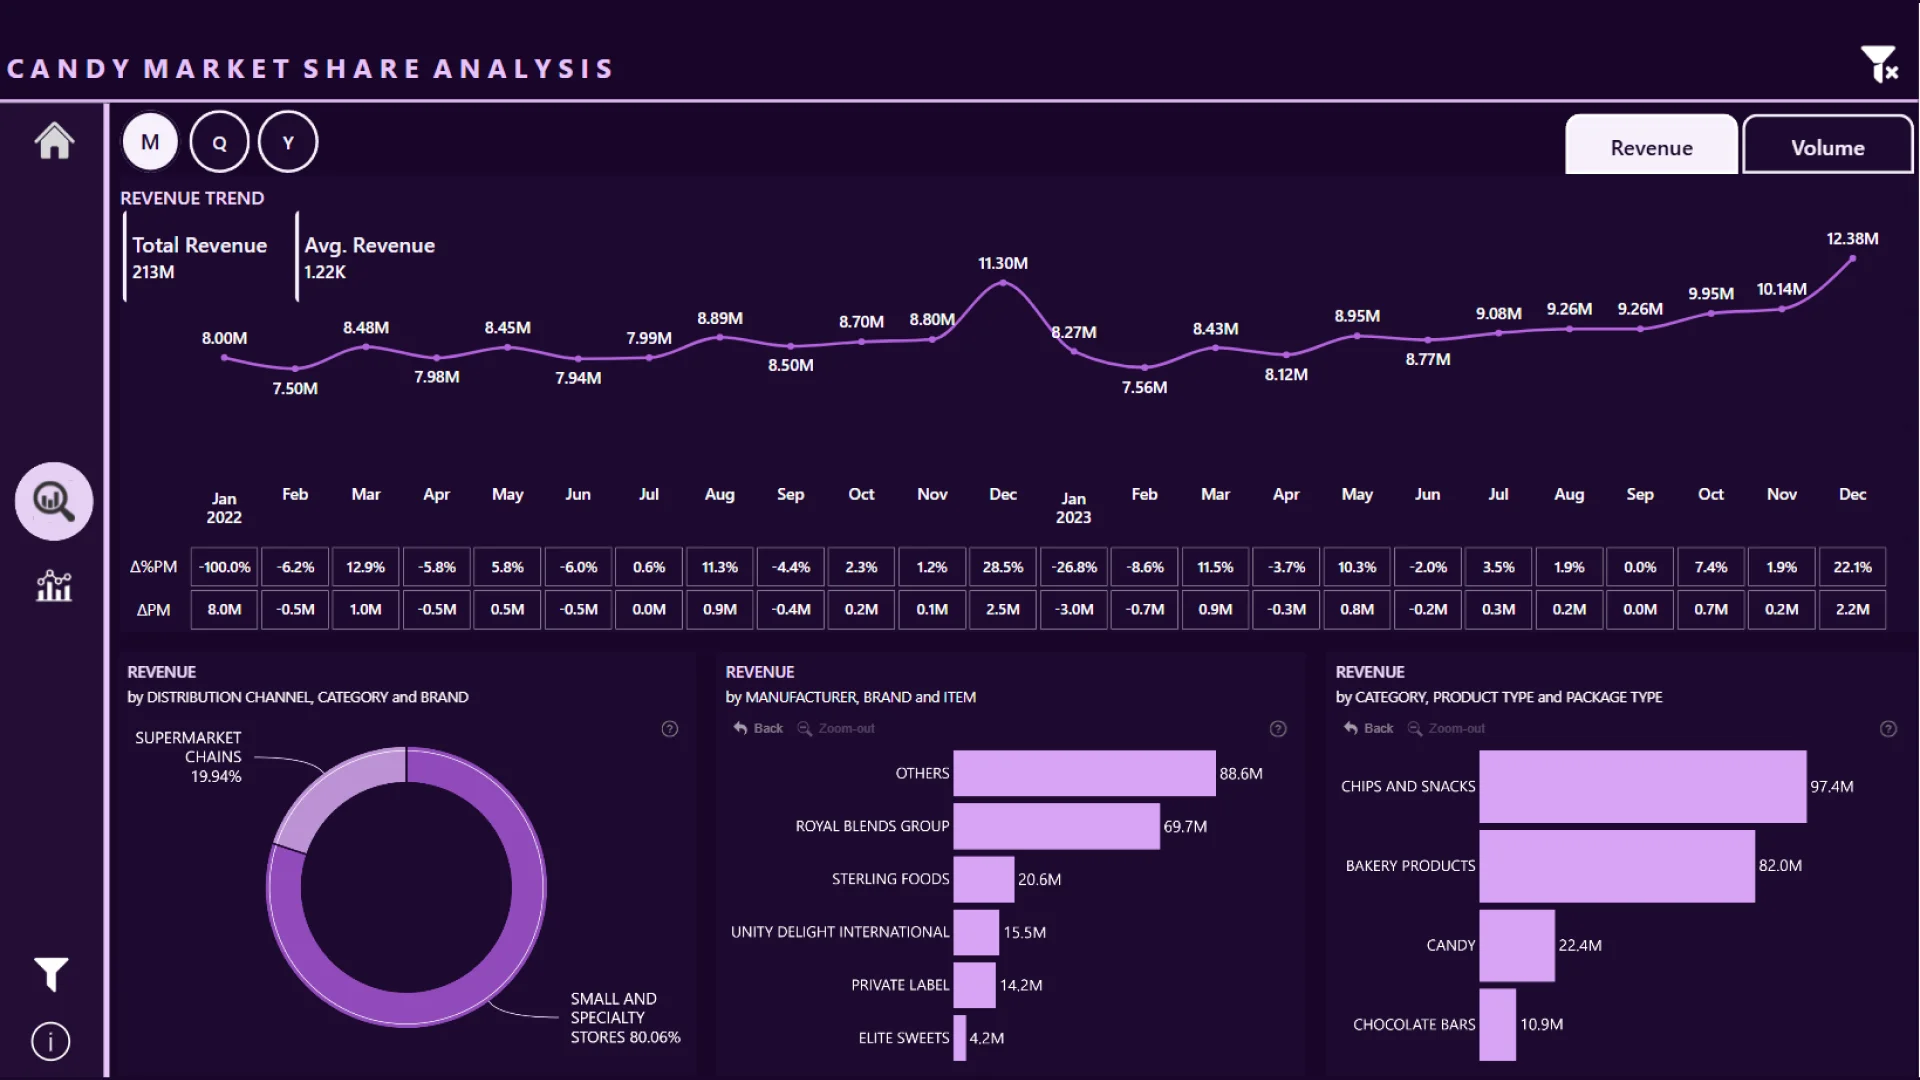
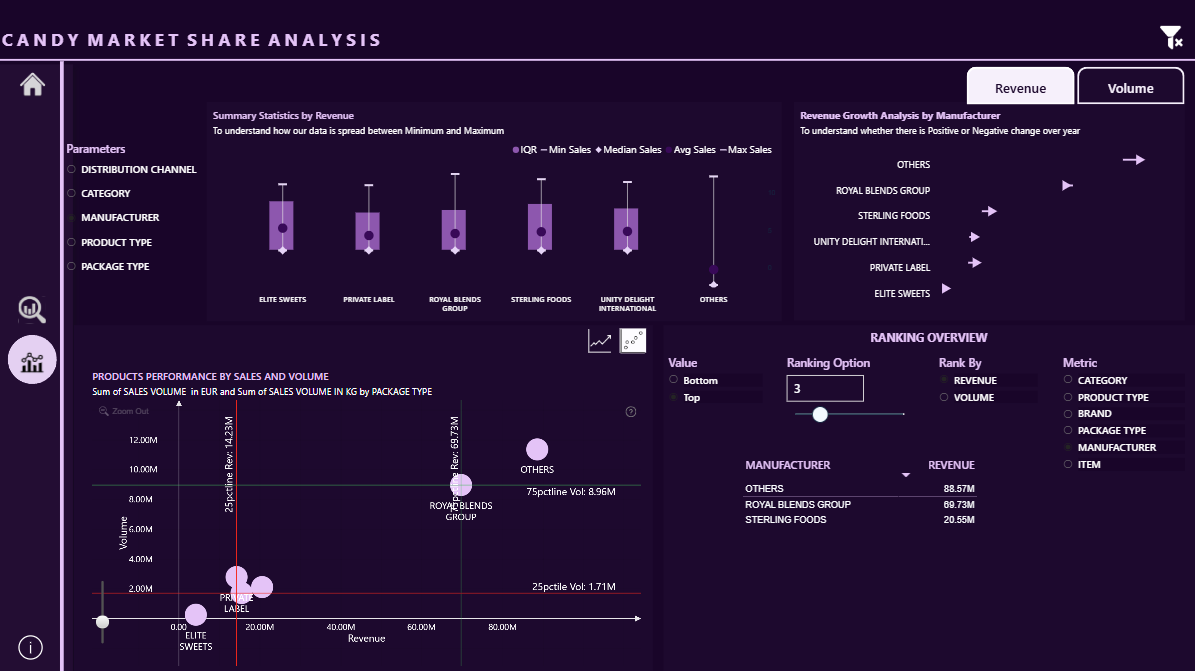
Report submitted for the FP20 Analytics ZoomCharts Challenge, November 2024. The report was built using the Candy Market Share dataset and includes ZoomCharts custom Drill Down PRO visuals for Power BI.
Author's description:
The Candy Market Analysis Dashboard presents a detailed view of sales trends, product performance, and distribution channels across various candy and snack categories. This dashboard allows users to explore data on revenue, volume, product types, and brand performance, offering insights for market strategies and growth opportunities.
4U Report Challenges
Participate in data challenges, build and submit reports to get free template downloads.
Join CommunityMobile view allows you to interact with the report. To Download the template please switch to desktop view.

Was this helpful? Thank you for your feedback!
Sorry about that.
How can we improve it?