941
Campaign Performance Analysis
Campaign Performance Analysis
Report Author: Win Lai
941
Share template with others
Report submitted for OnyxData #DataDNA and ZoomCharts Challenge June 2024. The report was built with the Marketing Campaing Dataset and includes ZoomCharts custom Drill Down PRO visuals for Power BI.
Author's description:
Throughout this challenge, I’ve explored the dynamic intersection of data and marketing, uncovering key insights and trends that drive impactful campaigns. Here are some highlights from my dashboard:
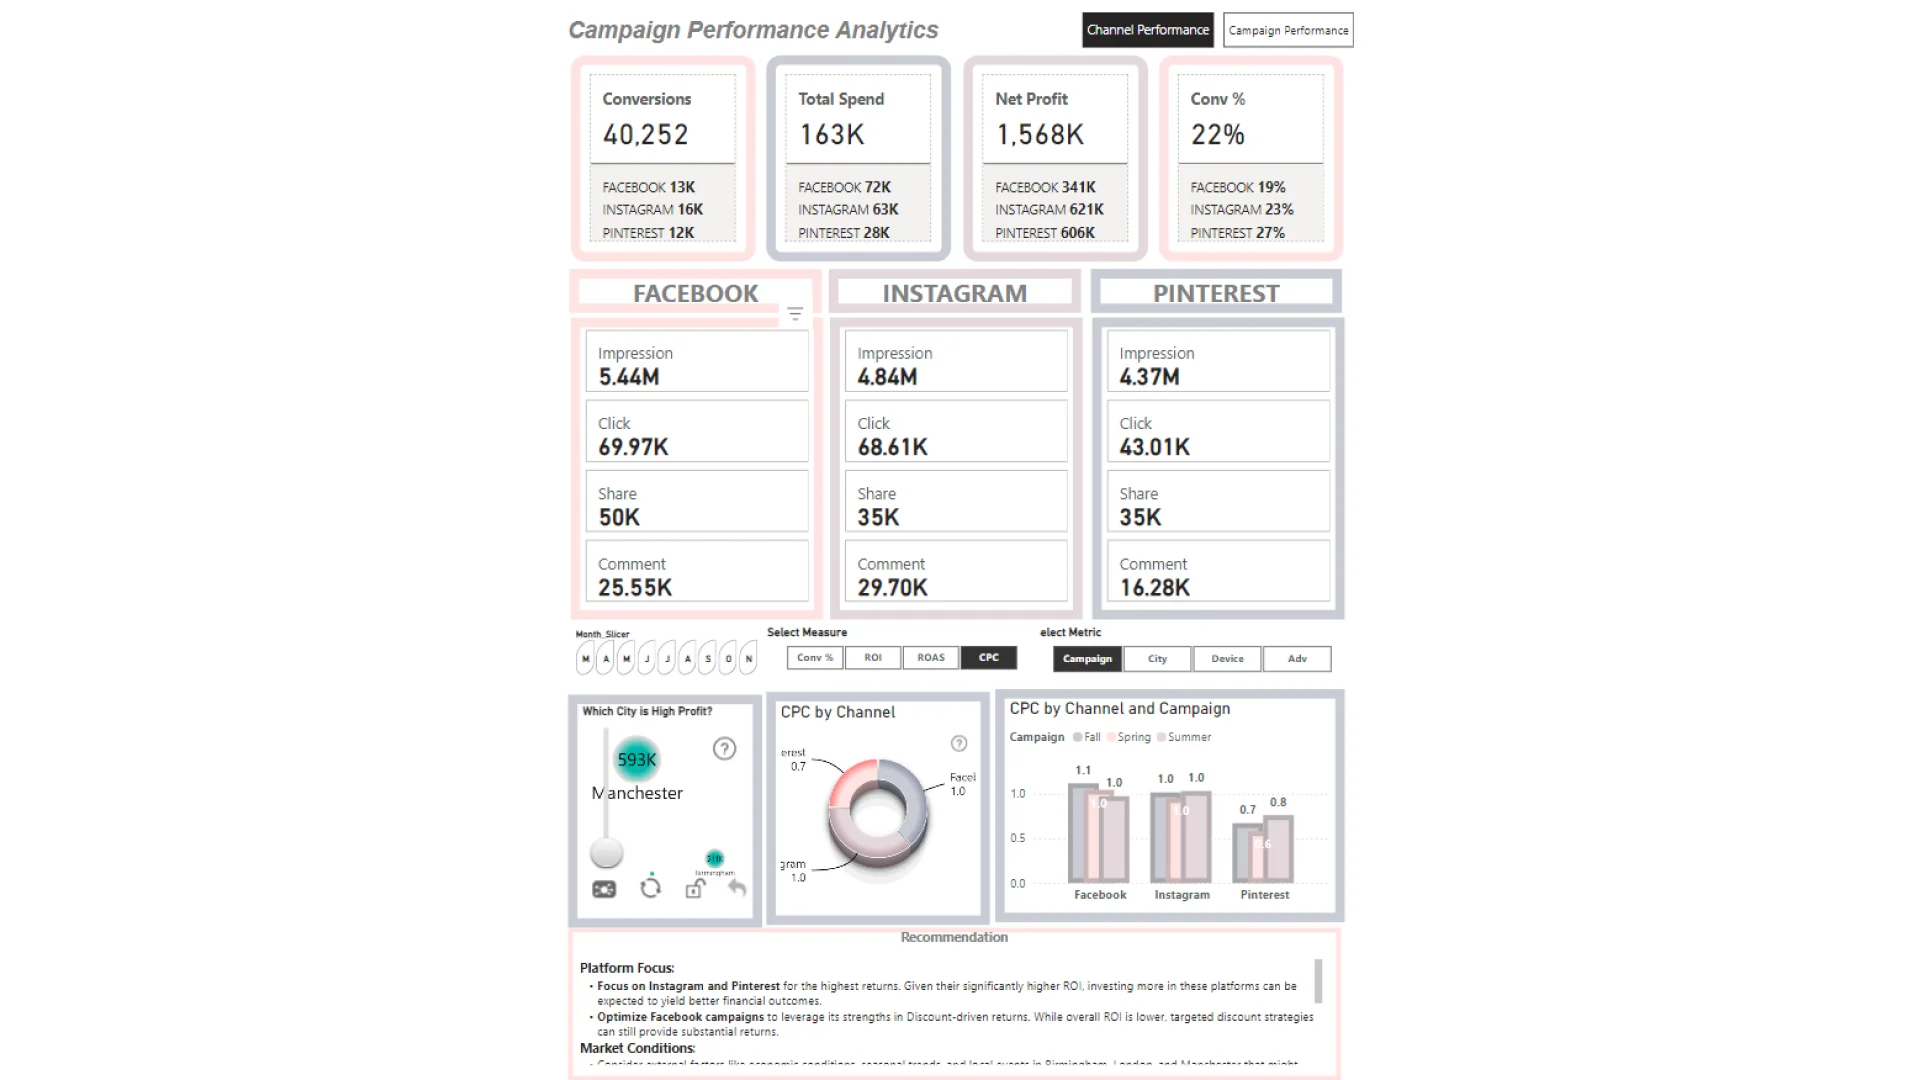
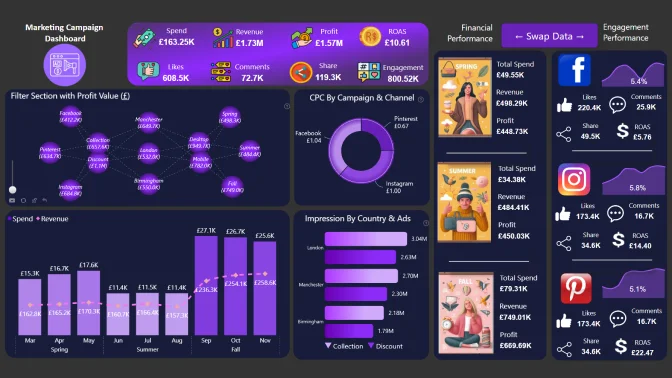
🔍 Seasonal Campaign Performance: Fall emerged as the powerhouse season with the highest ROI in Manchester (155%), signaling peak consumer engagement and spending. Summer showcased exceptional ad efficiency with the highest overall ROAS (14.09), despite lower ROI percentages. Spring provided steady returns, with Manchester leading again (102%), reflecting consistent engagement.
📊 City-Specific Insights: Manchester consistently outperformed Birmingham and London across all seasons, demonstrating robust engagement and conversion rates. London highlighted opportunities for more targeted strategies to enhance campaign effectiveness and ROI.
💡 Strategic Recommendations: Focus Fall campaigns on Manchester and Birmingham to capitalize on high returns. Optimize Summer spending to leverage high ROAS and maintain engagement, especially in Manchester. Balance Spring campaigns to drive steady growth and stabilize returns across all cities.


4U Report Challenges
Participate in data challenges, build and submit reports to get free template downloads.
Join CommunityMobile view allows you to interact with the report. To Download the template please switch to desktop view.
How to use a PBIX template
Preview the interactive report, download the PBIX file, open it in Power BI Desktop, and replace the same data connection with your own dataset.
Preview and download
Explore the report online and download the PBIX template file.
Open in Power BI Desktop
Open the downloaded PBIX file in Power BI Desktop.
Connect your data
Replace the sample data source with your own dataset.
Refresh and adjust
Refresh the model and update fields or visual were needed.
Save and share
Save your report and publish it for your audience.


