677
Marketing Campaign Analysis 11
Marketing Campaign Analysis 11
Report Author: Sharad Suman
677
Share template with others
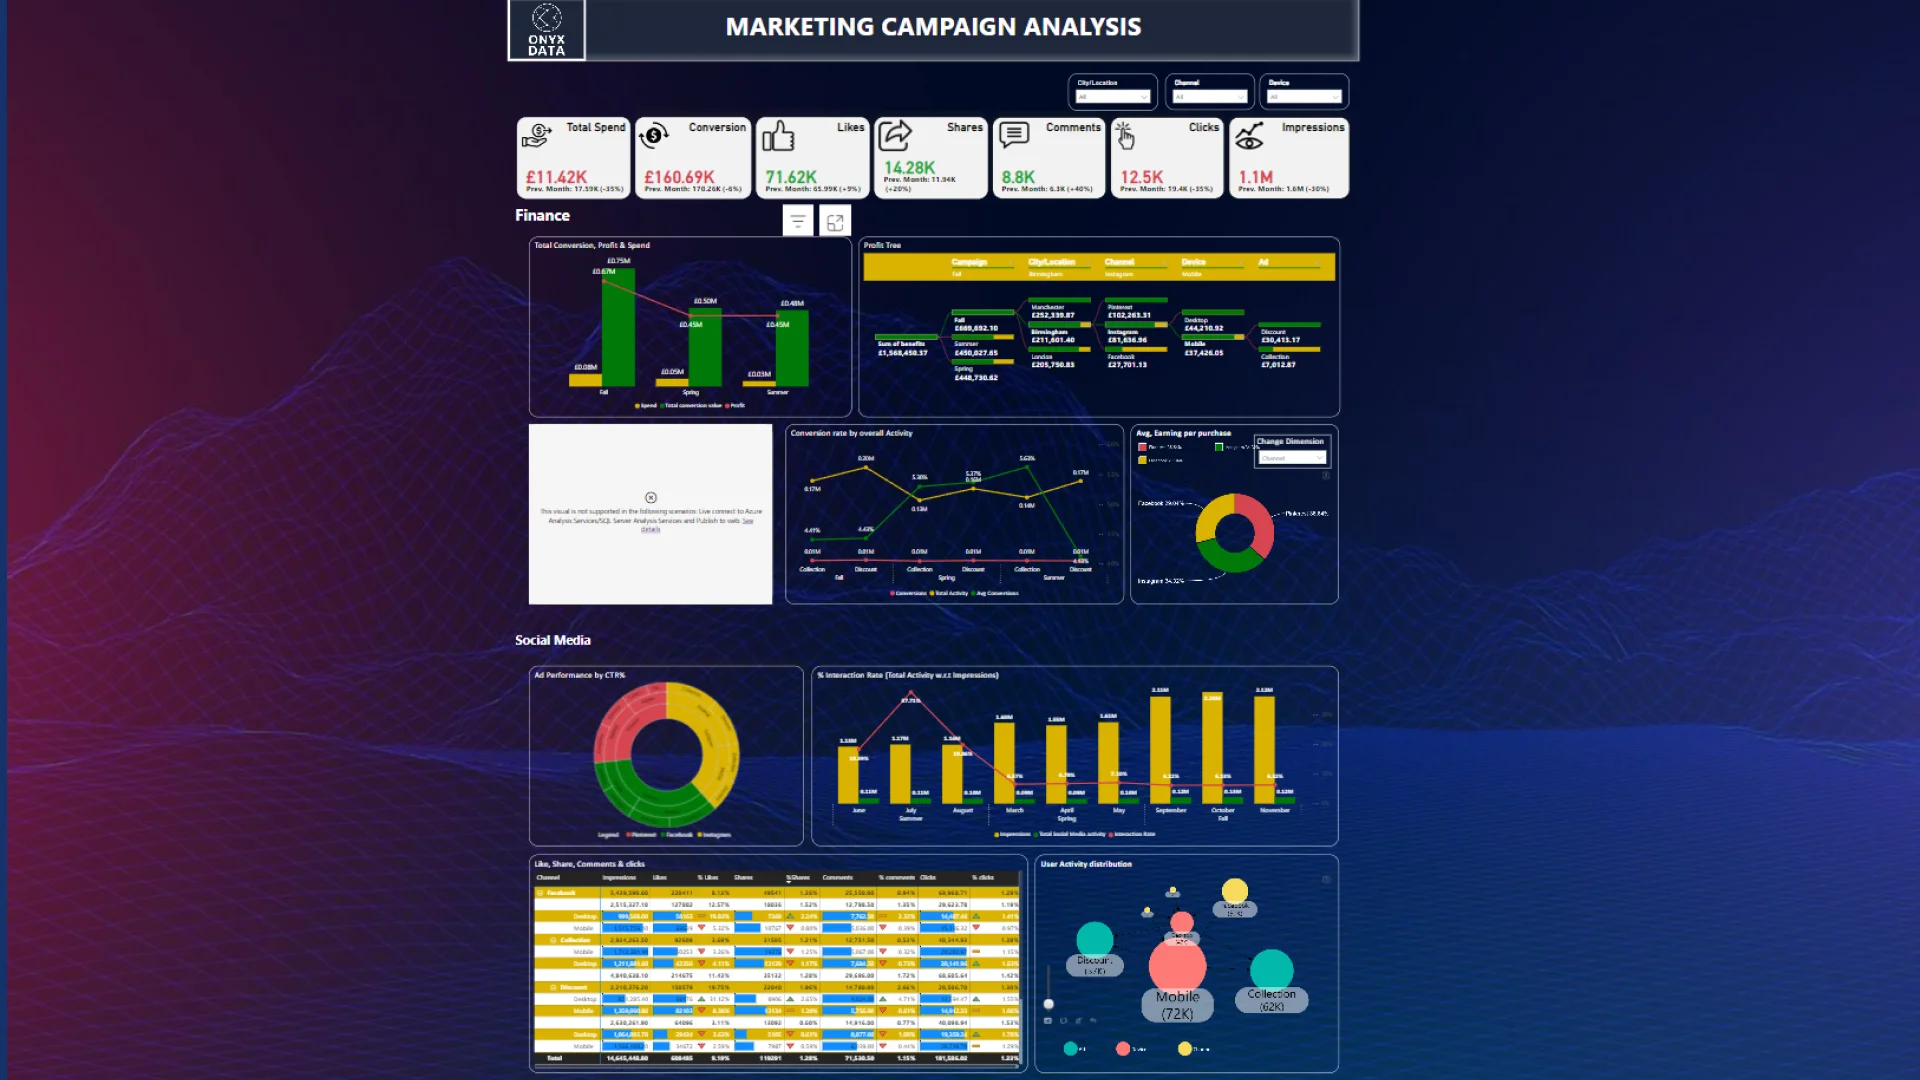
Report submitted for OnyxData #DataDNA and ZoomCharts Challenge June 2024. The report was built with the Marketing Campaing Dataset and includes ZoomCharts custom Drill Down PRO visuals for Power BI.
Author's description:
The report provides insights on financial and social media-related KPIs such as CTR%, CPC, Total Spend, earnings through conversions, and derived KPIs like Profit, average user spend per purchase, and % of conversion based on user activity. Top filters allow viewing data across different dimensions.
The KPI Card at the top displays month-over-month (MOM) changes in these KPIs, defaulting to the last month of available data compared to previous months.
Financial Insights:
- Campaign-wise financial figures including Profit based on spend and total value generated.
- Decomposition tree for Profit showcasing benefits generated across dimensions.
- Daily influencers of CPC and top segments.
- Average conversion rate based on user activity (sum of likes, clicks, comments, shares) and earnings per purchase.
Social Media Insights:
- Covers CTR%, interaction rate, and overall ads performance metrics such as likes, shares, clicks, and comments.
4U Report Challenges
Participate in data challenges, build and submit reports to get free template downloads.
Join CommunityMobile view allows you to interact with the report. To Download the template please switch to desktop view.
Was this helpful? Thank you for your feedback!
Sorry about that.
How can we improve it?