28710
Budget vs. Actual Sales Dashboard Example
Budget vs. Actual Sales Dashboard Example
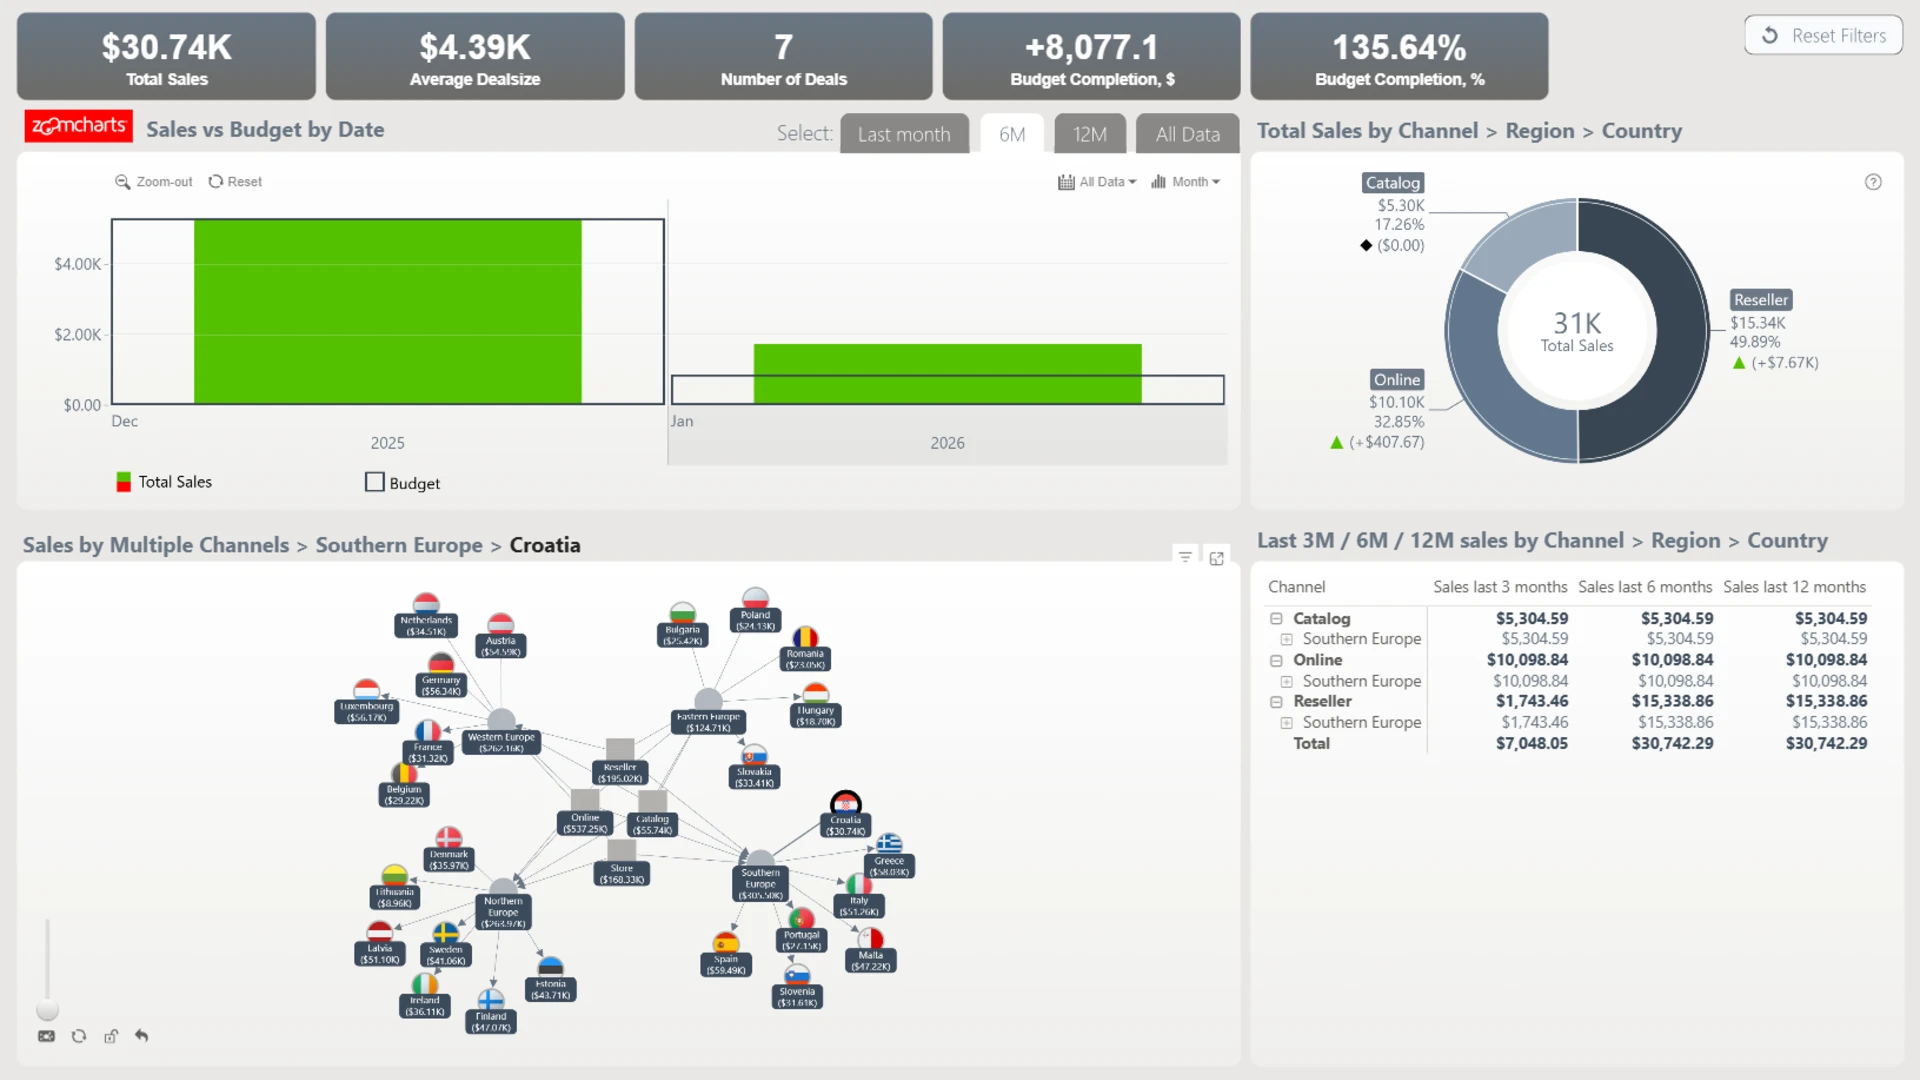
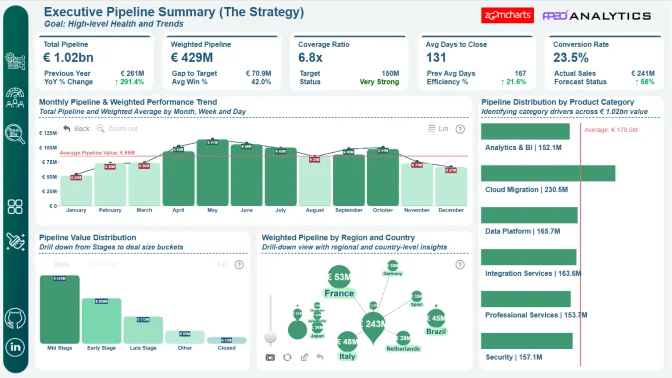
More Report pages
Report Author: ZoomCharts
28710
Share template with others
Summary
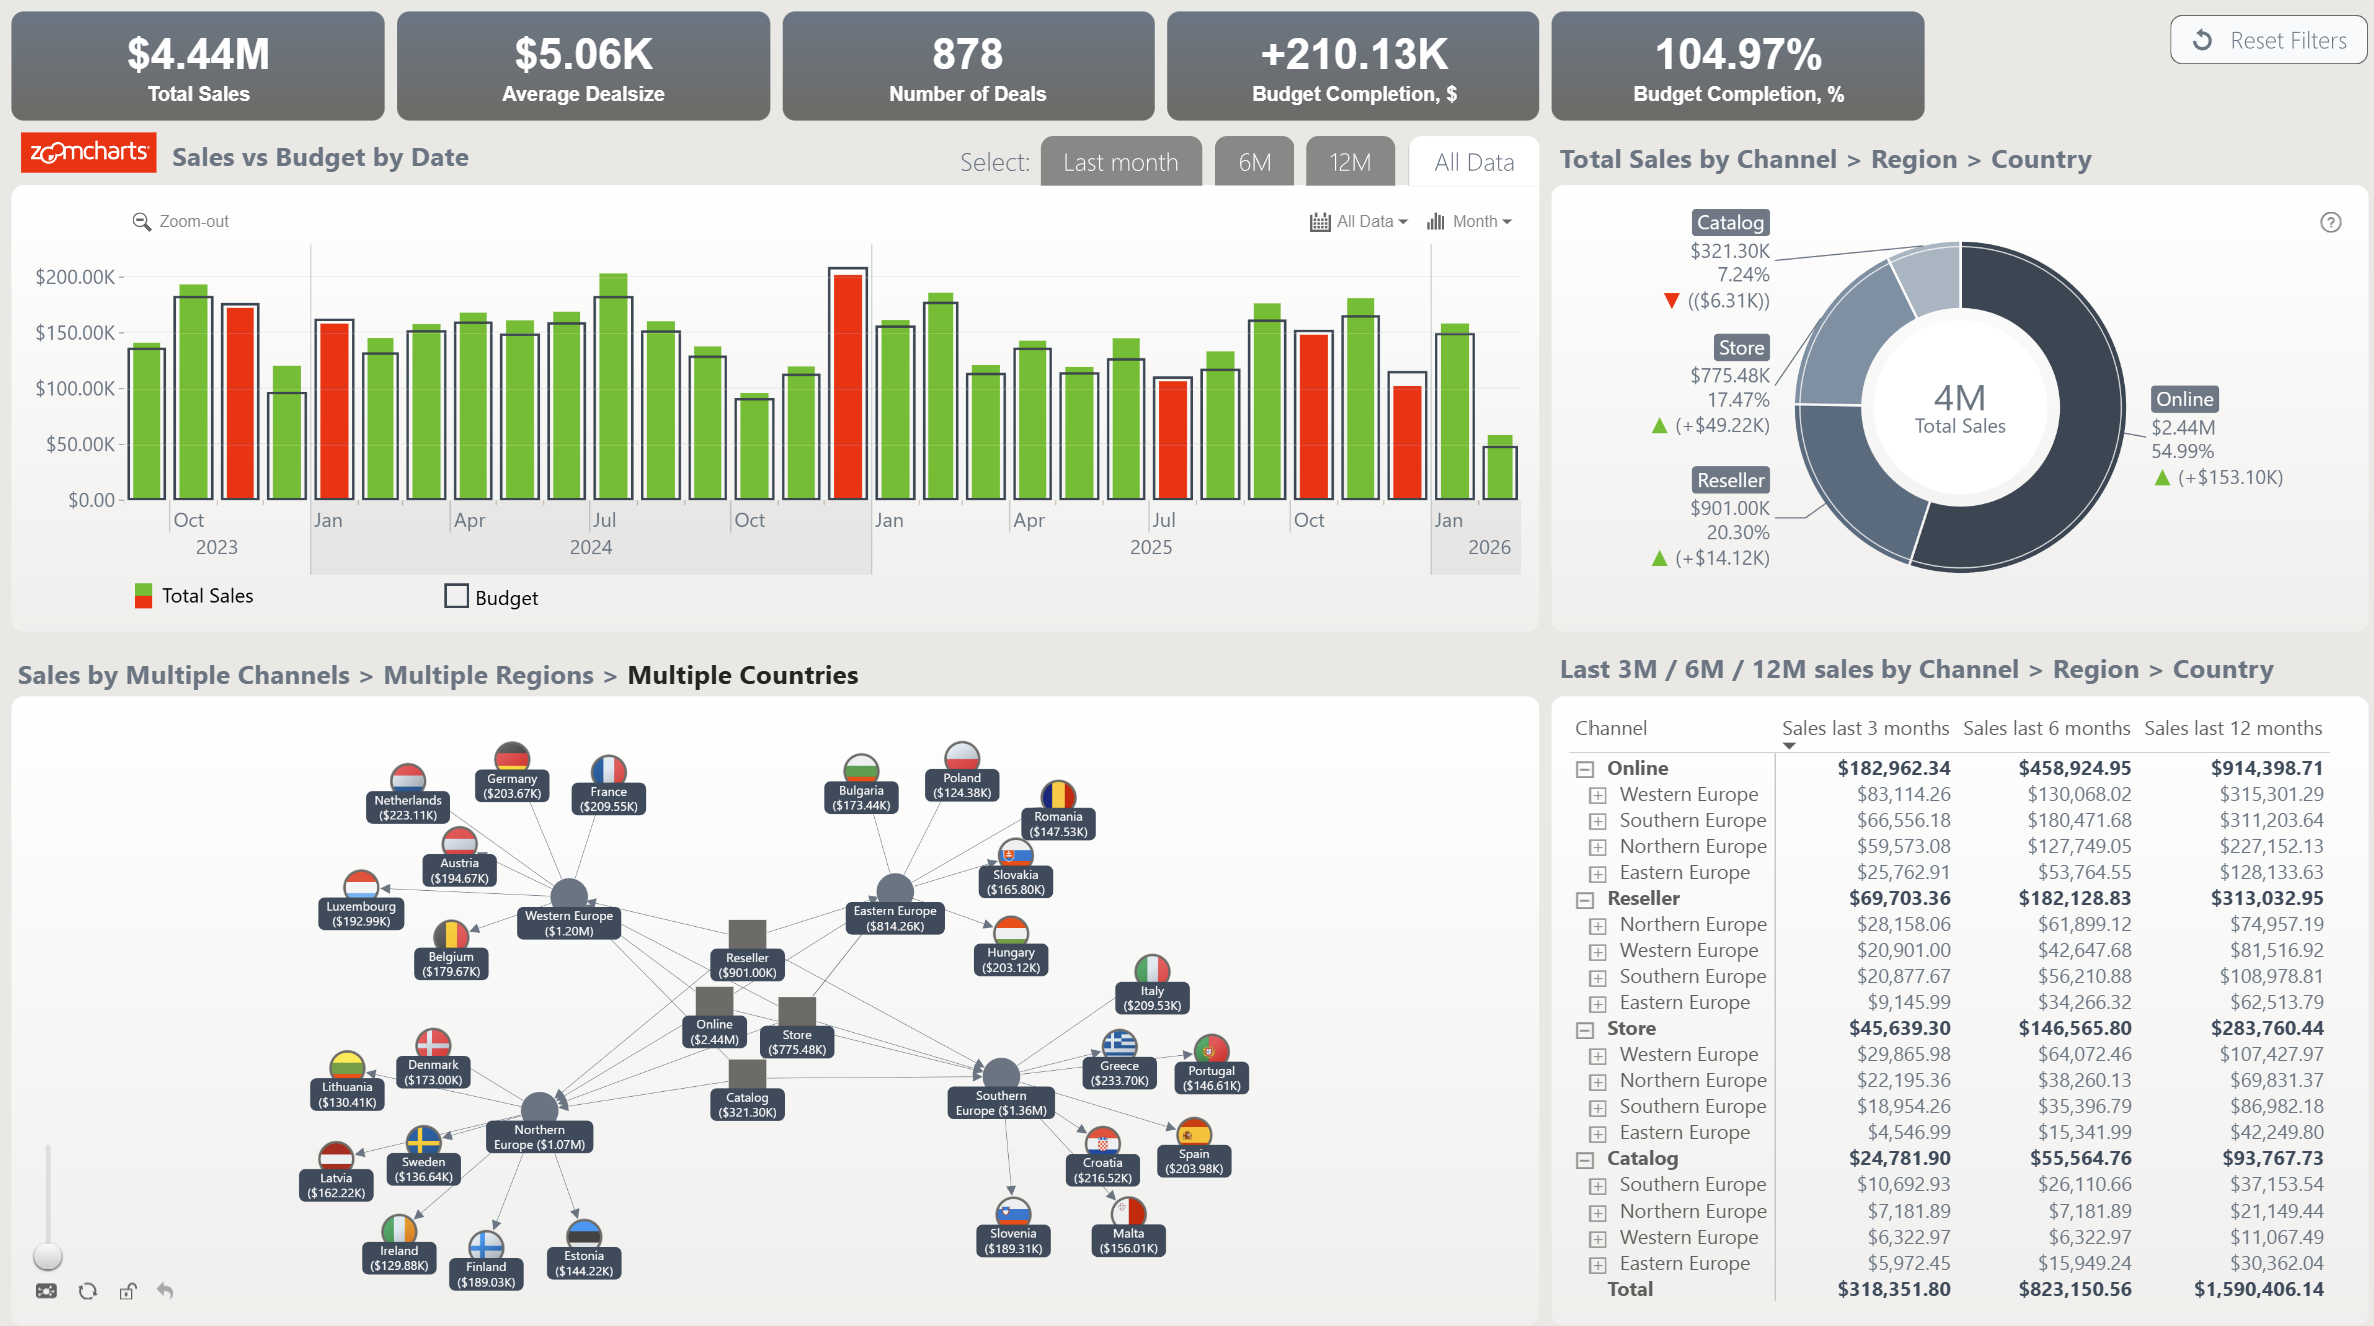
This budget vs. actual sales dashboard example shows how Power BI can compare planned sales with actual results. It helps users review sales performance, identify variances, and see where results differ from the allocated budget.
Key Insights of the Budget vs. Actual Sales Dashboard Example
The dashboard brings budget and actual sales data together for direct comparison. Its main analytical areas include:
- Budget vs. actual sales: compare planned values with achieved sales results
- Sales variance: identify positive and negative differences between budget and actual performance
- Performance breakdowns: examine results across the dimensions available in the dashboard
The Power BI dashboard format makes performance gaps easier to identify and allows users to move from a high-level overview to more detailed sales comparisons.
How to Use This Budget vs. Actual Sales Dashboard Example
Use the available filters, navigation, and active chart elements to narrow the data and investigate individual sales variances.
This dashboard example can also provide inspiration for building a sales budget analysis solution in Power BI.



4U Report Challenges
Participate in data challenges, build and submit reports to get free template downloads.
Join CommunityMobile view allows you to interact with the report. To Download the template please switch to desktop view.
How to use a PBIX template
Preview the interactive report, download the PBIX file, open it in Power BI Desktop, and replace the same data connection with your own dataset.
Preview and download
Explore the report online and download the PBIX template file.
Open in Power BI Desktop
Open the downloaded PBIX file in Power BI Desktop.
Connect your data
Replace the sample data source with your own dataset.
Refresh and adjust
Refresh the model and update fields or visual were needed.
Save and share
Save your report and publish it for your audience.


