26937
Budget vs Actual Sales
Budget vs Actual Sales
More Report pages
Report Author: ZoomCharts
26937
Share template with others
Summary
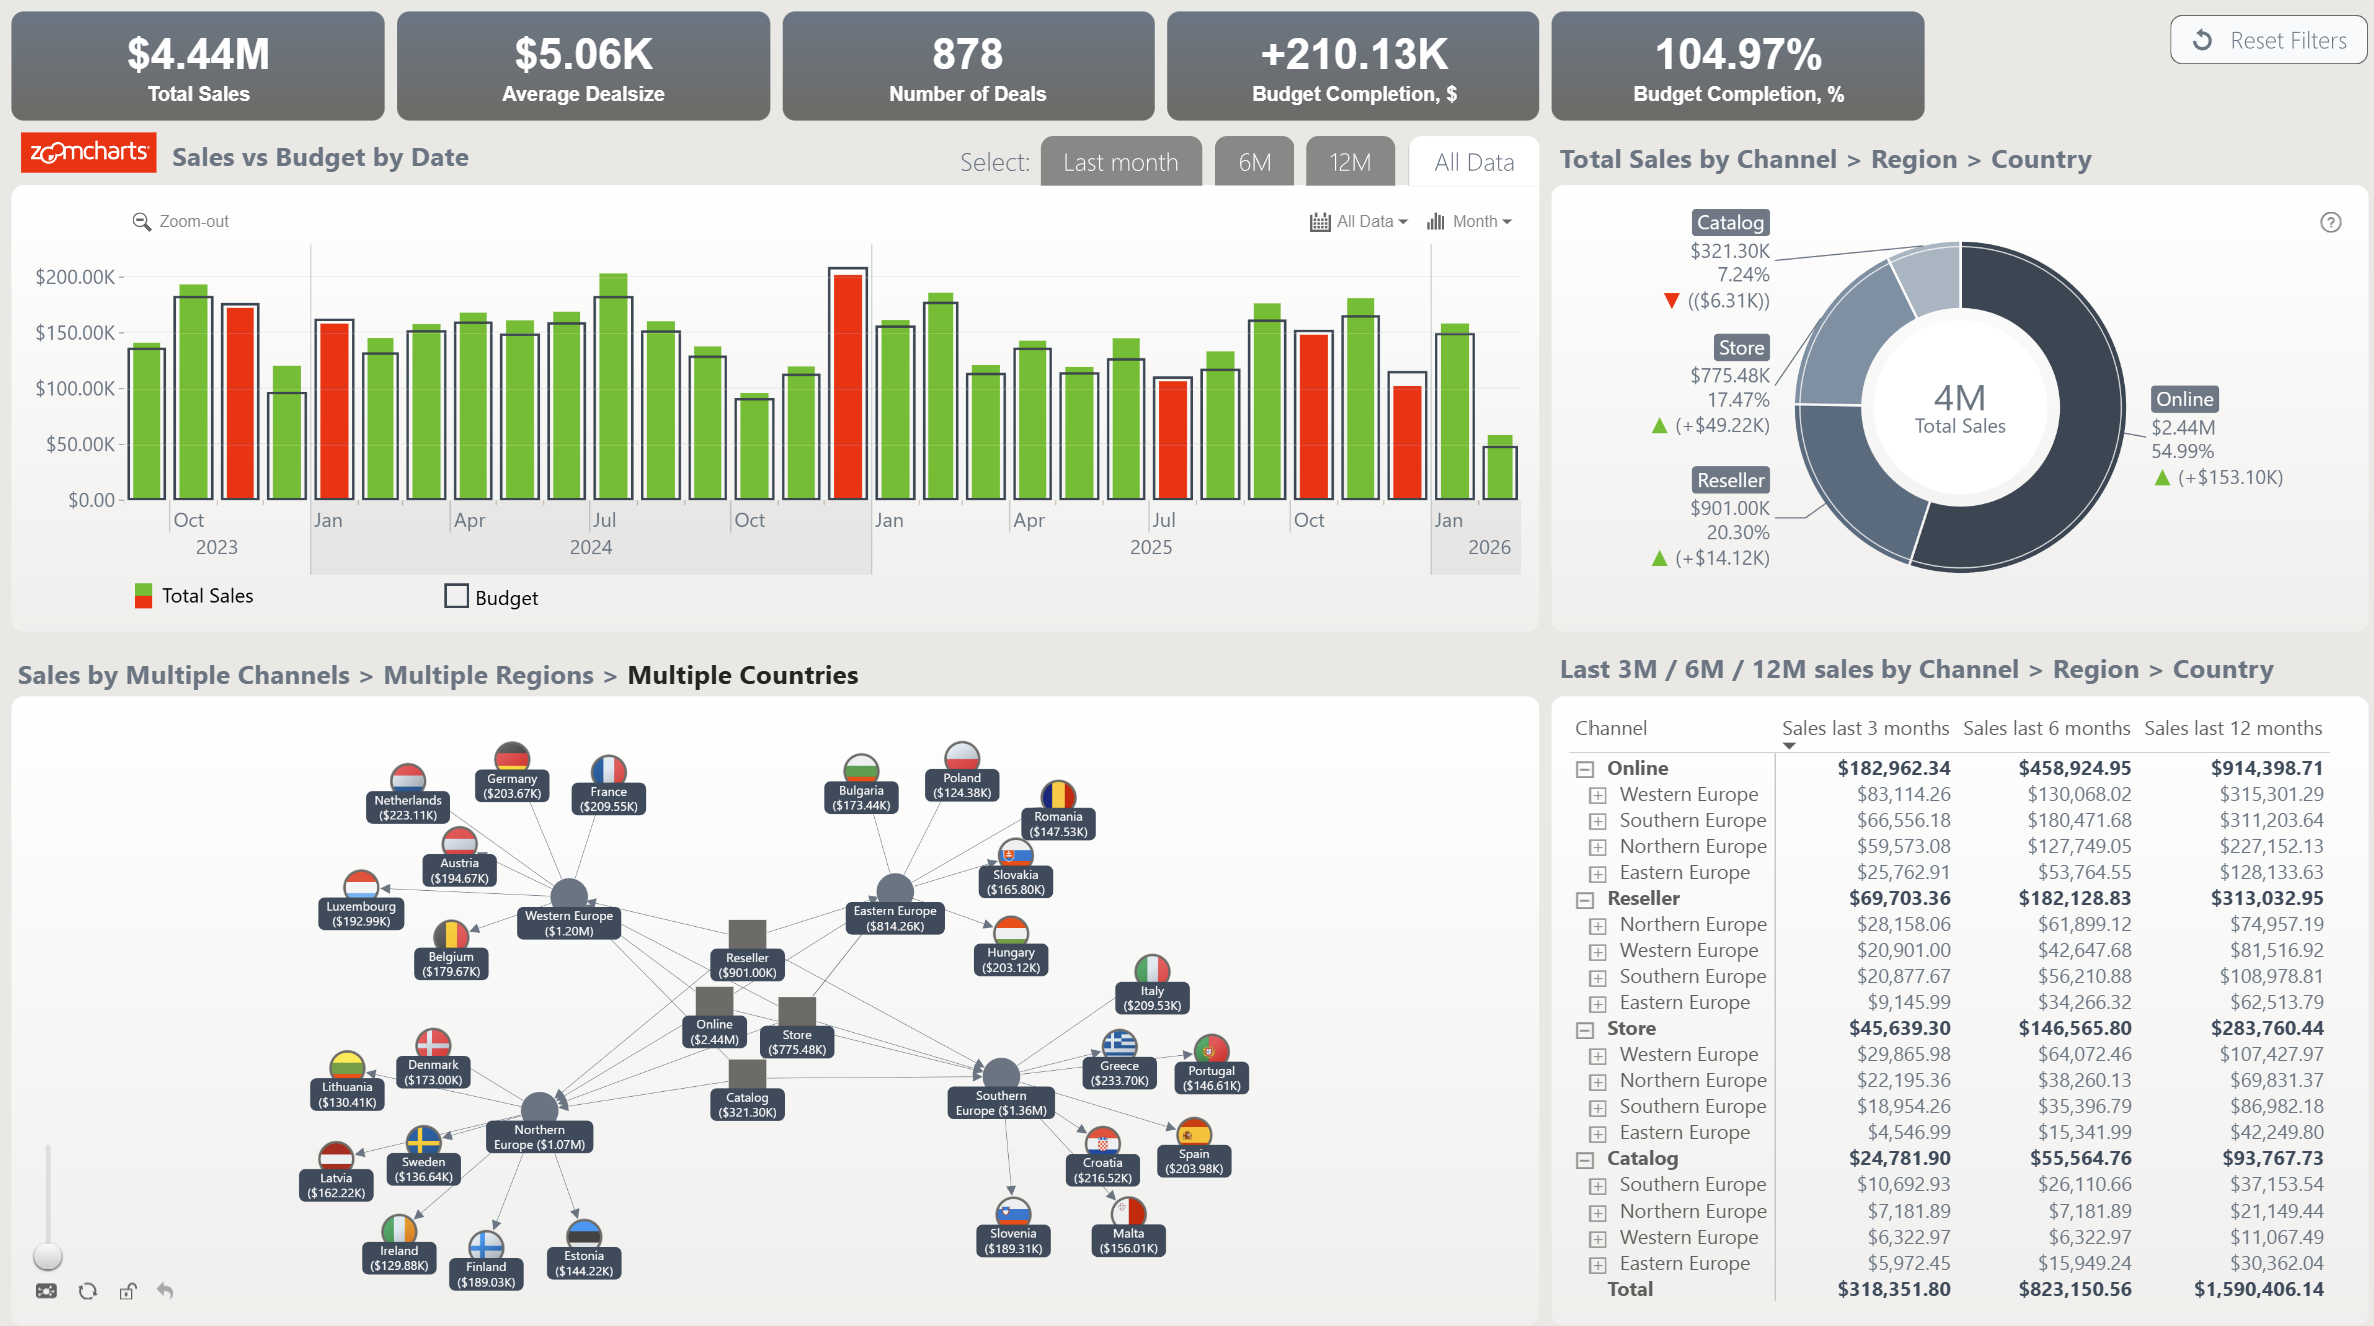
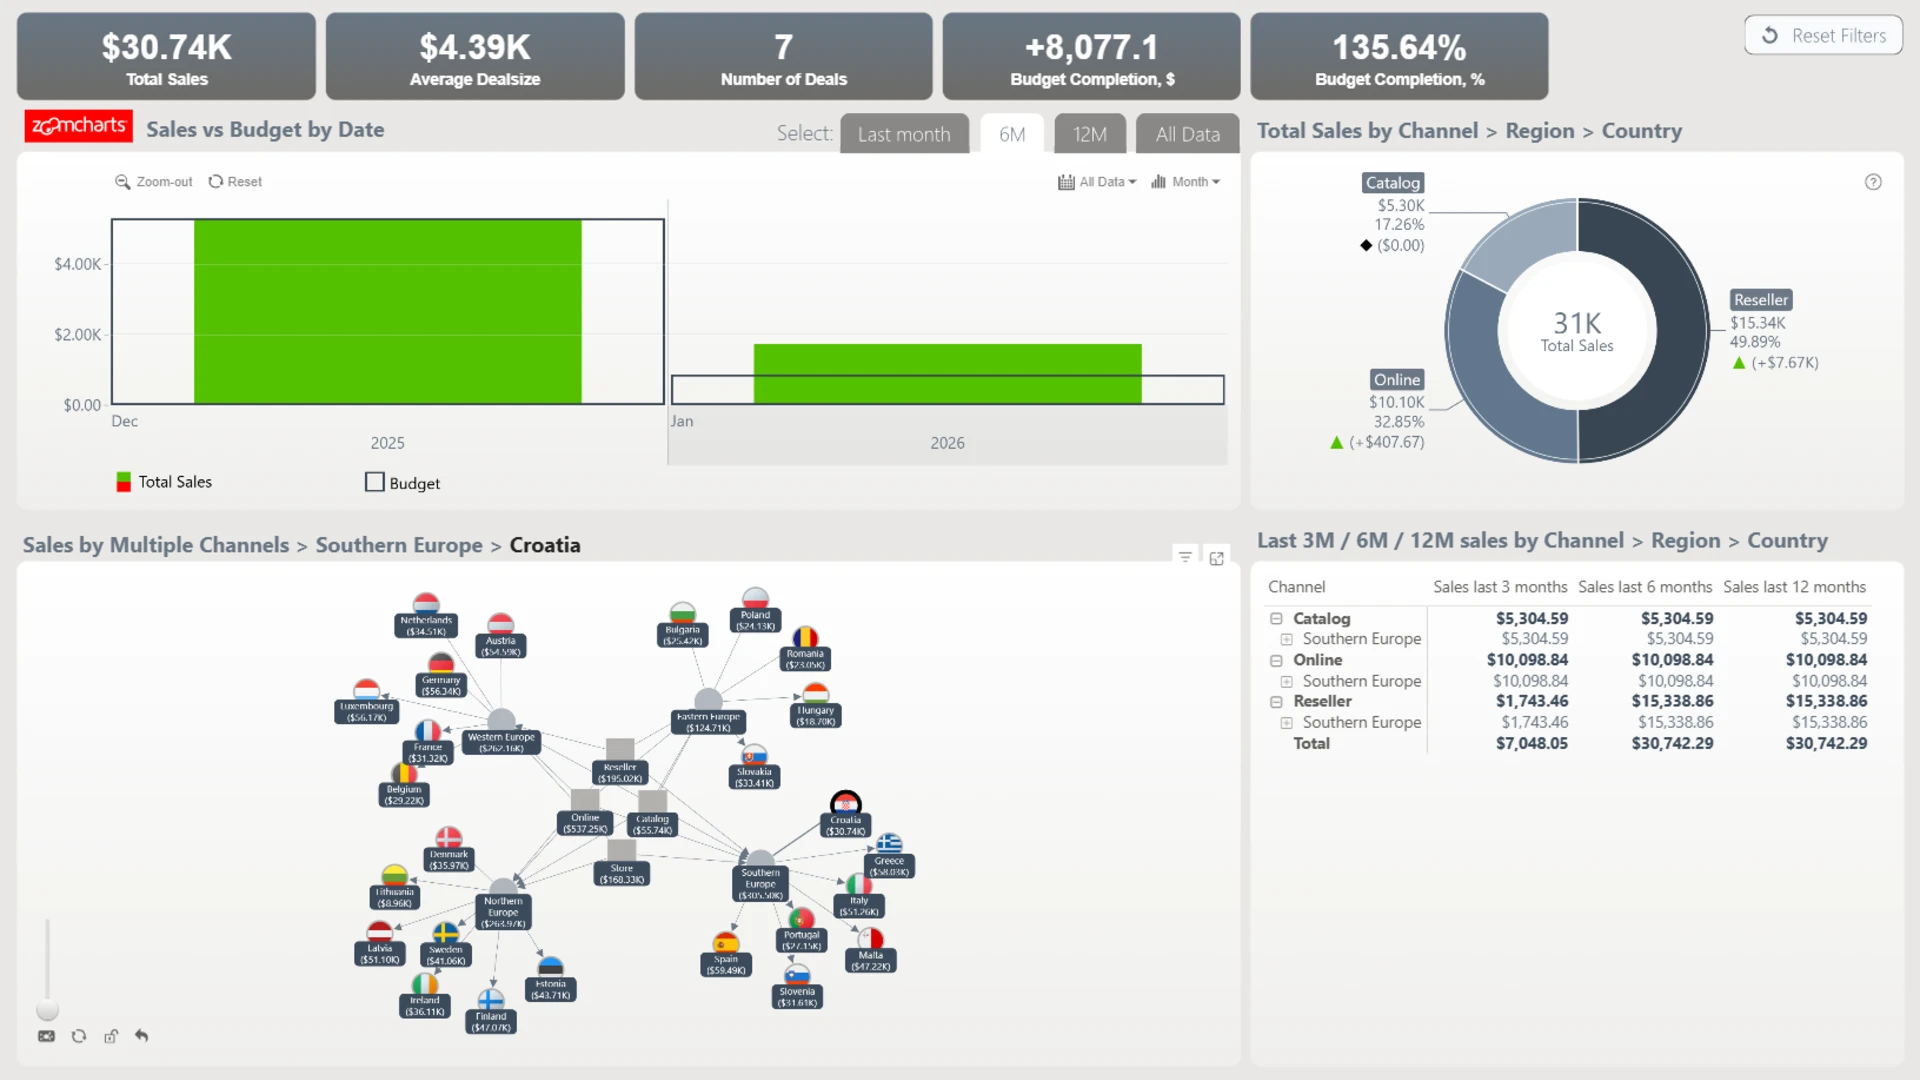
This Power BI dashboard template displays information on Budget vs Actual Sales. Built with Drill Down Visuals, this Power BI report template makes it easy to compare budgeted sales to actual sales and allows companies to evaluate their sales performance and assess the accuracy of their budgeting.
With this Power BI report template, you can compare sales and budget by date and see trends over time with the timeline visual. Using the network visual, you can also view sales by multiple channels, regions and countries. For a proportional view, the donut chart lets you see the overall makeup of different channels of total sales. For more precise information, the table and KPI cards adjust as you filter the chart and show precise numbers.
Key Features
- Drill Down Donut PRO lets you create stunning donut charts.
- Drill Down Timeline PRO lets you visualize and drill down time-based data using DAX calculated measures.
- Drill Down Network PRO lets you visualize and explore relations between categories in a simple and interactive way.
- On-chart interactions.
- Cross-chart filtering.
How To Use This Budget vs Actual Sales Report Template
To interact with this Power BI Budget vs Actual Sales Report, simply click any active elements directly on the charts.
Download this report to see all the settings, formulas, and calculations. Try it out with your own data by making a few adjustments.
Author:ZC
4U Report Challenges
Participate in data challenges, build and submit reports to get free template downloads.
Join CommunityMobile view allows you to interact with the report. To Download the template please switch to desktop view.
Was this helpful? Thank you for your feedback!
Sorry about that.
How can we improve it?