631
Power BI Sales Pipeline Dashboard Example
Power BI Sales Pipeline Dashboard Example
More Report pages
Report Author: Crystal Andrea Dsouza
631
Share template with others
Summary
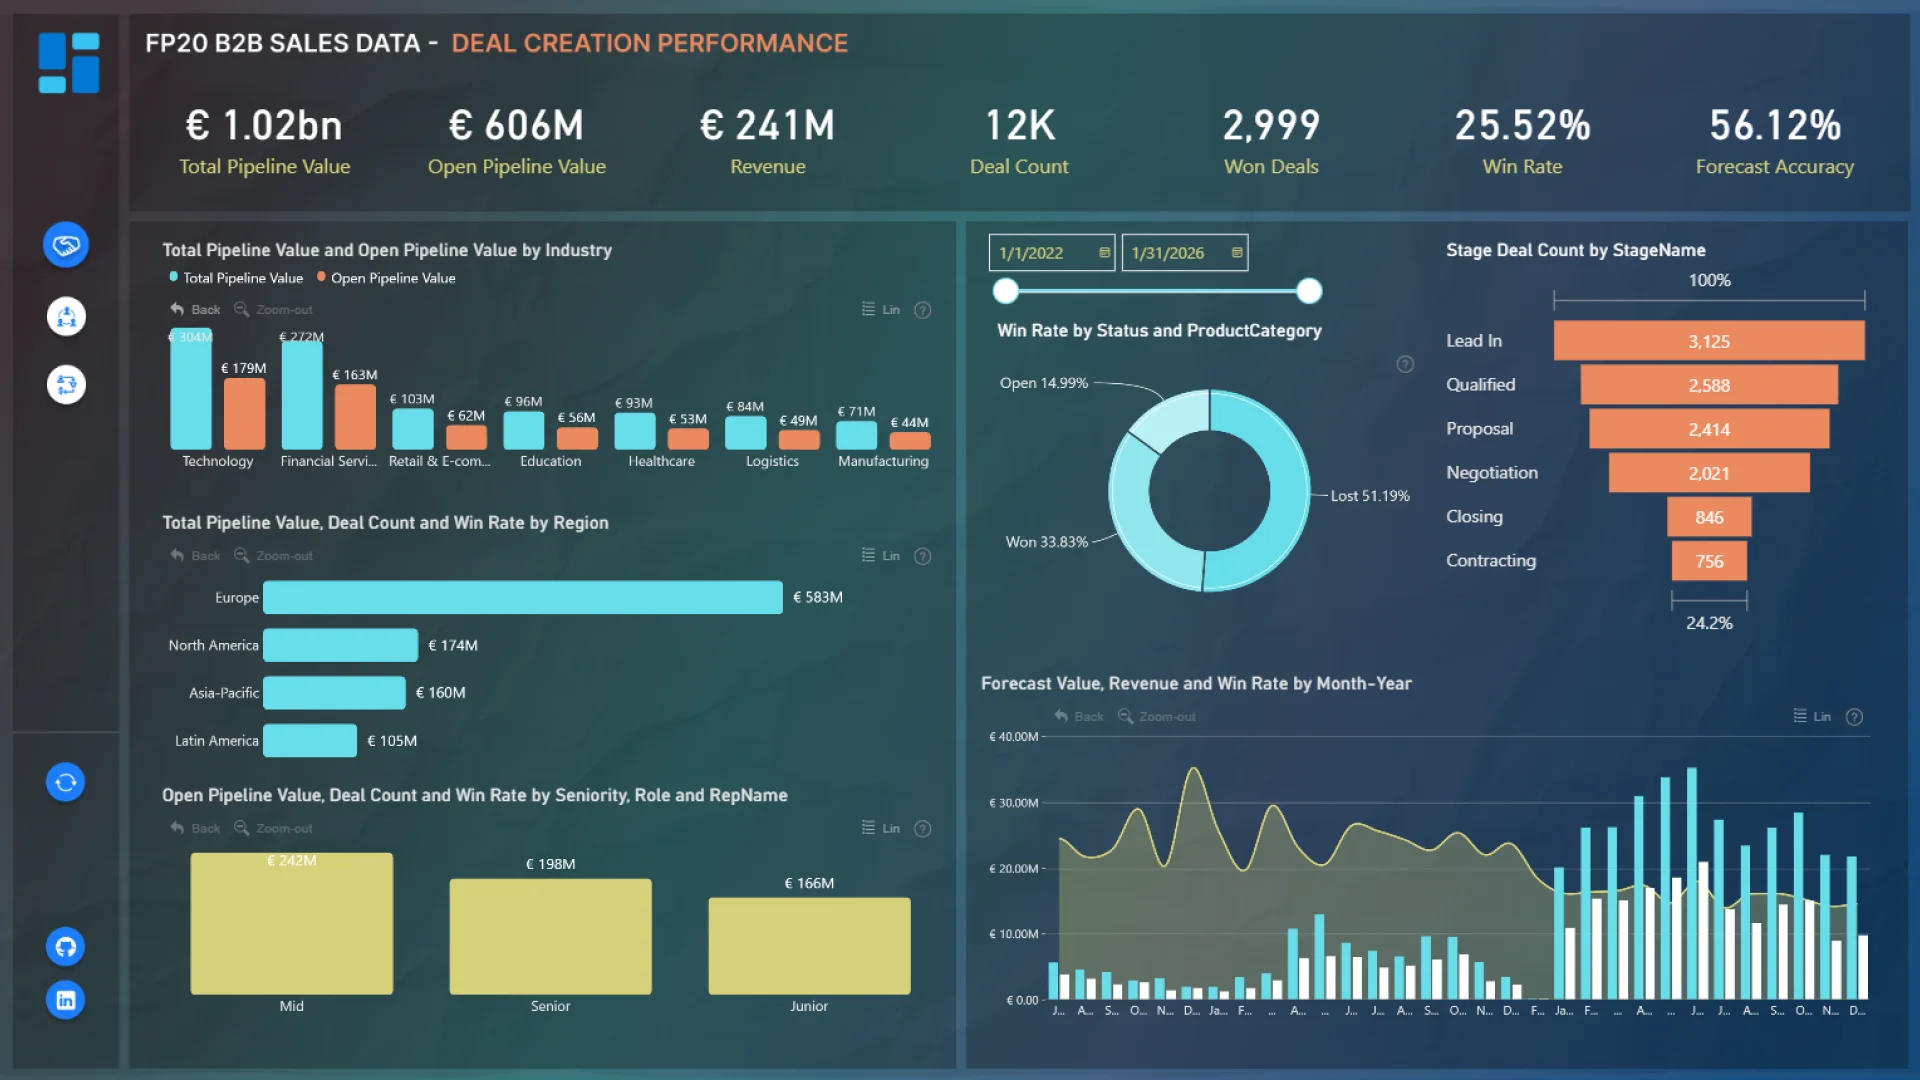
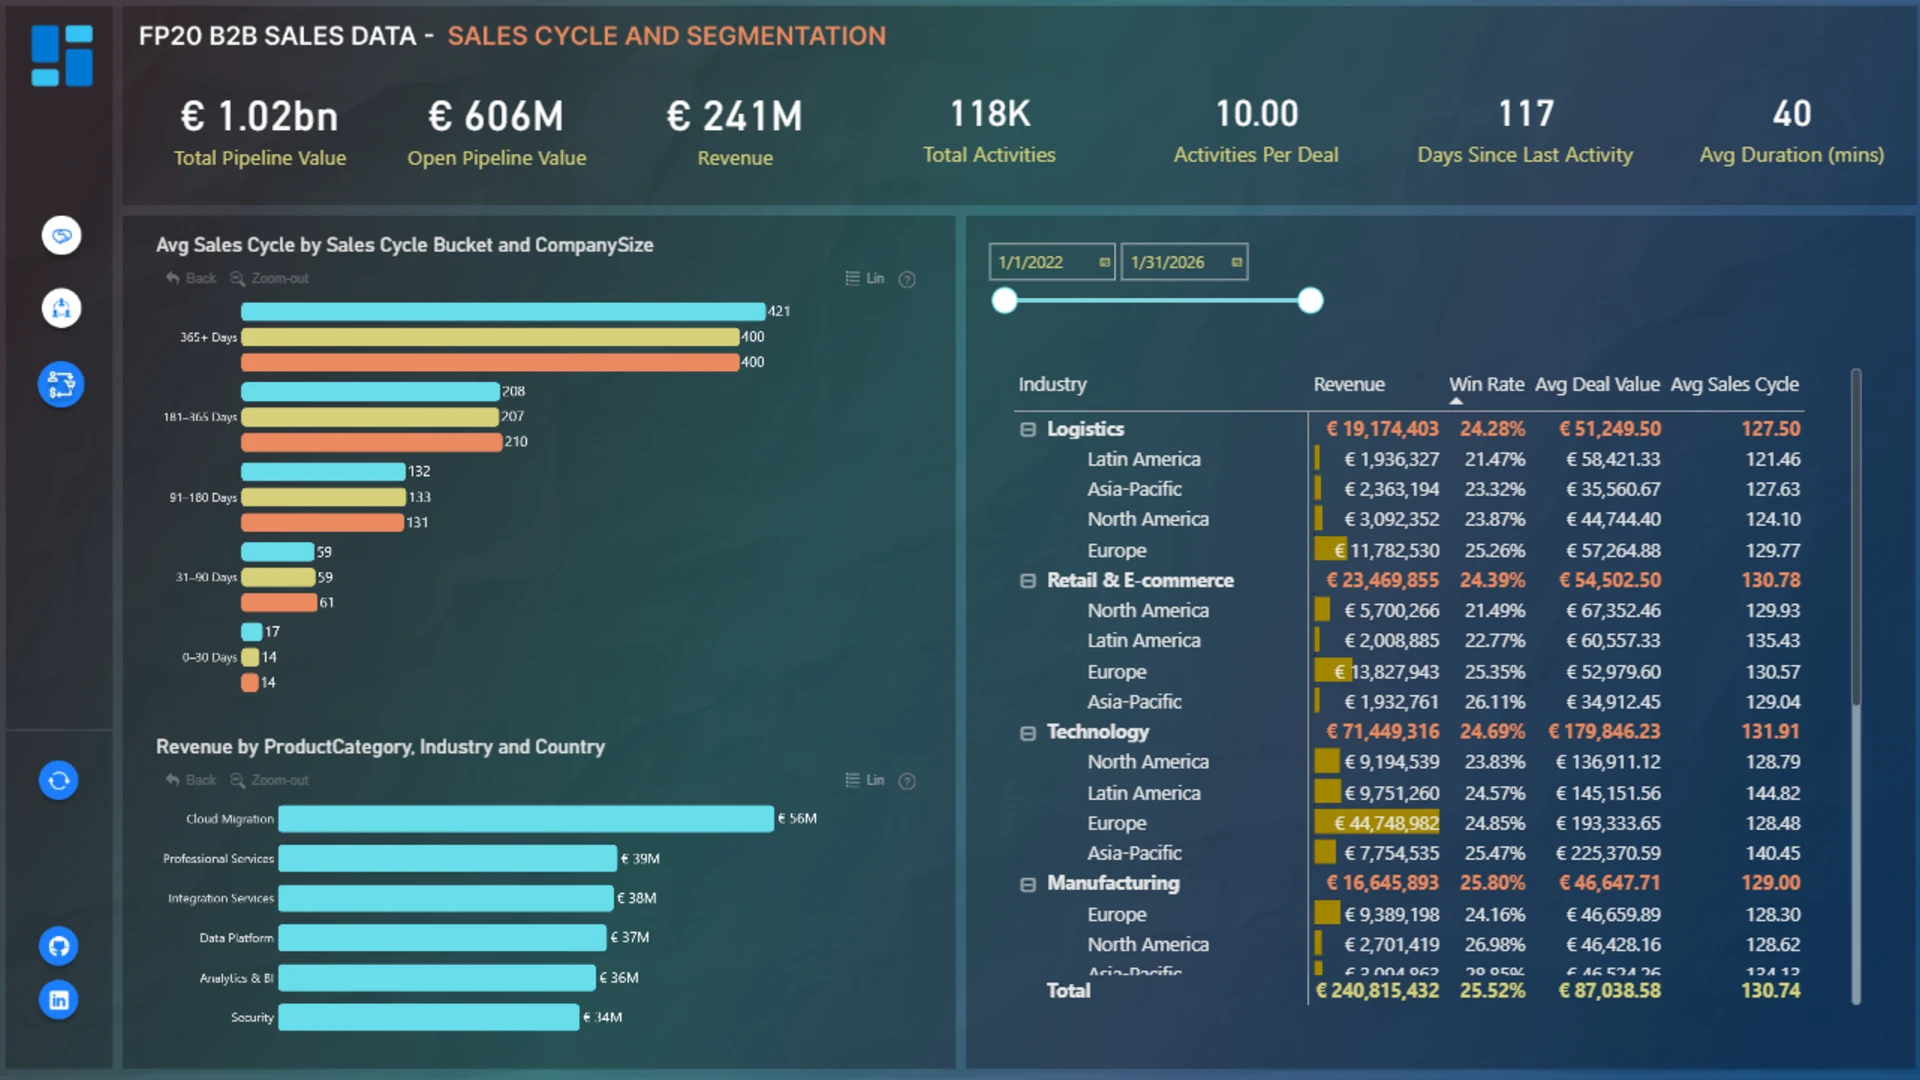
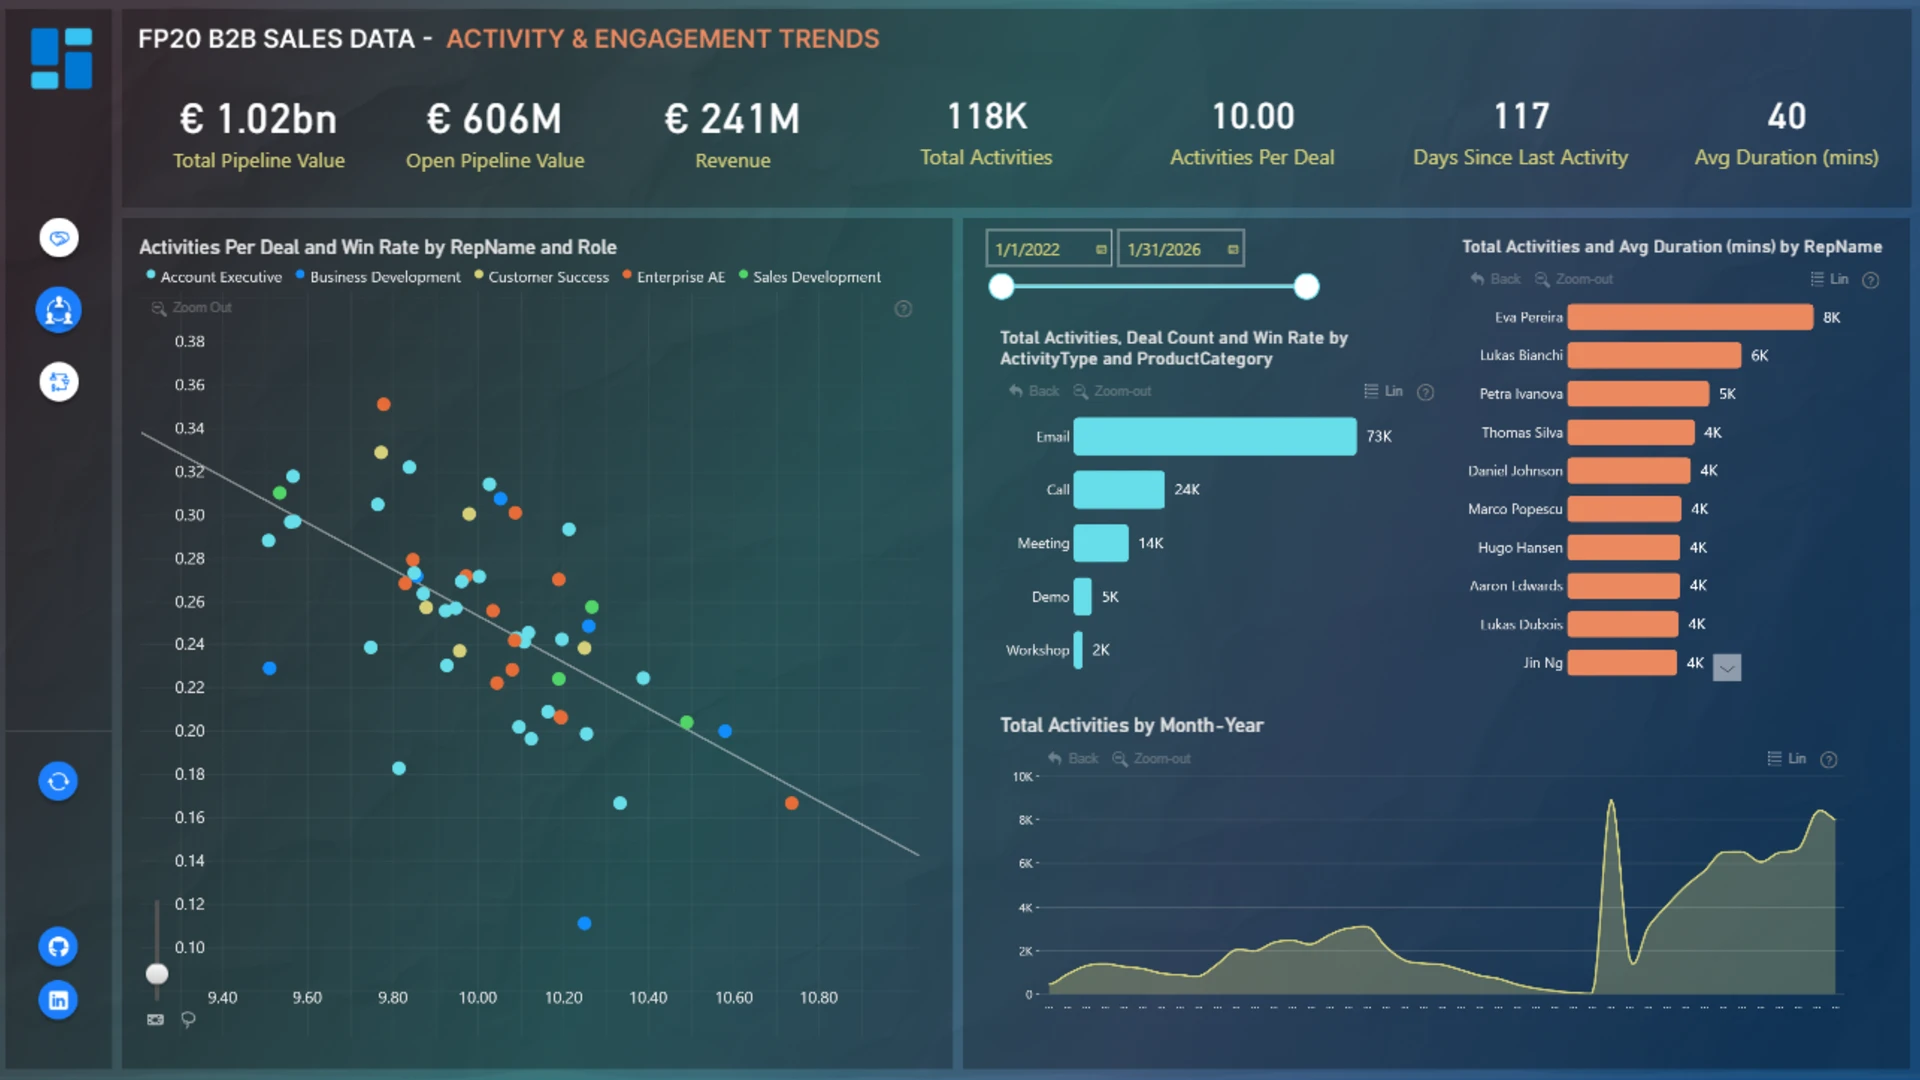
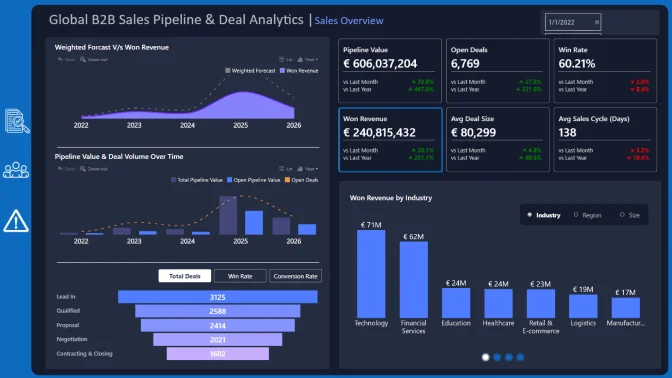
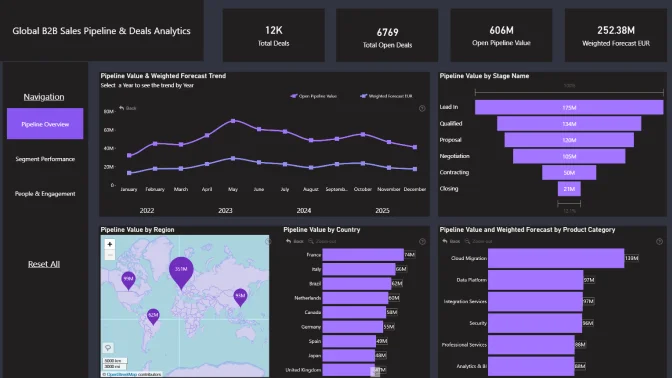
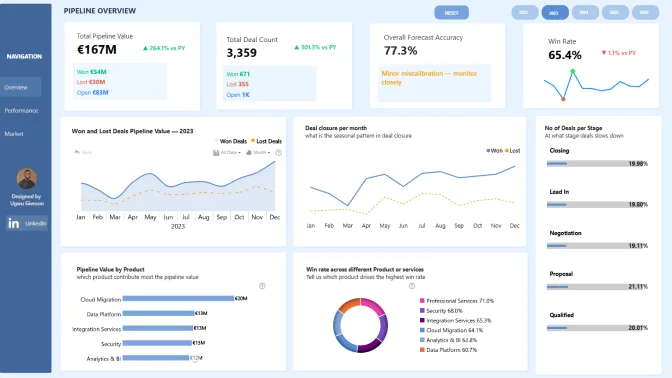
The report makes it easy to track pipeline value, open opportunities, revenue, deal activity, win rates, and forecast performance across different regions, industries, products, and sales teams. With clear visualizations and interactive filtering, users can quickly identify trends, monitor engagement, and uncover the factors driving successful conversions.
What can you do with this report?
With this Power BI sales pipeline dashboard, you can:
- Monitor total pipeline value and open opportunities
- Track revenue trends and won deals over time
- Analyze win rates and forecast accuracy
- Compare sales performance across regions and industries
- Identify high-performing products and customer segments
- Monitor sales activity and engagement trends
- Analyze sales cycle duration and pipeline stages
- Detect bottlenecks and opportunities for pipeline optimization
- Drill down into detailed sales and performance metrics
- Support data-driven sales planning and forecasting
Key insights included
This report provides a complete overview of sales pipeline health and performance, including:
- Total revenue and forecast value
- Open pipeline value and active opportunities
- Deal count and won opportunities
- Win rate and conversion performance
- Sales activity and engagement metrics
- Sales cycle segmentation and duration analysis
- Regional and industry performance comparison
- Product category contribution analysis
- Pipeline trends and growth tracking
Who is this report for?
This Power BI B2B sales pipeline report is useful for:
- Sales managers and sales directors
- Revenue operations (RevOps) teams
- Business analysts and BI teams
- Account managers and sales representatives
- Executive leadership teams
- Organizations managing complex B2B sales processes
Why use this Power BI sales pipeline dashboard?
Managing a growing sales pipeline requires visibility into every stage of the sales process. This report helps organizations centralize sales data, improve forecasting accuracy, monitor pipeline health, and make faster, more informed business decisions.
Using interactive Power BI visuals, teams can easily explore performance trends, identify areas for improvement, and optimize sales strategies based on real-time insights.
ZoomCharts visuals used
4U Report Challenges
Participate in data challenges, build and submit reports to get free template downloads.
Join CommunityMobile view allows you to interact with the report. To Download the template please switch to desktop view.
Was this helpful? Thank you for your feedback!
Sorry about that.
How can we improve it?