Welcome to the Onyx Data October 2023 Challenge!

Sep 30 - Oct 30, 2023 | EDT

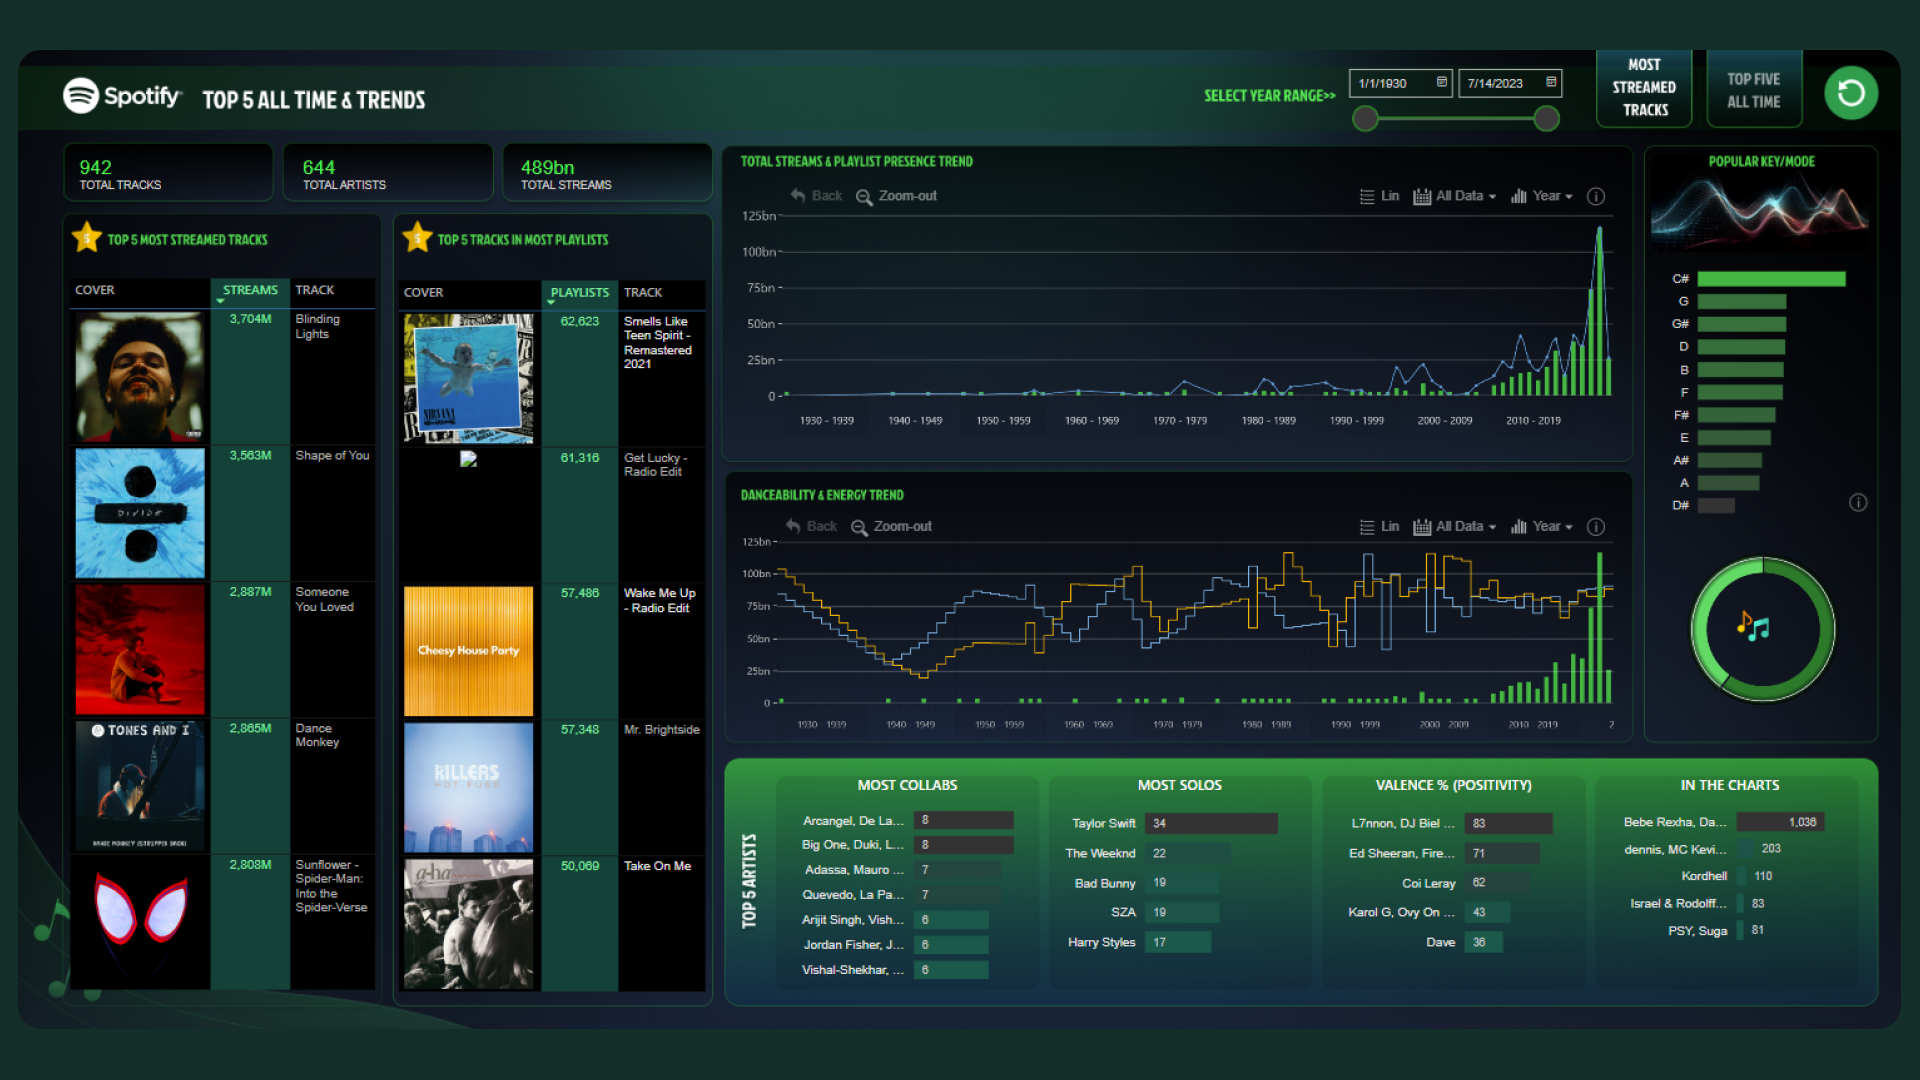
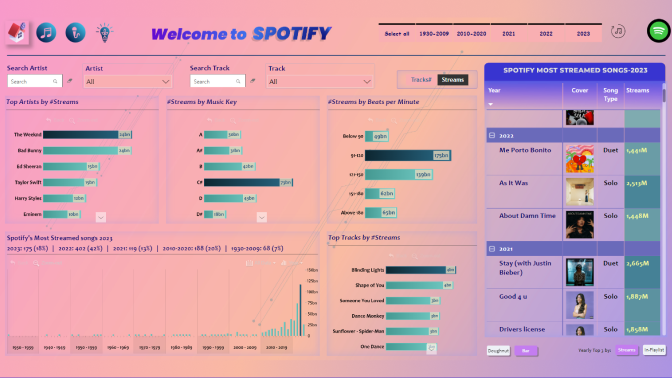
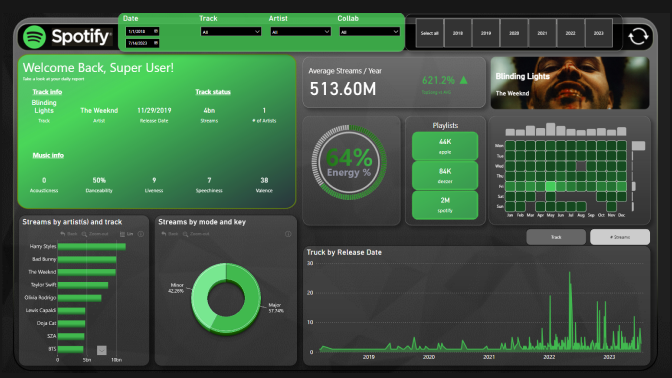
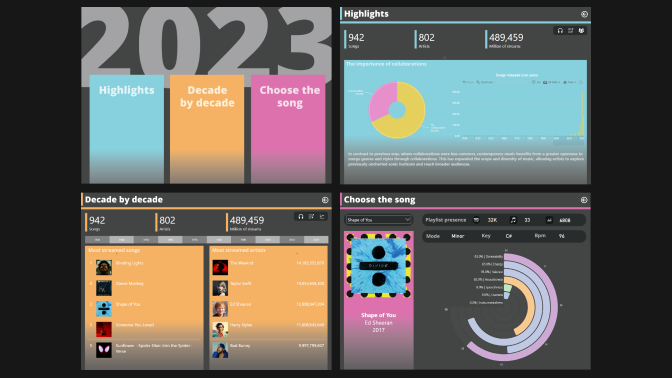
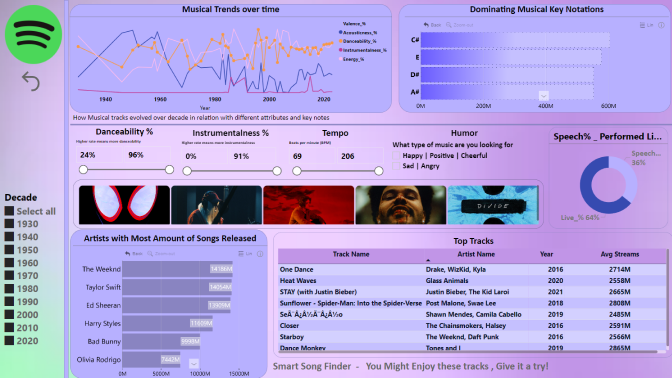
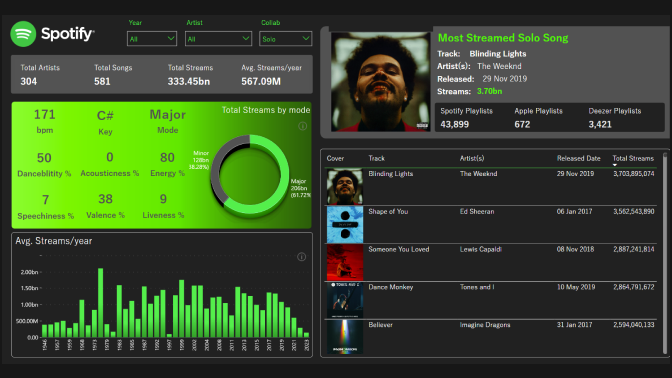
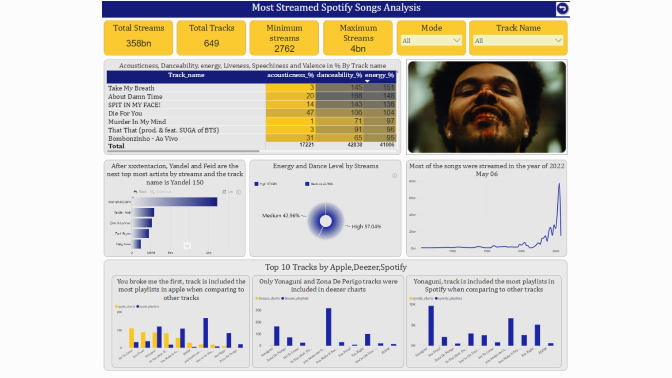
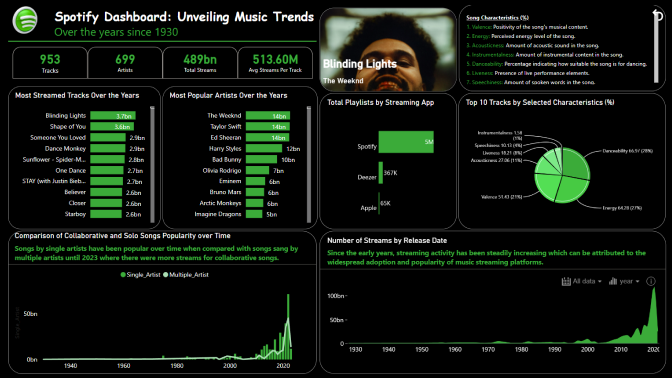
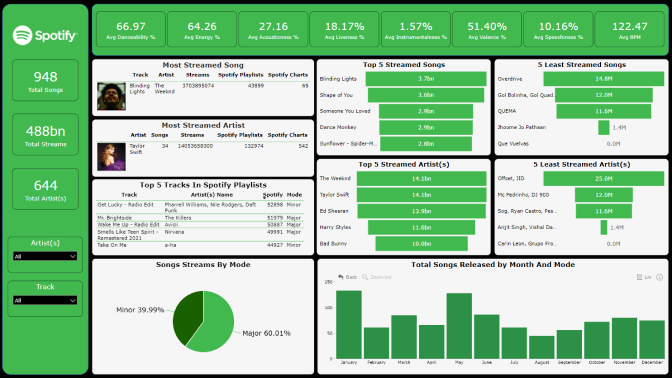
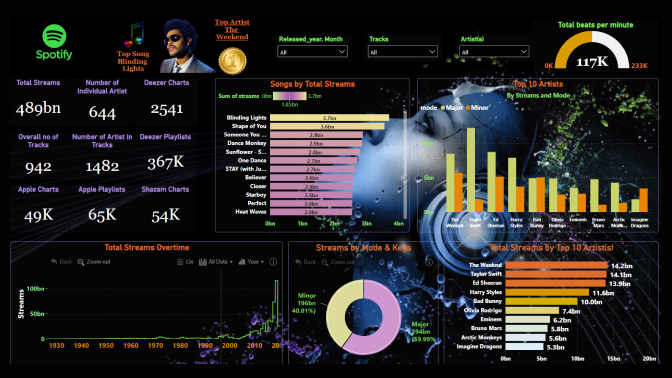
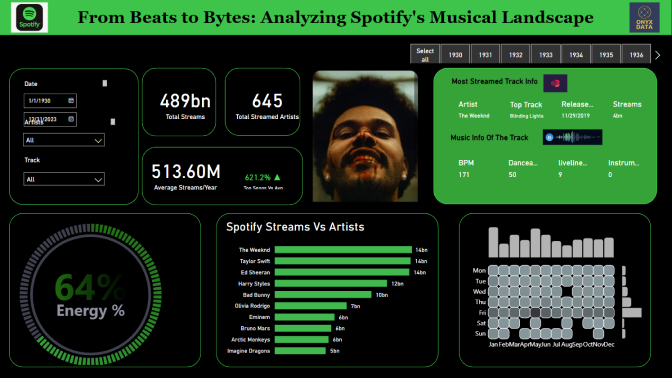
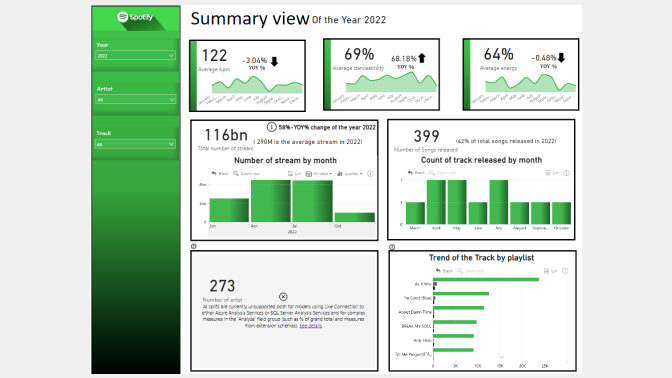
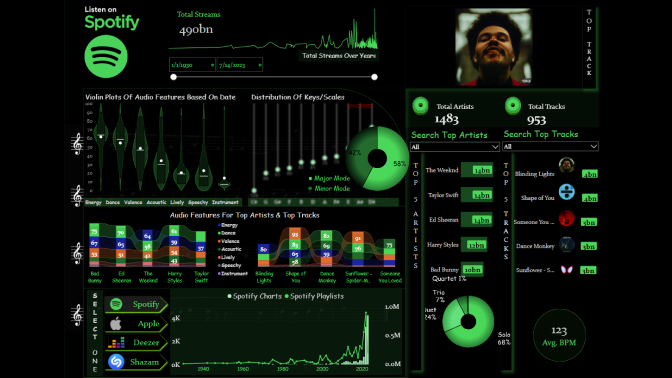
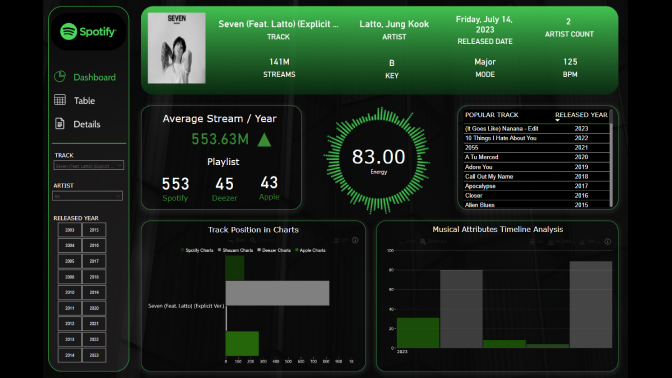
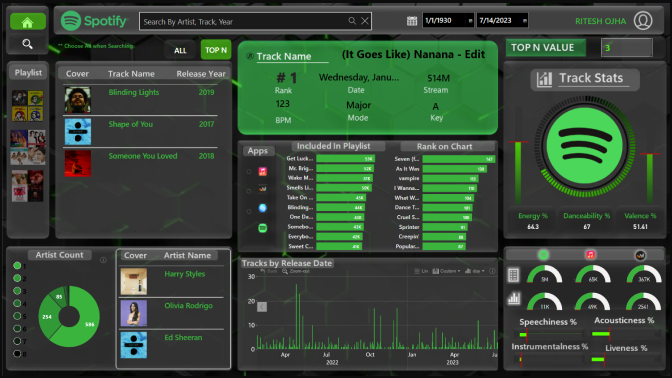
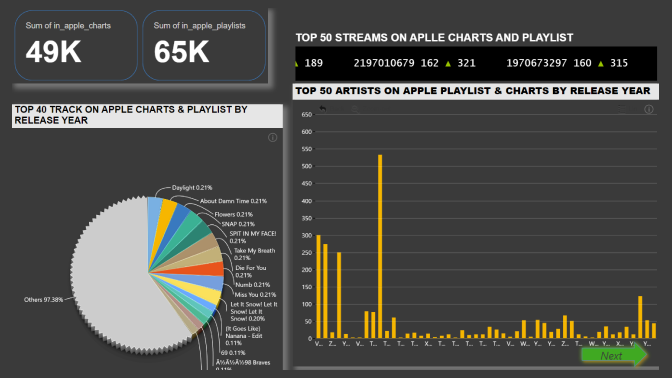
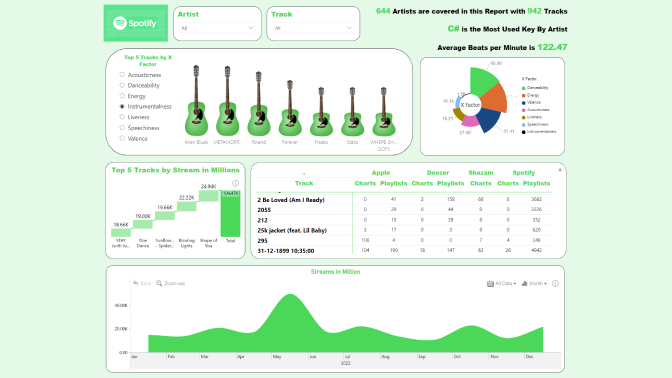
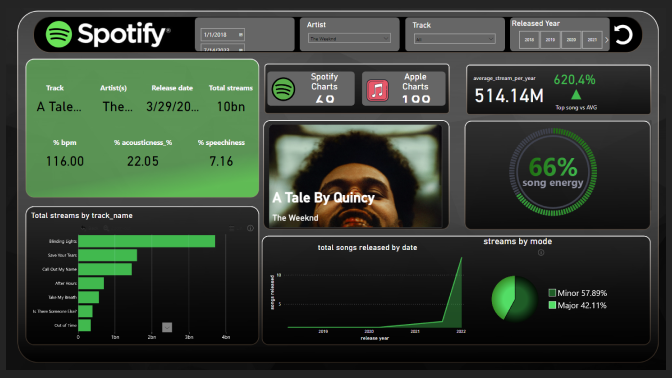
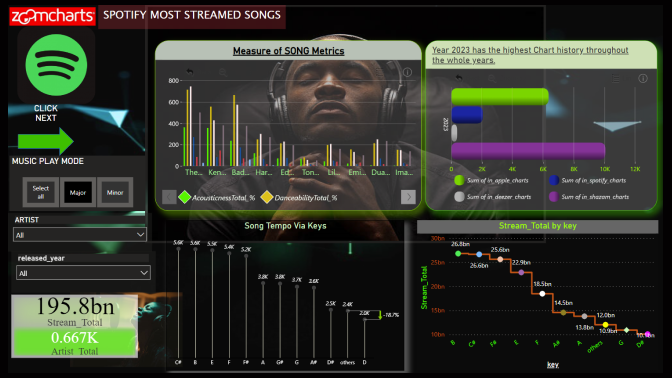
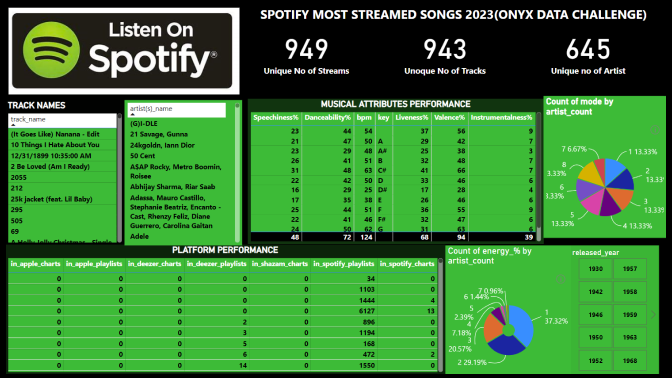
Passionate about data and music? Here's your opportunity to combine these fields. Join the challenge to dive into Spotify's 2023 dataset of top songs.

<div class="challenge-content-section"> <h2 class="h3 mb-4 pb-1">About Onyx Data DataDNA - Dataset Challenge</h2> <p>Data DNA unites over eleven thousand data enthusiasts worldwide, ranging from beginners to seasoned professionals, including Microsoft MVPs. Every month, everyone is invited to test their skills by taking part in the Dataset Challenge.</p> <p>Join the community on <a href="https://www.linkedin.com/groups/9075495/" target="_blank" rel="noopener">LinkedIn</a></p> <p>Read more about the challenges on the <a href="https://onyxdata.co.uk/data-dna-dataset-challenge/" target="_blank" rel="noopener">Onyx Data website.</a></p> </div> <div class="challenge-content-section"> <h2 class="h3 mb-4 pb-1">ZoomCharts Mini Challenge</h2> <p>Participate in ZoomCharts mini challenge to enrich your skill in creating excellent reports that help business users explore data quickly and intuitively.</p> </div> <div class="challenge-content-section"> <h2 class="h3 mb-4 pb-1">How to participate?</h2> <ol> <li>Register for ZoomCharts Mini Challenge here and receive a Drill Down Visuals Developer License for Power BI.</li> <li>Download the dataset on <a href="https://onyxdata.co.uk/data-dna-dataset-challenge/" target="_blank" rel="noopener">Onxy Data web page</a></li> <li>Create a Power BI report including at least 2 ZoomCharts Drill Down Visuals!</li> <li>Submit your entry here to be verified. <br /> <div class="note">(If your submission doesn&rsquo;t match the challenge criteria, you will be notified by email, so make sure you will have time for revision and resubmission if needed. Feel free to resubmit entry as many times as necessary before the deadline)</div> </li> <li>Follow <a href="https://www.linkedin.com/company/zoomcharts/" target="blank">ZoomCharts on LinkedIn</a></li> <li>Share the final version of your submission as a LinkedIn post on your profile, including the tags @ZoomCharts and @OnyxData, as well as the hashtags #dataDNA and #builtwithzoomcharts.</li> </ol> </div> <div class="challenge-content-section"> <h2 class="h3 mb-4 pb-1">Judging criteria</h2> <p>Business users use reports to make data-driven decisions. That&rsquo;s why reports are called effective if they enable users to drill down and filter data quickly and intuitively to find answers to any question they might have and analyse data in all possible directions and dimensions. We will evaluate:</p> <ol> <li>How easy is it to understand the data? (max 10 points) <ul> <li>Is too much text used for explanation?</li> <li>Are the indicative colors in charts instinctually understandable?</li> <li>Does it tell a story?</li> </ul> </li> <li>How easy-to-use is the report? (max 14 points) <ul> <li>Cross-chart filtering implementation across the report. Can other visuals provide relevant data as the user explores the report?</li> <li>Response time</li> <li>Drill Down: multi-layer data exploration. Can the user drill down and gain additional insights within the report?</li> <li>Use of tutorial overlays and other elements to assist new users. Can a new user start using this report straight away with just the guidance provided within the report itself?</li> </ul> </li> <li>How good is the report design and is it suitable for its purpose? (max 10 points) <ul> <li>Visual design: is the overall look consistent, no empty spaces, no overcrowding?</li> <li>Interface design: are there unnecessary visualisations/buttons/complexity in use?</li> <li>UX design: is the produced report usable?</li> <li>Report design: is the main challenge answered?</li> <li>Technical: are all the fonts used the same, are the sizes readable?</li> </ul> </li> </ol> <p>You are encouraged to use various techniques at your disposal, such as tooltips, drill-throughs, drill-downs, cross-chart filtering and page navigation features, to enhance your analysis.</p> </div> <div class="challenge-content-section"> <h2 class="h3 mb-4 pb-1">Prizes</h2> <p>The best report&rsquo;s creator will receive a $300 Amazon Voucher from ZoomCharts.</p> <p>&nbsp;</p> <h3>Get Inspired!</h3> <p>To offer valuable support to our challengers, we invite you to participate in the following events:</p> <ul> <li><a href="https://zoomcharts.com/en/microsoft-power-bi-custom-visuals/webinars/mastering-power-bi-market-demands-and-insights" target="_blank" rel="noopener">Webinar: Mastering Power BI - Market Demands and Insights</a>: Join industry experts in an insightful webinar where they will explore the realm of Power BI reporting from various angles. Discover what makes a Power BI report truly effective, what organizations are seeking, and the strategies to elevate your Power BI skills</li> <li><a href="https://zoomcharts.com/en/microsoft-power-bi-custom-visuals/webinars/visualizing-onyx-data-spotify-dataset-with-zoomcharts" target="_blank" rel="noopener">Workshop: Visualizing Onyx Data Spotify Dataset with ZoomCharts</a></li> </ul> </div>

Timeline

Registration Open

Registration Open

30 September | 21:00

-

Submissions Open

Submissions Open

30 September | 21:00

-

1:1 Mentoring Sessions

1:1 Mentoring Sessions

30 September | 21:00

30 September - 22 October

Entry Submission Deadline

Entry Submission Deadline

22 October | 21:00

30 September - 22 October

Winner Announced

Winner Announced

31 October | 12:00

30 September - 22 October

Dataset

Get the dataset

See past Onyxdata challenges

See past challenges
Submitted Reports
About challenge
Timeline
Dataset
Past challenges

About ZoomCharts Mini Challenge

ZoomCharts Mini Challenge is part of the global DataDNA – Dataset Challenge by Onyx Data, which unites 11K+ data enthusiasts worldwide, ranging from beginners to seasoned professionals, including Microsoft MVPs. Read more about the DataDNA challenge on the Onyx Data website. Join the community on LinkedIn

Participate in ZoomCharts Mini Challenge to enrich your skill in creating excellent reports that help business users explore data quickly and intuitively.

  1. Free License: All participants receive a free ZoomCharts Developer License that gives access to the full Drill Down PRO visuals library. License will remain active for 1 year after the challenge.
  2. Learn from Experienced Professionals: As part of the challenge, we host live workshops on report building and visualizing the challenge’s dataset in Power BI. Challenge participants can also book an individual consultation with an experienced Power BI mentor to ask questions and get personalized tips.
  3. Tailored Feedback: Every challenge submission will receive personalized feedback, giving participants the chance to hone their skills and improve their reports.

Prizes

The best report’s creator will receive a $300 Amazon gift card from ZoomCharts.

Timeline

Registration Open

Registration Open

30 September | 21:00

-

Submissions Open

Submissions Open

30 September | 21:00

-

1:1 Mentoring Sessions

1:1 Mentoring Sessions

30 September | 21:00

30 September - 22 October

Entry Submission Deadline

Entry Submission Deadline

22 October | 21:00

30 September - 22 October

Winner Announced

Winner Announced

31 October | 12:00

30 September - 22 October

Dataset

Get the dataset

See past Onyx Data October 2023 challenges

See past challenges