Jun 03, 2025
Power BI Stacked Column Charts: A Full Guide
This guide shows how to create stacked column / bar charts in Power BI and explores various ZoomCharts features for even more advanced data visualizations.
This guide shows how to create stacked column / bar charts in Power BI and explores various ZoomCharts features for even more advanced data visualizations.
Stacked column or bar charts are one of the most popular visualization types for Power BI, because they can show multiple values as a single column in an intuitive way. It’s useful in cases where you need to show the category totals, while at the same time visualizing how much each series contributed to that total.
How To Create Stacked Column / Bar Chart in Power BI
You can create a simple stacked column chart with the built-in Power BI ‘Stacked Column Chart’ visual – simply populate the X-Axis field with the categories or time units, Y-Axis with the values, and split the columns into segments using the Legend field. If you want to do the same thing, but horizontally, use ‘Stacked Bar Chart’ instead. Easy!

You can then customize things like legends, labels, data labels and total labels, gridlines, column colors and others in the Format Visual tab. In addition, there are different visualizations for different purposes, such as ‘Line and Stacked Column’, ‘100% Stacked Column Chart’, and others.
For many report creators, the built-in visualizations will provide all the necessary tools to visualize data they way they want. However, if you are looking for more advanced customization features, give Drill Down Visuals by ZoomCharts a try.
Creating Stacked Column or Bar Charts with ZoomCharts Visuals
This guide will focus on our Drill Down Combo and Combo Bar visuals, but it is also applicable to Timeline PRO if you want a visual that’s optimized for use with datetime units. In these visuals, you can populate up to 25 Series fields, visualize them in any combination of columns, areas or lines, and configure each series independently. You can also create multiple stacks and/or clusters.
We will show how to build a stacked column or bar chart from scratch and explain how to use many different configuration options in various use cases, including:
- Simple stacked column or bar chart
- Side-by-side clustered & stacked column chart
- Stacked column chart with conditionally formatted outline
- 100% stacked column or bar chart
- Column chart with trendline
- 'Nested' column chart

For this guide, we will use a simple dataset with product sales (in units) across different markets. The total sales can be divided into five different product models, and that is what we want to show as a stacked column chart. This will allow us to compare sales totals against each other while also getting insights into what models are the most popular in each market.
In ZoomCharts visuals, there are two methods for creating Power BI stacked column or bar charts – the quick and easy one, and the advanced one.
Power BI Stacked Chart Method 1: With 'Legend' Field
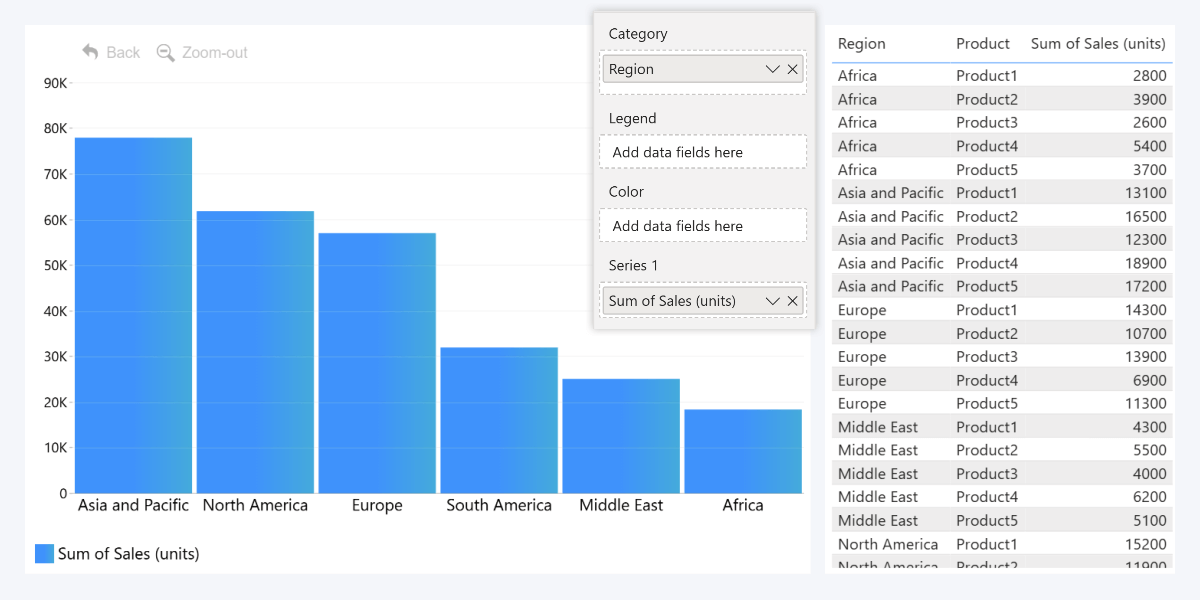
Let’s start with the easy one – it will be familiar to most Power BI report creators since it’s exactly how it’s done in the built-in visuals. In this case, we have two text columns (‘Region’ and ‘Product’) and one column with numerical values (‘Sales’). We can add ‘Region’ to the Category field and ‘Sales’ to Series 1, which will create axis units for each region and visualize the sales numbers as columns.
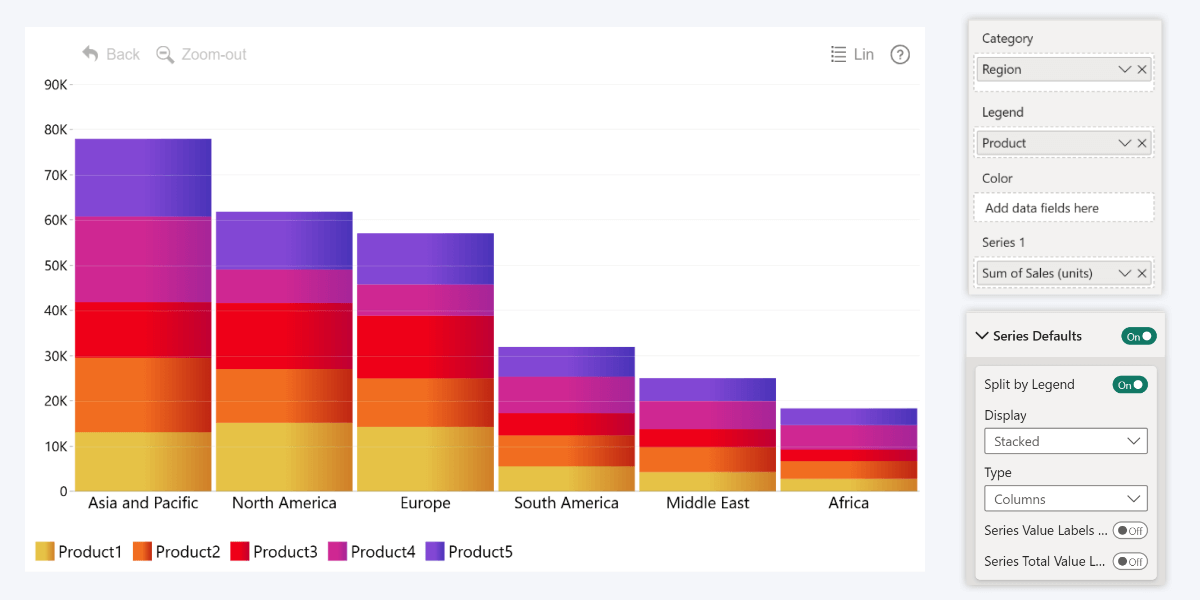
Then, we add ‘Product’ to the Legend field, which will split the series values into segments (product model sales per each region). Set the Display setting in Series Defaults to Stacked, and you’re ready to go! A simple and beautiful Power BI stacked column chart with just two text fields and a single series of numeric values.
If you also enable Legends, each segment will be displayed as a clickable legend item to hide/show it, and when you hover over a column, the tooltip will show the series total and each segment’s separate value. Read more about using the Legend field in this article.
You can further configure the stack’s appearance with the following settings:
- Data Colors: Set a fill color for each segment (uses names from Legend field)
- Stack Settings: Choose between normal, 100% proportional, or zero-based stacking
- Series Value Labels: Enable/disable value labels for each segment and configure their appearance.
- Series Totals Value Labels: Enable/disable and configure value labels for the total of each column.
If you use multiple Series fields, by default, the visual will split each series using Legend field. With the Split by Legend toggle in their specific Series X Configuration sections, you can exclude any individual series from the splitting behavior.
Legend field is the simplest and most convenient method to create a Power BI stacked column chart with this visual. For most cases, it will be the way to go; but it has some limitations, which is why there’s also a more advanced method that we will describe in the next section.
The same Series Defaults and Series X Configuration settings will apply to all segments at once, since they technically are still the same series, just visually separated. Options like fill opacity, outlines, column width, corner radius and conditional formatting will affect the entire stacked column. Also, you can only use one Legend field at a time.
Power BI Stacked Chart Method 2: With Multiple 'Series' Fields
If you want more flexibility and control, another method to create stacked column charts is by adding each part of the stacked column or bar in its separate Series field. Let’s use the same product sales example as before - here, we have one text column (‘Region’) with five adjacent numerical columns (sales per each product model). This will allow us to create a Power BI stacked bar chart with multiple columns.
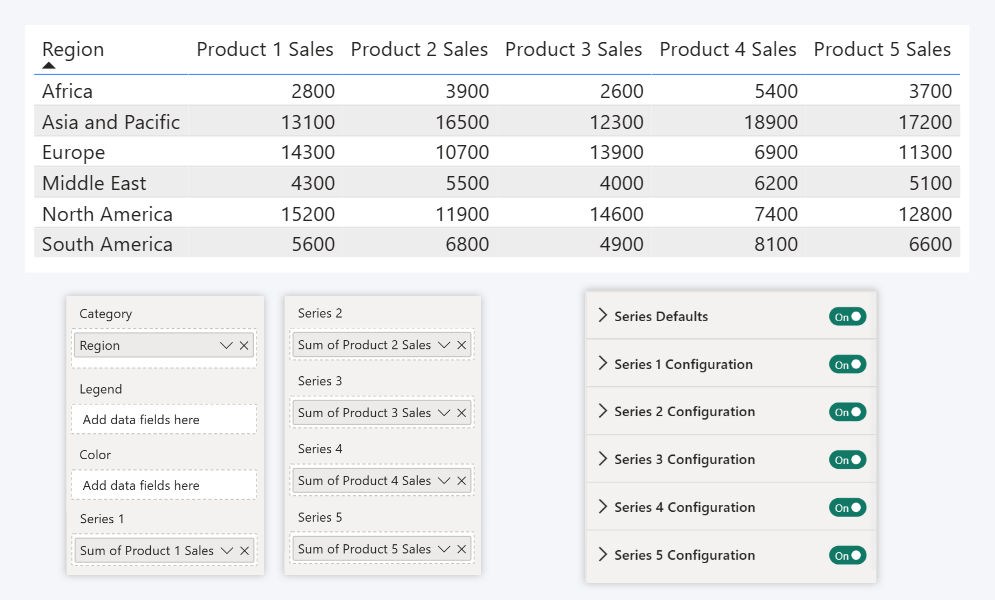
We will add each column in its own Series field, which will also reveal separate Series Configuration sections in the Format Visual tab. So, if we set Series Defaults->Display to ‘Stacked’, we will see a stacked column chart that looks very similar to the one we made before with the easy method.

However, that’s just the beginning, and we can now do much more, thanks to the fact that each segment is now a separate series with its own Series Configuration section. Currently, the series use Series Defaults so they look exactly the same, apart from the fill colors. But, if you enable Customize this Series toggle for a series, you can apply different settings to each segment.
Series Customization
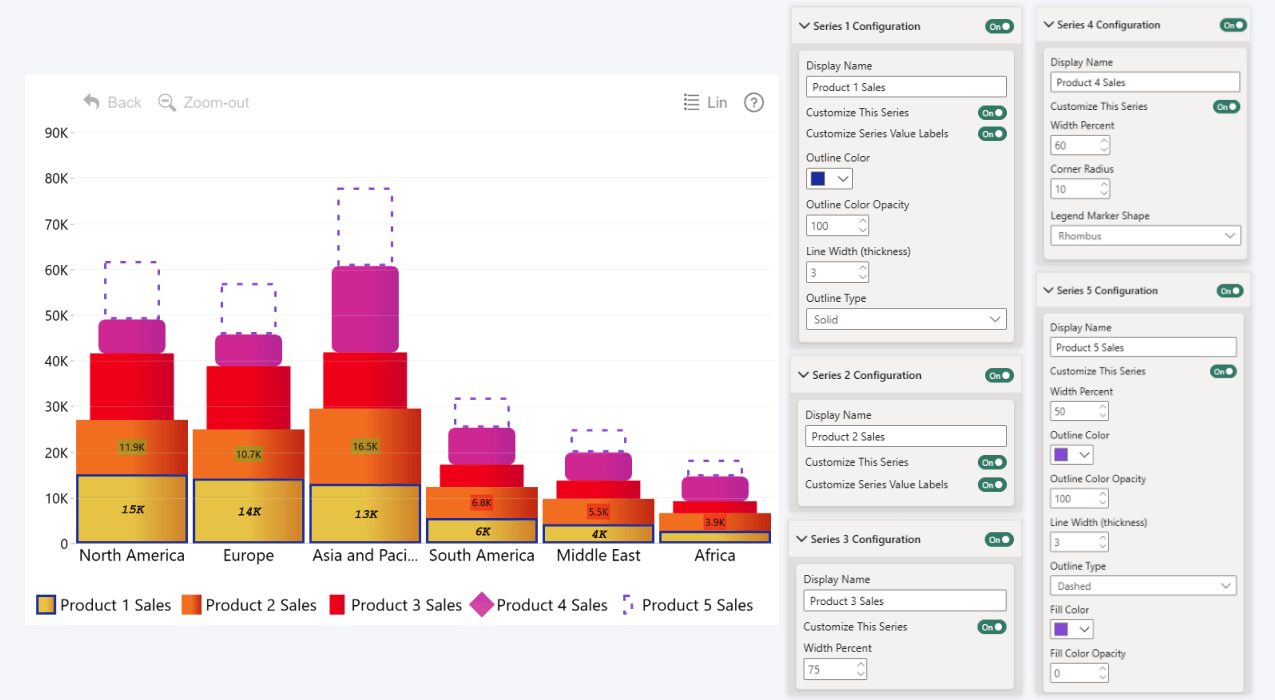
Here’s an extreme example – your reports shouldn’t look as crazy as this, ever, but we just wanted to showcase what kinds of things you can customize with Series Configuration . In this example: two different value label styles – one in Courier italic, the other in Segoe UI with conditional formatting; different column widths, different outline styles and colors, custom legend marker shape, and a series with no fill and just the outline. Of course, in real reports, each of these features will find its use to achieve your desired result.
Okay, let’s take a step back and explore real use cases for the series configuration options. First things first – this visual supports not just one, but multiple stacks and clusters at the same time. In the Series Configuration sections, you can use the Stack setting to choose what stack this series belongs to. Any series that has a matching stack number will be a part of the same stack, but if you wish to exclude a series from stacking, simply assign a number that isn’t used by any other series.
Power BI Stacked & Clustered Column Chart
Let’s combine stacked and clustered column charts in Power BI! We want to compare the sales of Product 1, 2, and 3 against the sales of Product 4 and 5, so both groups will have their own stacked column that will be clustered side-by-side for each region. To do that, we assigned the first three series to Stack 1, and the other two to Stack 2. Same logic applies to the Cluster setting right below it – if Auto doesn’t produce what you want already, make sure that all involved series have the same Cluster number.

Each cluster shows the total stack value in a label – since we are not using Series Defaults anymore, we achieved this by enabling Customize Series Total Value Labels for the top series of each stack (in this case, Series 3 and 5). Two new sections appeared right below – Series 3/5 Total Value Labels, where you can customize the appearance of each totals label. Alternatively, you can enable regular series value labels and toggle "Use Total Stack Value" to choose between cumulative and absolute value for each series.
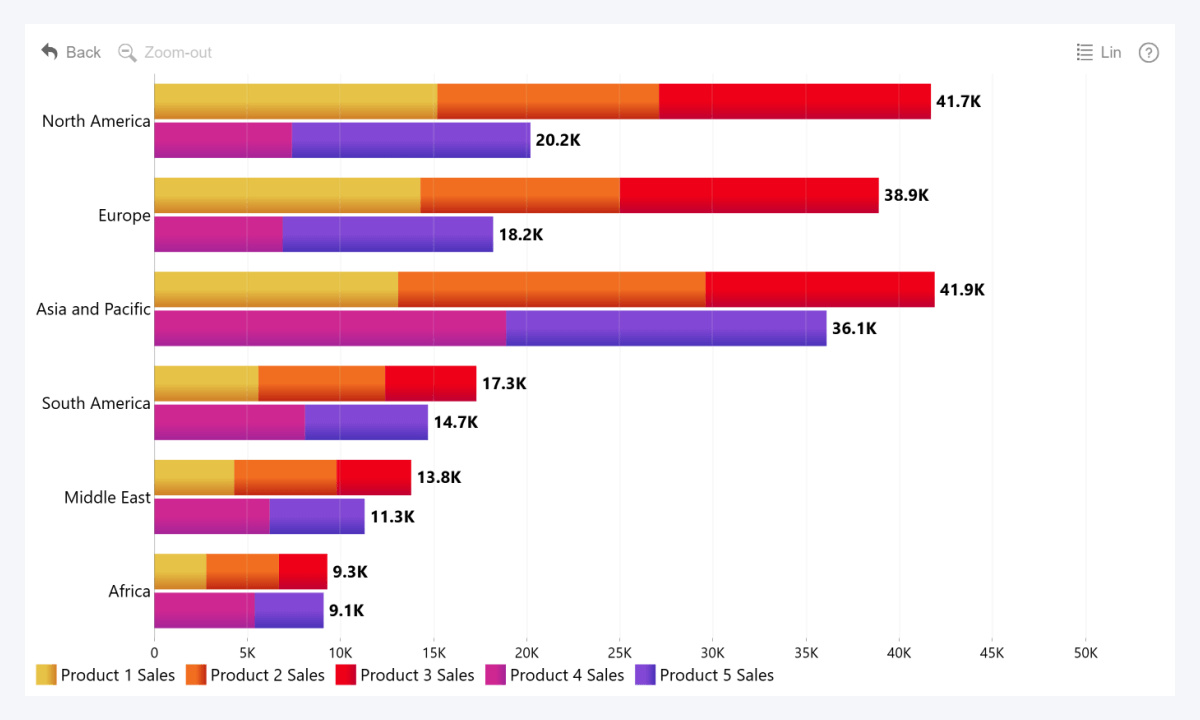
If you want to create a clustered and stacked bar chart in Power BI that is horizontal, not vertical, simply use our Combo Bar PRO custom visual instead of Combo PRO. Follow the same steps and your bar chart will look like this:
Using Additional Columns or Measures
When comparing the Legend field method versus using separate Series fields, we called the former more convenient, and this one more advanced. Now it’s time to show the real power of this approach to Power BI stacked column charts and demonstrate creative ways how you can use the Series fields.
For a good measure, let’s create a new series that has the total sales across all products in each region. We’ll use a simple DAX expression, SUMX, to add together the values of all five columns. Now, we can add it to Series 6 field and use it however we want.
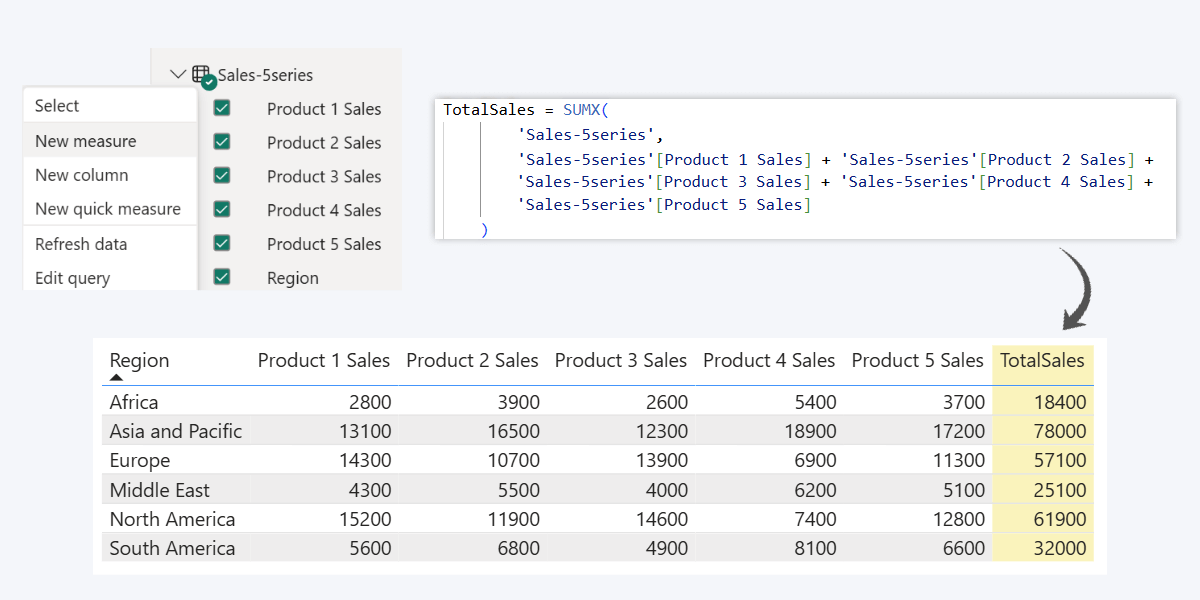
Splendid. So what can I do with this?
Custom Order for Stacked Column Chart based on Series
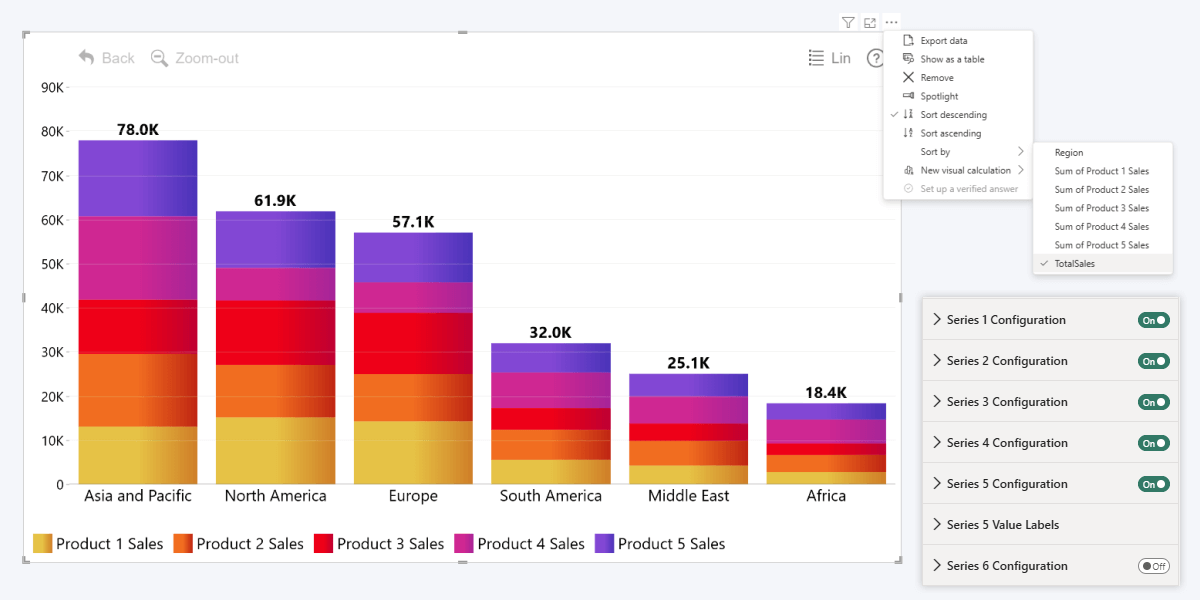
First of all, you can use the new series to change the order of stacked bar chart on the category axis. In the header menu, you can choose between alphabetic order of category names, or use any series to sort in ascending or descending order. Since we now have a series of total values, we can use it to sort the columns. If you don’t want to display the series on the chart and use it purely for sorting purposes, simply disable the toggle for its Series Configuration section.
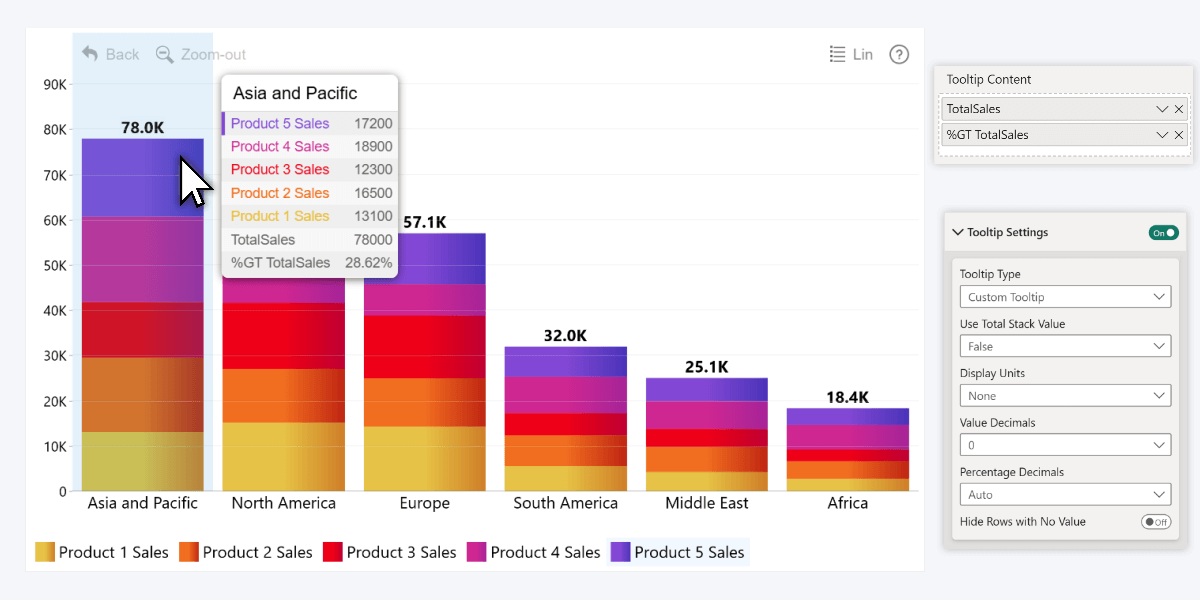
Tooltip Values for Totals or Other Info
Have you noticed something that’s been missing this entire time? That’s right – when we talked about the Legend field method, the tooltip showed not just the segments, but also the entire stack total. But with the multiple Series field method, the tooltip only shows series values – individual or cumulative, depending on your selected Tooltip Settings->Use Total Stack Value mode.
Since we now have the measure for totals, we can use it as a series; or you can add it to the Tooltip Content field if you wish to display it without using it as a series. Tooltip Content field can also be used to display other columns or measures to provide extra info to the user. Actually, let’s add the same measure twice – one to show the total sales in the region, and other as a percentage of all global sales.
Side-By-Side Columns
But we didn’t create this measure just for column sorting or tooltip info – we want to do more. Let’s use it as a series and enrich our stacked column chart even further. Make sure that you use a different number for the Stack setting in Series Configuration, otherwise it will be a part of the stack and basically double the existing amount. That’s why we use Stack 1 for all series within a stacked column, and Stack 2 for the new series with totals.
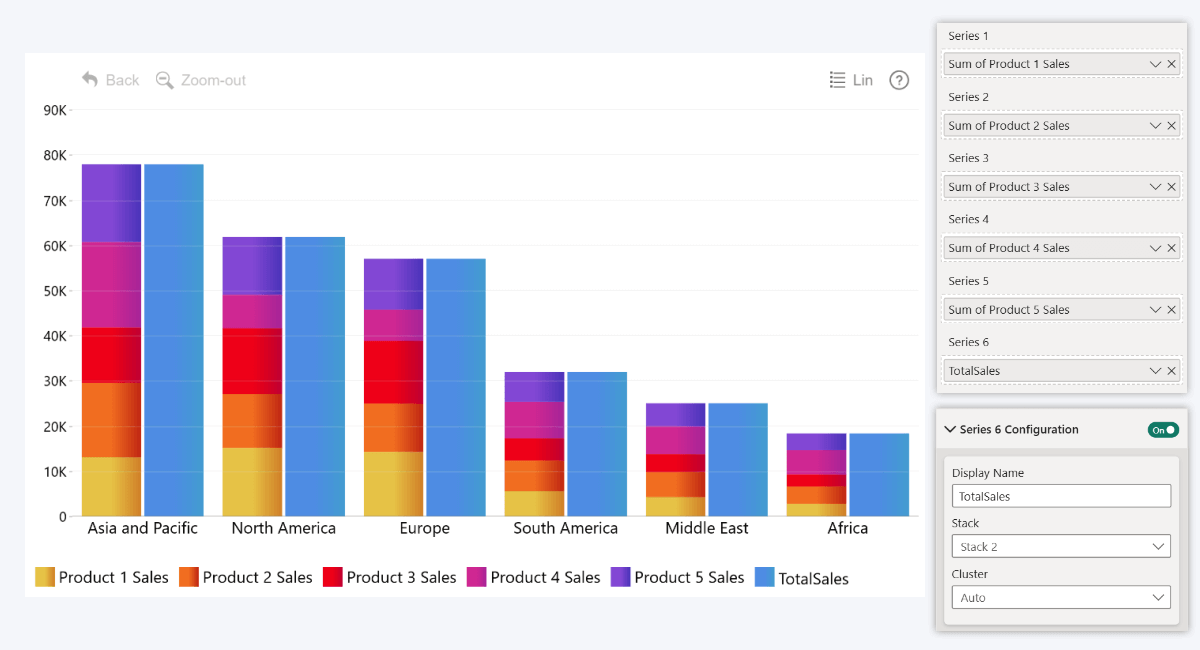
Now, the ‘TotalSales’ series is displayed as a column right next to the stacked column of the five ‘Product Sales’ series. We aren’t done yet, of course; as it is now, it could be useful to show the total sales even if users hide some series using toolbar buttons. Or maybe you can uncheck the Enabled by Default toggle for that series, so users can reveal it only when needed. But what we actually want to do is this.
Power BI Stacked Column Chart with Conditionally Formatted Outline
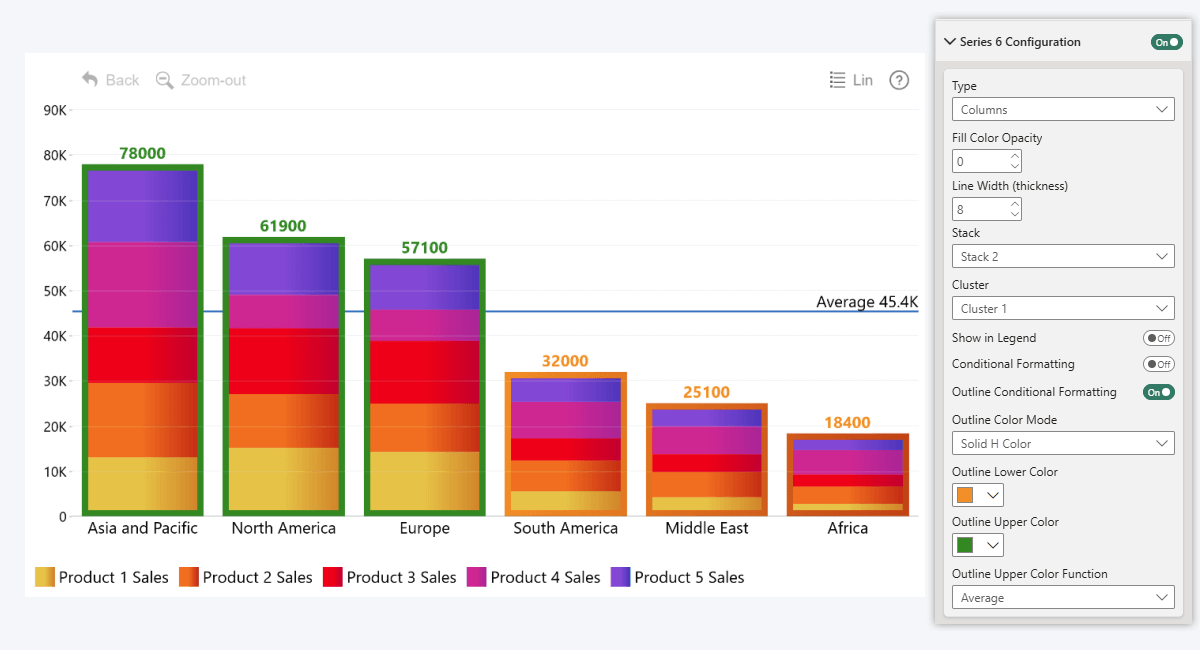
Now, the stacked column chart has an outline with conditional formatting. We used a different Stack number, but the same Cluster as other series – this means that the column will be drawn over the other series, but start from the zero as an independent value. If they were solid columns, it would obscure other series (unless you use Display Order setting to move it to the background), but for our scenario it is fine; we’ll display ‘Total Sales’ series purely as an outline (by setting Fill Color Opacity to zero and increasing Line Width).
We then enabled Outline Conditional Formatting and configured it so that columns exceeding the average have green outlines, and those below it are orange (we also did the same with Font Conditional Formatting for Series 6 Value Labels). Other things to note – you can exclude a series from the legend with the Show in Legend toggle, and we also displayed the global average as a line using the Thresholds feature.
By doing things this way, we got another benefit – since the ‘Total Sales’ series is independent from the stacked column, it will still display the outline and the total value, even if the user hides a series by clicking legend items.
Line and Stacked Column Chart in Power BI
One of the defining features of our Combo, Combo Bar, Timeline, and TimeSeries visuals is that you can choose between columns, lines or areas – not just for the entire chart, but also each of the series separately (up to 25 series at the same time). This means that you can mix & match multiple chart types to visualize exactly what you want. For example, you can add a trendline to a Power BI bar or column chart, show totals as an area in the background, or create any other combination between the three main chart types.
We want to show an average line on our Power BI stacked column chart. For each region, the line will display the average sales between all five products. So, we created a measure that sums up all five columns, divides it by the number of columns (5), and takes the mean value with AverageX. We can then add the measure to a Series field, and choose Line as the series type.
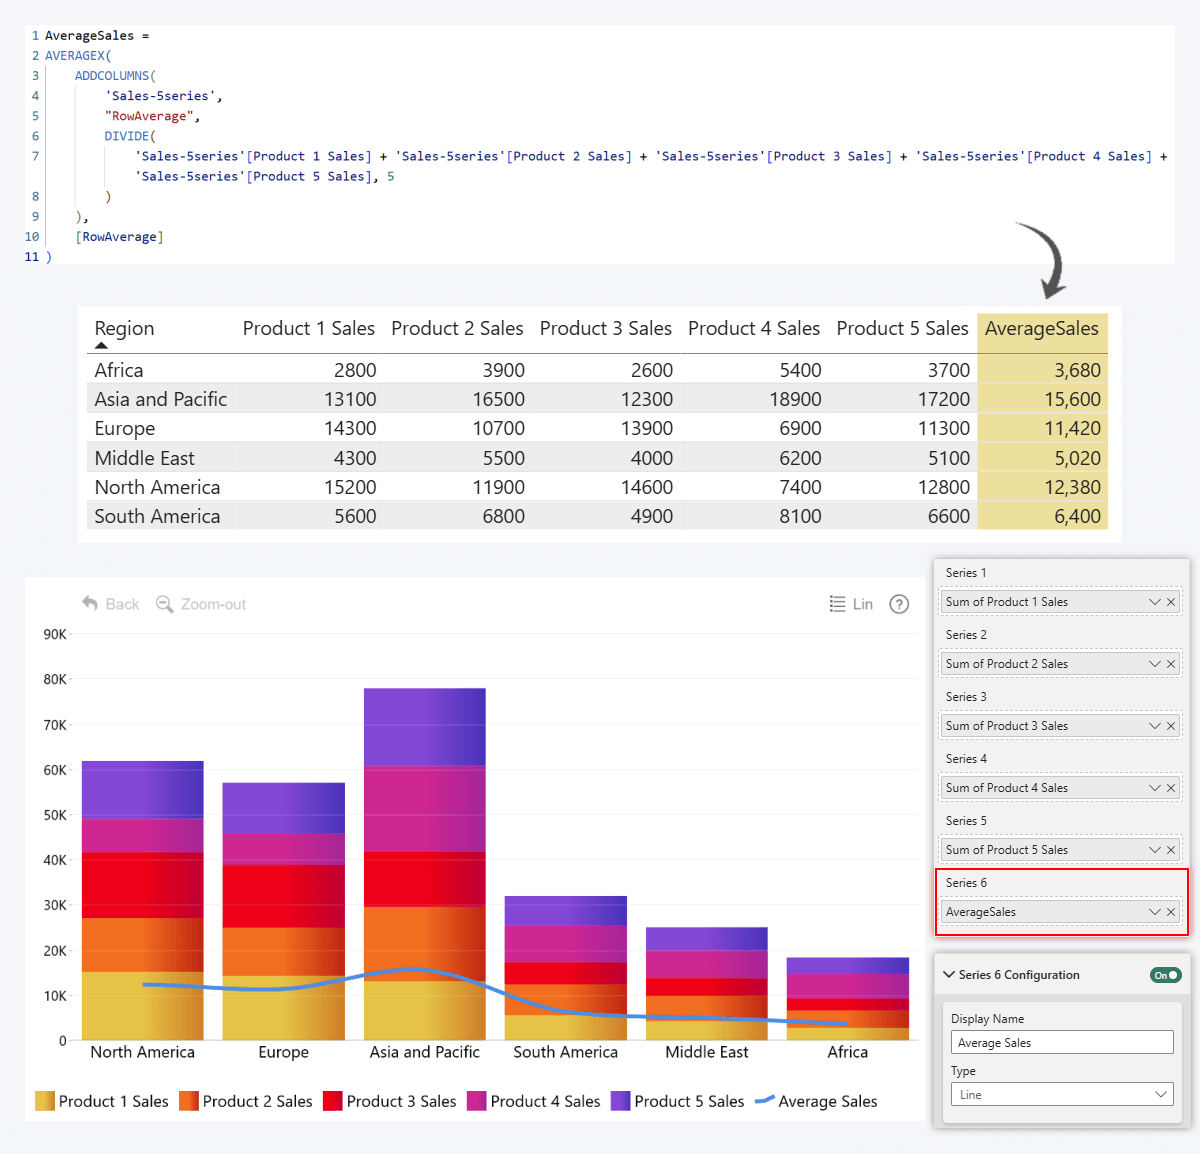
We can then configure the line further in its Series Configuration section. Here, we enabled Stepped Outline; increased both the line width and the marker size so the series is more prominent; enabled and configured its labels so the average values are displayed right on the chart, and applied subtle conditional formatting to the line.

Stack Settings: Applies to Both Methods
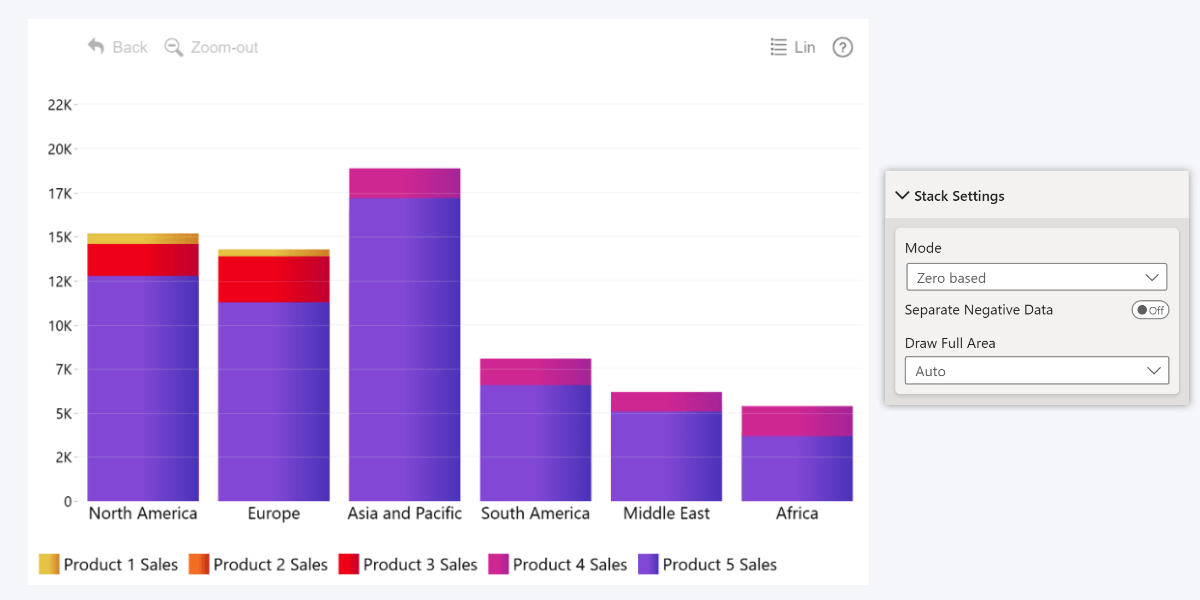
Another thing we need to talk about is the Stack Settings section. It will govern the general stacking behavior for the visual, and it will affect all stacks – whether they’re split using Legend field or created by stacking multiple series. You’ll find the following settings there:
- Mode: Choose between normal (cumulative), 100% proportional, or zero-based stacking.
- Separate Negative Data: Adjust what happens when a series or legend segment has a negative value – whether it’s subtracted from the previous stack or displayed under the zero line as a minus value.
- Draw Full Area: If enabled, this setting will draw each series starting from zero value, not just its part in the stacked column. By default, it is off, but it could be useful in certain scenarios, such as bullet charts or when using zero-based stacking mode and manually configuring the layering order (Series Configuration -> Display Order).
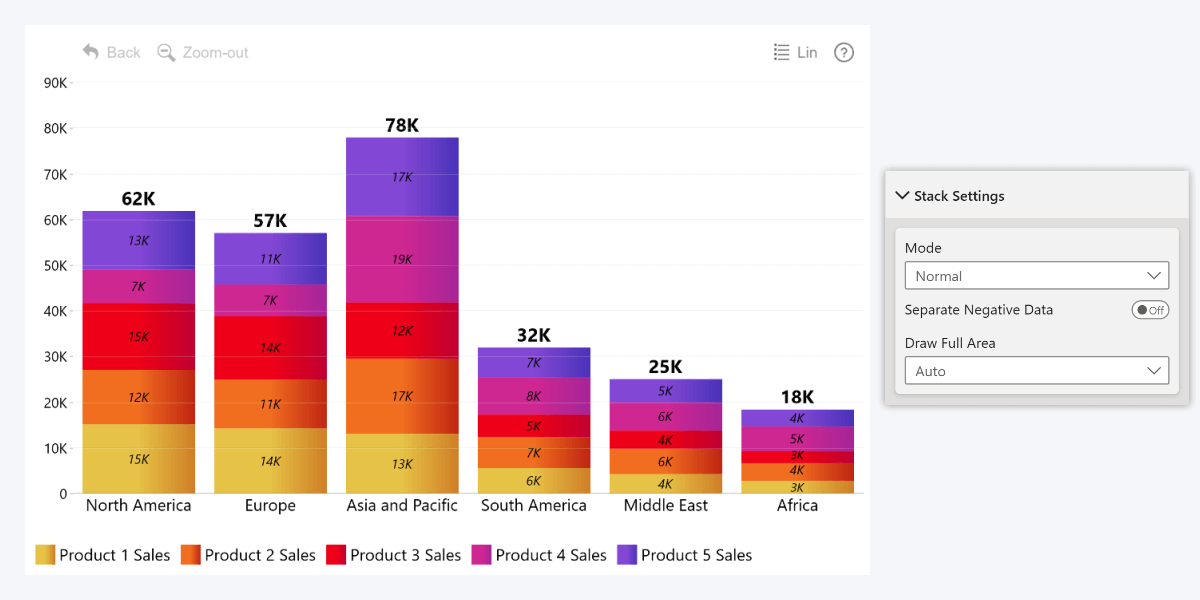
Normal Stacking
Let’s compare the three stacking modes, starting from Normal. It’s the regular Power BI stacked column chart behavior, showing the series as a cumulative stack. Where the previous series ends, the next one immediately begins, and all stacked elements are meant to be part of one total value. To better illustrate this, we enabled value labels for each series. Take a look at the North America column – the segments are 15K + 12K + 15K + 7K + 13K, which adds up to the 62K total value of the stack.
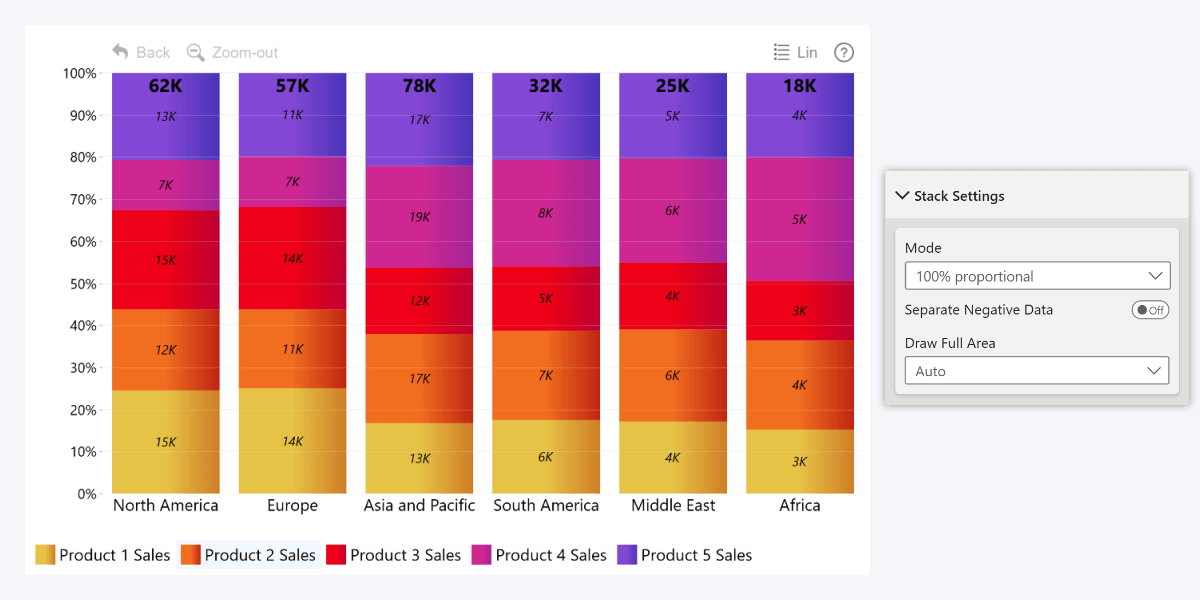
100% Proportional Stacking
However, if a Power BI 100 percent stacked bar chart is what you’re looking for, select the 100% proportional option instead. Now, each stacked column is extended across the entire Y-Axis (or X-axis in Combo Bar) regardless of its value. Instead of comparing different columns against each other, 100% stacked bar charts are used to visualize the proportions of each segment as a part of the total. In this example, we can see that Products 1 and 3 are the market leaders in NA and Europe, but other regions prefer Product 4.
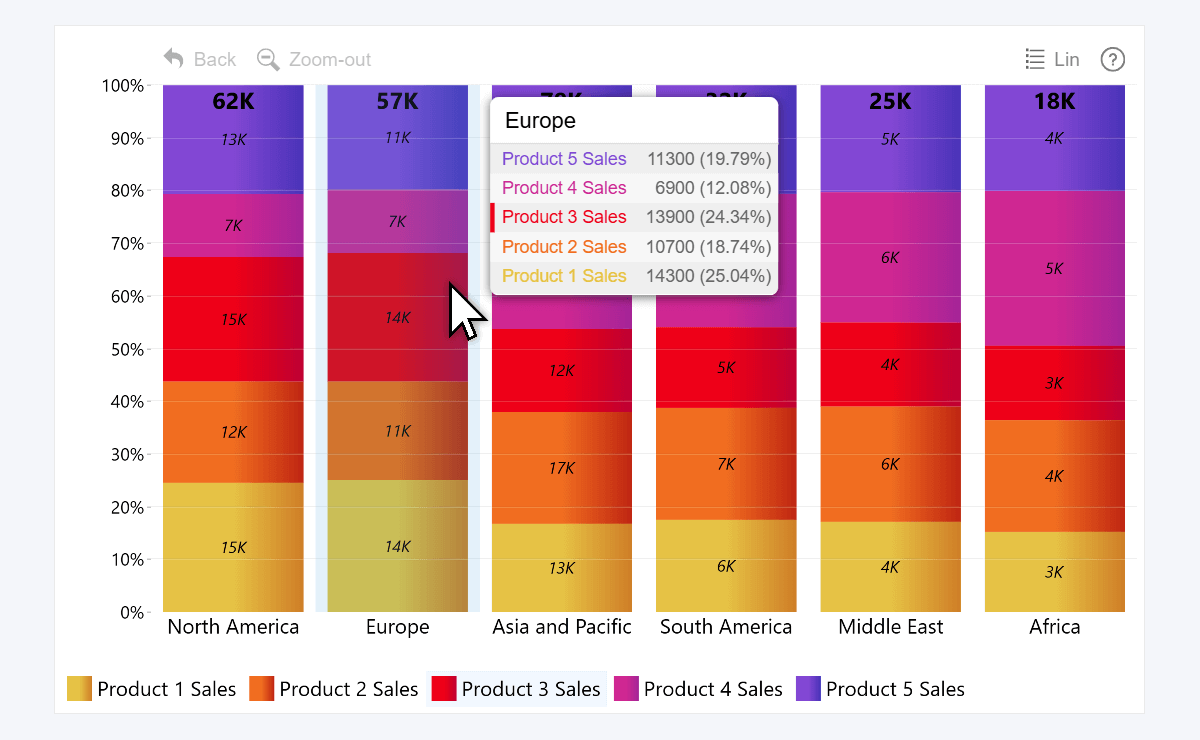
After selecting this stacking mode, the value axis changed from numerical values to a percentage scale. Another neat thing is that when you hover over a column, the tooltip will now show not just the absolute values of each series, but also their percentages against the total.
Zero-Based Stacking
The third stacking mode option is Zero-Based, which will start each stack component from the zero line of the value axis. It’s intended for specific use cases. Without any adjustments to our existing example, it will not be of much use – each series will be drawn over each other, obscuring the values below. We’ll include this screenshot only for demonstration purposes to show what will happen:
What it’s actually designed for is:
- Visualizing multiple line or area series for direct comparison between them
- “Nesting” columns within each other (e.g. bullet charts or target vs. actual).
Let’s use a different dataset to better showcase the latter use case. We want to compare actual revenue against the target revenue. So, we added each as separate series, and featured them in the same stack. Use the Display Order setting to determine the layering – by default, all series use “10”, but since we want to ensure that Series 1 is drawn on top of Series 2, we made sure that its number is larger.
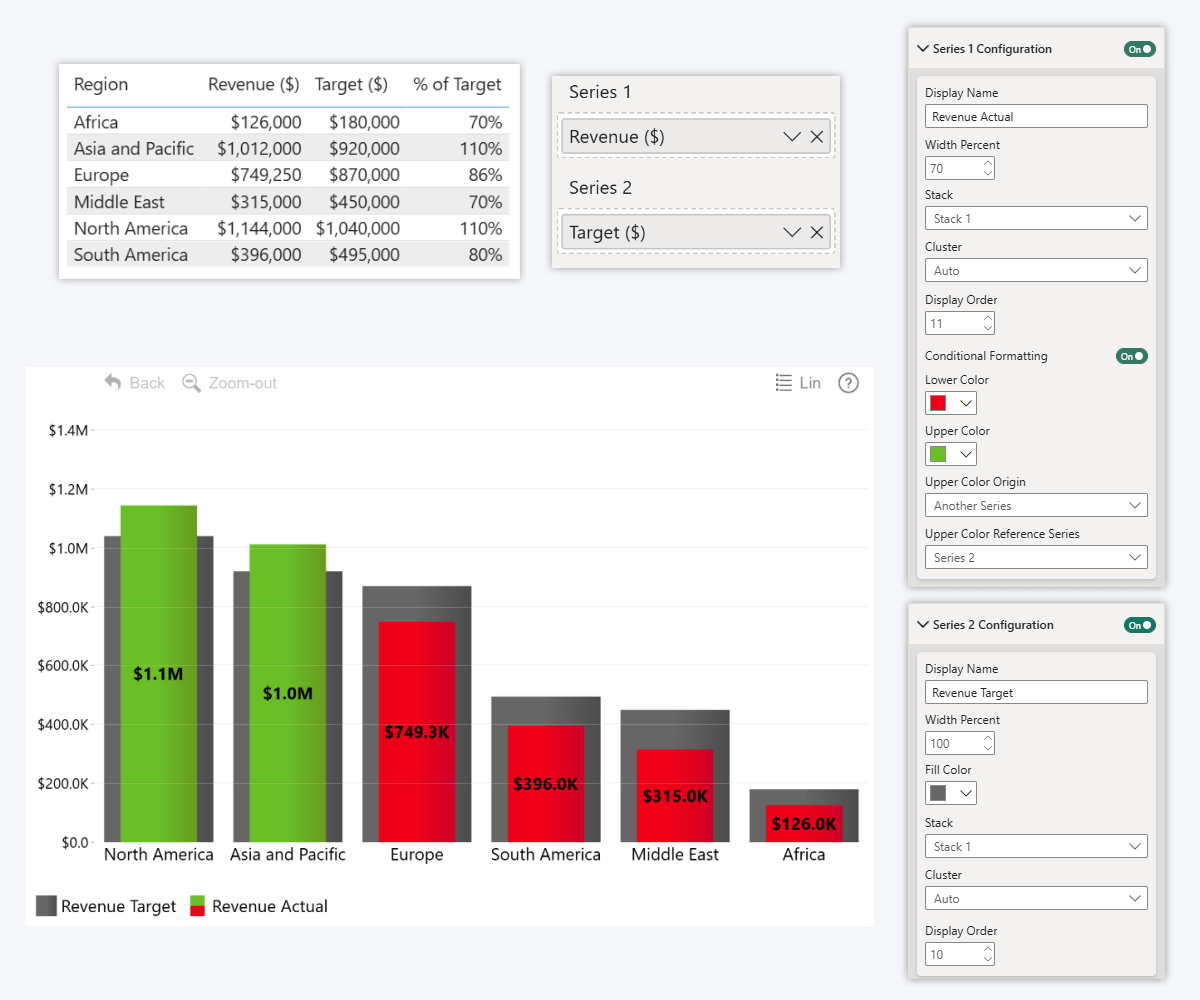
Now, the actual revenue (Series 1) is nested inside the target revenue column (Series 2) – we achieved this by reducing its Width Percent to 70%. As a cherry on top, we also applied conditional formatting – by setting Series 2 (Target) as the reference series, the visual will apply lower color (red) if the actual revenue is below the target, and upper color (green) if it is exceeded.
Using Stacked Columns: Power BI Report Example
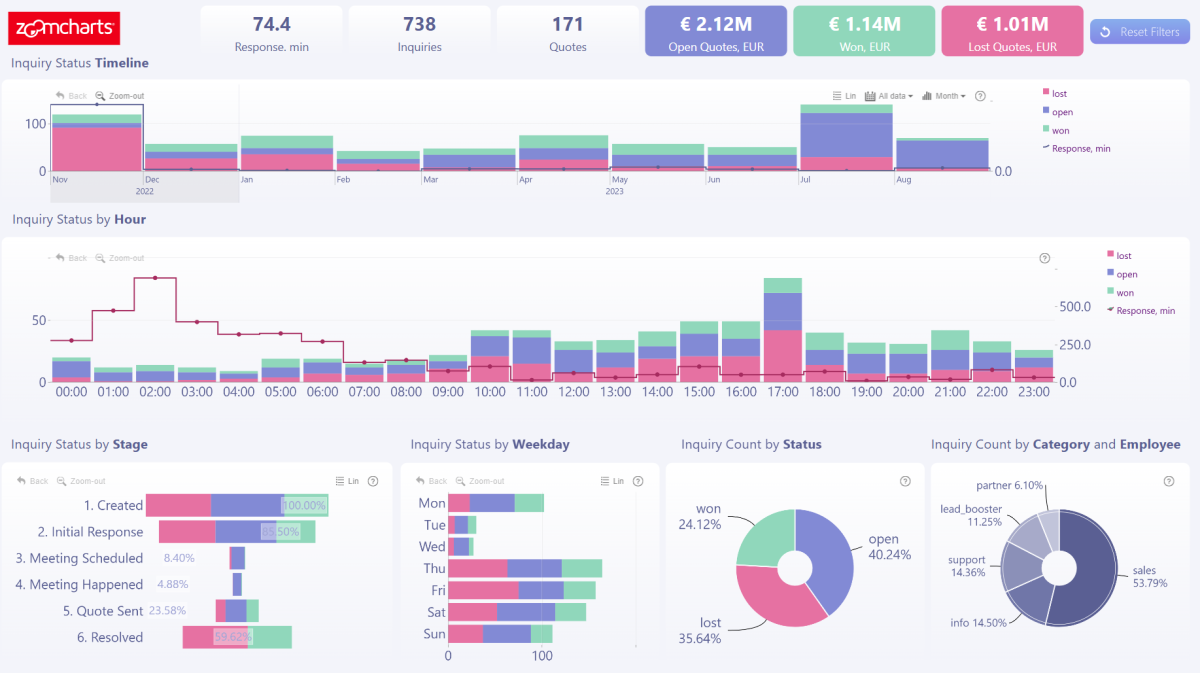
Now that we have seen many different ways to use stacked column charts in Power BI, it’s time to see how would this chart type work next to other visuals in a real-life report example. Our Report Gallery has a wide variety of Power BI report examples with live demos and .pbix template downloads, but we’ll focus on the Inquiry Analysis Report, where stacked columns and bars play an integral role in multiple visuals.
Each inquiry may have ‘won’, ‘open’, or ‘lost’ status, and they are consistently color-coded across the entire page. The Combo, Timeline, and Combo Bar visuals show each category or time unit as a stacked column, so you can see the total amount of inquiries while also separating them by status. And the best part? Selecting data in one visual will instantly filter other visuals – for example, you can click on a donut chart slice to filter inquiries by its status or category.
Try live demo & download template on Report Gallery
FAQ
How do I change the stacking mode to show percentages (100% stack)?
Use the “100% proportional” stacking option so each column is normalized to 100%, and segment labels or tooltips show relative contributions.
When should I not use a stacked column chart?
If some values are positive while others are negative (opposing direction), or you need to compare internal segments precisely, other chart types may work better.
How much customization is possible in formatting stacked columns (colors, outlines, etc.)?
Power BI’s format pane provides customization for axes, data colors, labels, outlines, gridlines, and more to refine the look of your stacked colum
Related content

Want more info like this?
Subscribe to our newsletter and be the first to read our latest articles and expert data visualization tips!


