24442
Inquiry Analysis
Inquiry Analysis
Report Author: ZoomCharts
24442
Share template with others
Summary
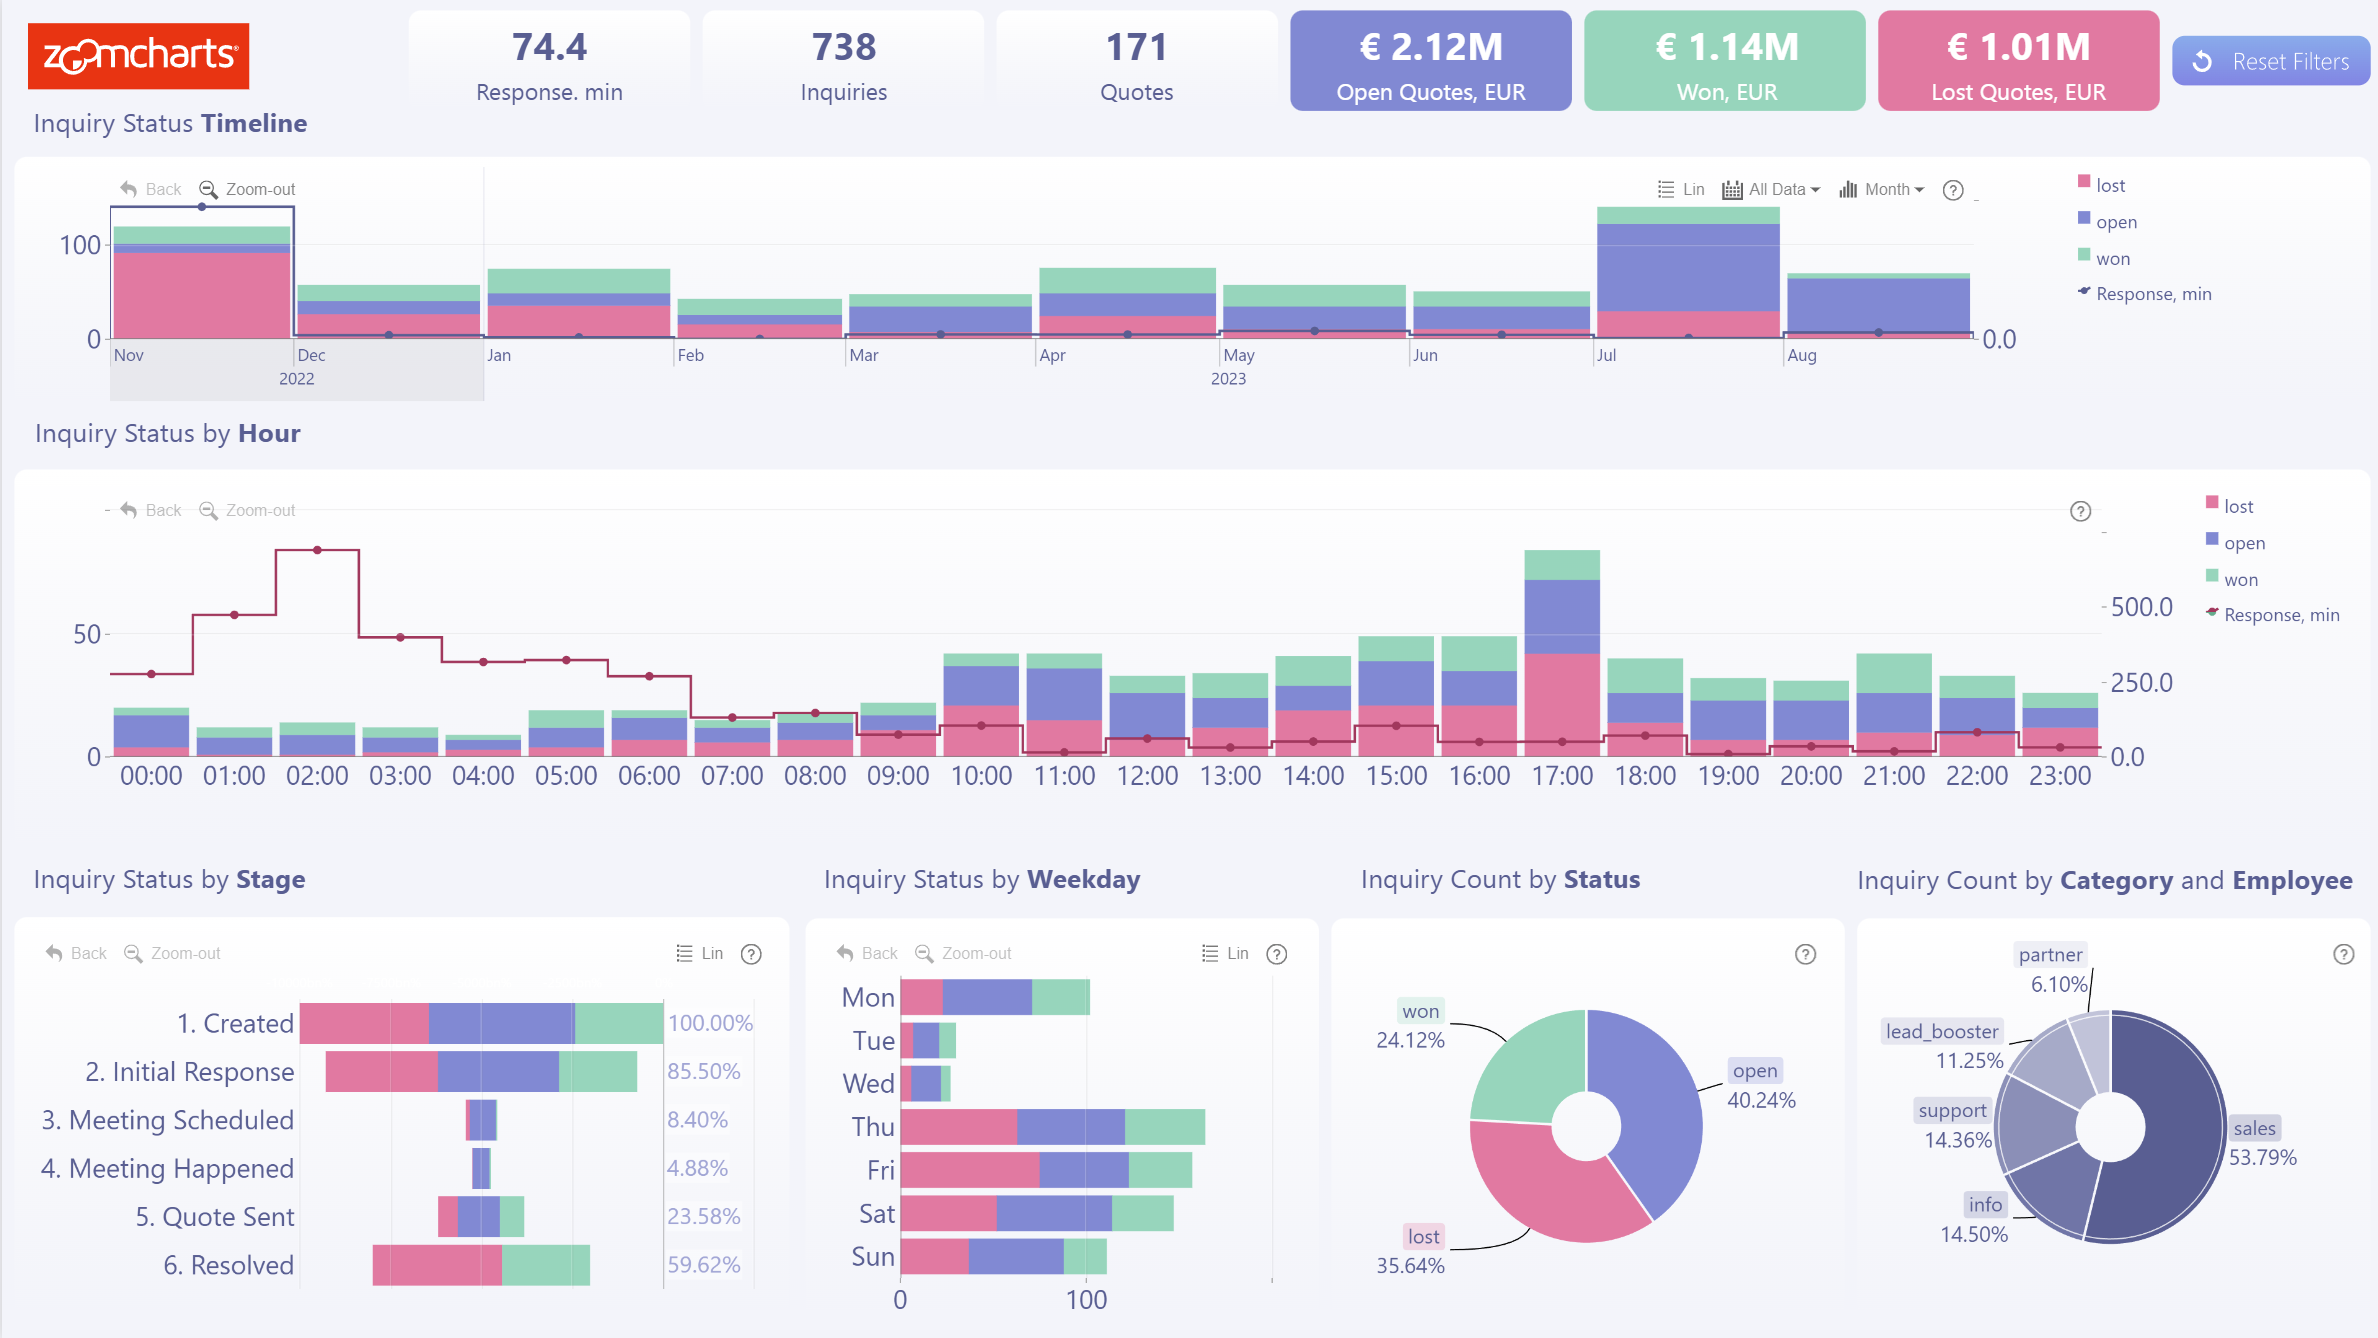
Perform a thorough inquiry analysis with this Power BI customer dashboard template! Easily monitor won, open, and lost inquiries - you can use the respective donut chart to filter the report by inquiry status. You can use the Drill Down Timeline PRO and Drill Down Combo PRO visuals to see incoming inquiries on an hourly timeline to see how quickly each agent responds to an inquiry.
To perform further analysis, you can filter by department and agent to see their performance in relation to incoming inquiries. Note that Drill Down Combo Bar PRO can be customized to act as a funnel visualization that depicts withdrawal rates.
This report lets you perform a wide range of cross-checking activities using cross-chart filtering, thus compacting large amounts of data into a single interactive Power BI report.
Key Features
- Drill Down Timeline PRO lets you visualize and drill down time-based data using DAX calculated measures.
- Drill Down Combo PRO and Combo Bar PRO lets you create a large variety of bar and column charts.
- Drill Down Donut PRO lets you create stunning donut charts.
- Lin/log scale to adjust the readability of the chart.
- Others slice for the donut charts to compact smaller slices for visibility purposes.
- Donut charts work as filters for the rest of the report.
How To Use This Power BI Customer Dashboard Template
To interact with this Inquiry Analysis report example, simply click any active elements on the charts.
Download this free PBIX file to see all the settings, formulas, and calculations. Try it out with your own data and explore the wide range of customization options!
Author:ZC
ZoomCharts visuals used
4U Report Challenges
Participate in data challenges, build and submit reports to get free template downloads.
Join CommunityMobile view allows you to interact with the report. To Download the template please switch to desktop view.

Was this helpful? Thank you for your feedback!
Sorry about that.
How can we improve it?