WEBINAR
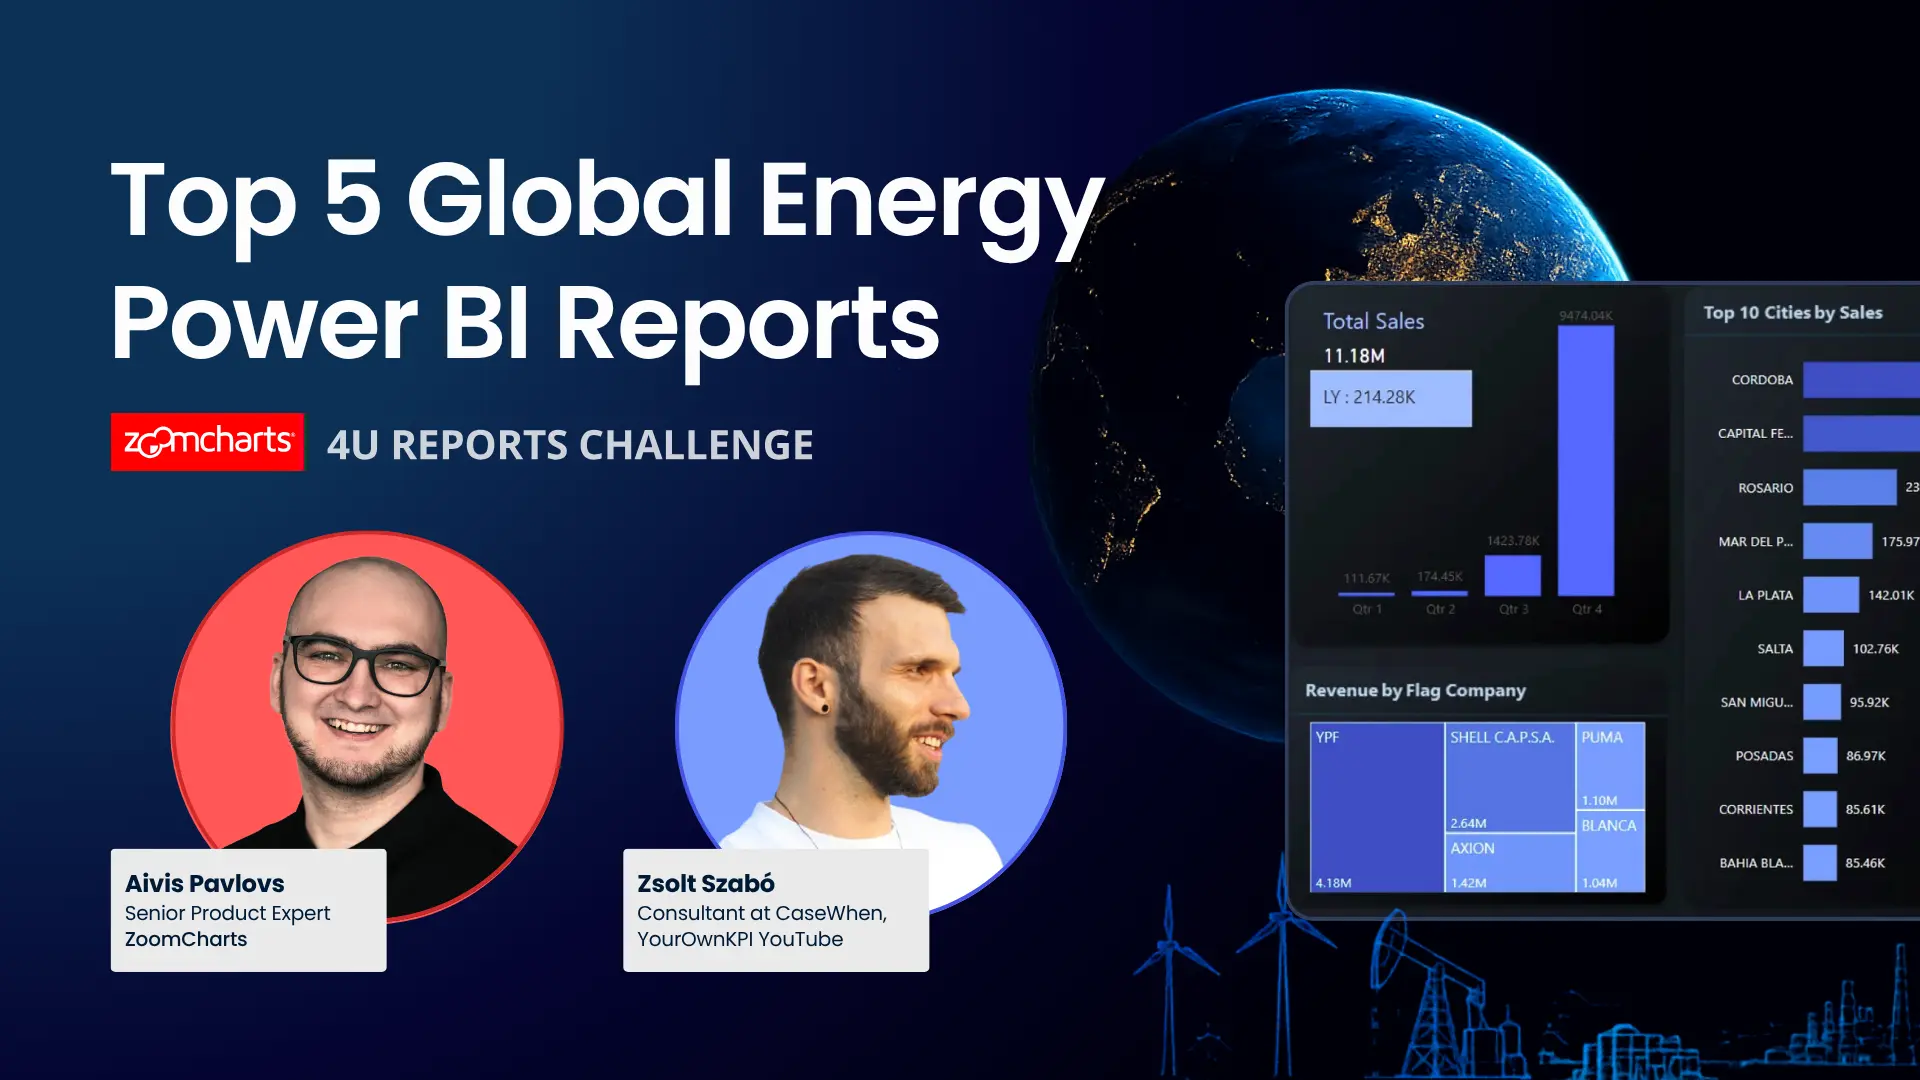
Top 5 Power BI Dashboards on Oil & Gas Energy Analytics
Join this hands-on Power BI workshop and learn how to build an interactive global energy operations dashboard using the June 2026 4U Reports Challenge dataset. Explore production performance, downtime, maintenance, safety, sustainability, and financial KPIs across oil, gas, and energy sites.
WATCH RECORDING
About webinar
About webinar
Join the ZoomCharts team and guest judge Zsolt Szabó as we review the Top 5 submissions from the Build a Global Energy Operations Dashboard in Power BI Challenge.
Together with Zsolt Szabó, Consultant at CaseWhen and creator of the YourOwnKPI YouTube channel, we’ll explore how participants transformed a complex energy operations dataset into decision-ready Power BI dashboards.
In this session, we’ll:
Showcase the Top 5
Review the strongest challenge submissions live.
Explore highly interactvie reports
See creative uses of ZoomCharts Drill Down Visuals in real reports.
Explore layouts and navigation
Compare effective dashboard structures, page flows, and report navigation strategies.
Analyze KPI storytelling
Look at how participants visualized operational, financial, safety, and sustainability KPIs.
Discuss best practices
Learn ideas for interactive reporting, data storytelling, and executive dashboard design.
Hear expert feedback
Get judging insights from guest judge Zsolt Szabó.
We’ll also announce the winners of the $300, $200, and $100 main challenge prizes
Whether you participated in the challenge or simply want inspiration for your next Power BI project, this webinar offers valuable lessons from some of the best dashboard builders in the community.
Date and time
30 Jun, 2026
09:00 AM - EDT
Speakers

Aivis Pavlovs, Senior Product Expert at ZoomCharts

Zsolt Szabó, Consultant at CaseWhen, Youtube channel YourOwnKPI
Watch recording
About webinar
About webinar
Join the ZoomCharts team and guest judge Zsolt Szabó as we review the Top 5 submissions from the Build a Global Energy Operations Dashboard in Power BI Challenge.
Together with Zsolt Szabó, Consultant at CaseWhen and creator of the YourOwnKPI YouTube channel, we’ll explore how participants transformed a complex energy operations dataset into decision-ready Power BI dashboards.
In this session, we’ll:
Showcase the Top 5
Review the strongest challenge submissions live.
Explore highly interactvie reports
See creative uses of ZoomCharts Drill Down Visuals in real reports.
Explore layouts and navigation
Compare effective dashboard structures, page flows, and report navigation strategies.
Analyze KPI storytelling
Look at how participants visualized operational, financial, safety, and sustainability KPIs.
Discuss best practices
Learn ideas for interactive reporting, data storytelling, and executive dashboard design.
Hear expert feedback
Get judging insights from guest judge Zsolt Szabó.
We’ll also announce the winners of the $300, $200, and $100 main challenge prizes
Whether you participated in the challenge or simply want inspiration for your next Power BI project, this webinar offers valuable lessons from some of the best dashboard builders in the community.
Date and time
30 Jun, 2026
09:00 AM - EDT
Speakers
Aivis Pavlovs, Senior Product Expert at ZoomCharts
Zsolt Szabó, Consultant at CaseWhen, Youtube channel YourOwnKPI