WEBINAR
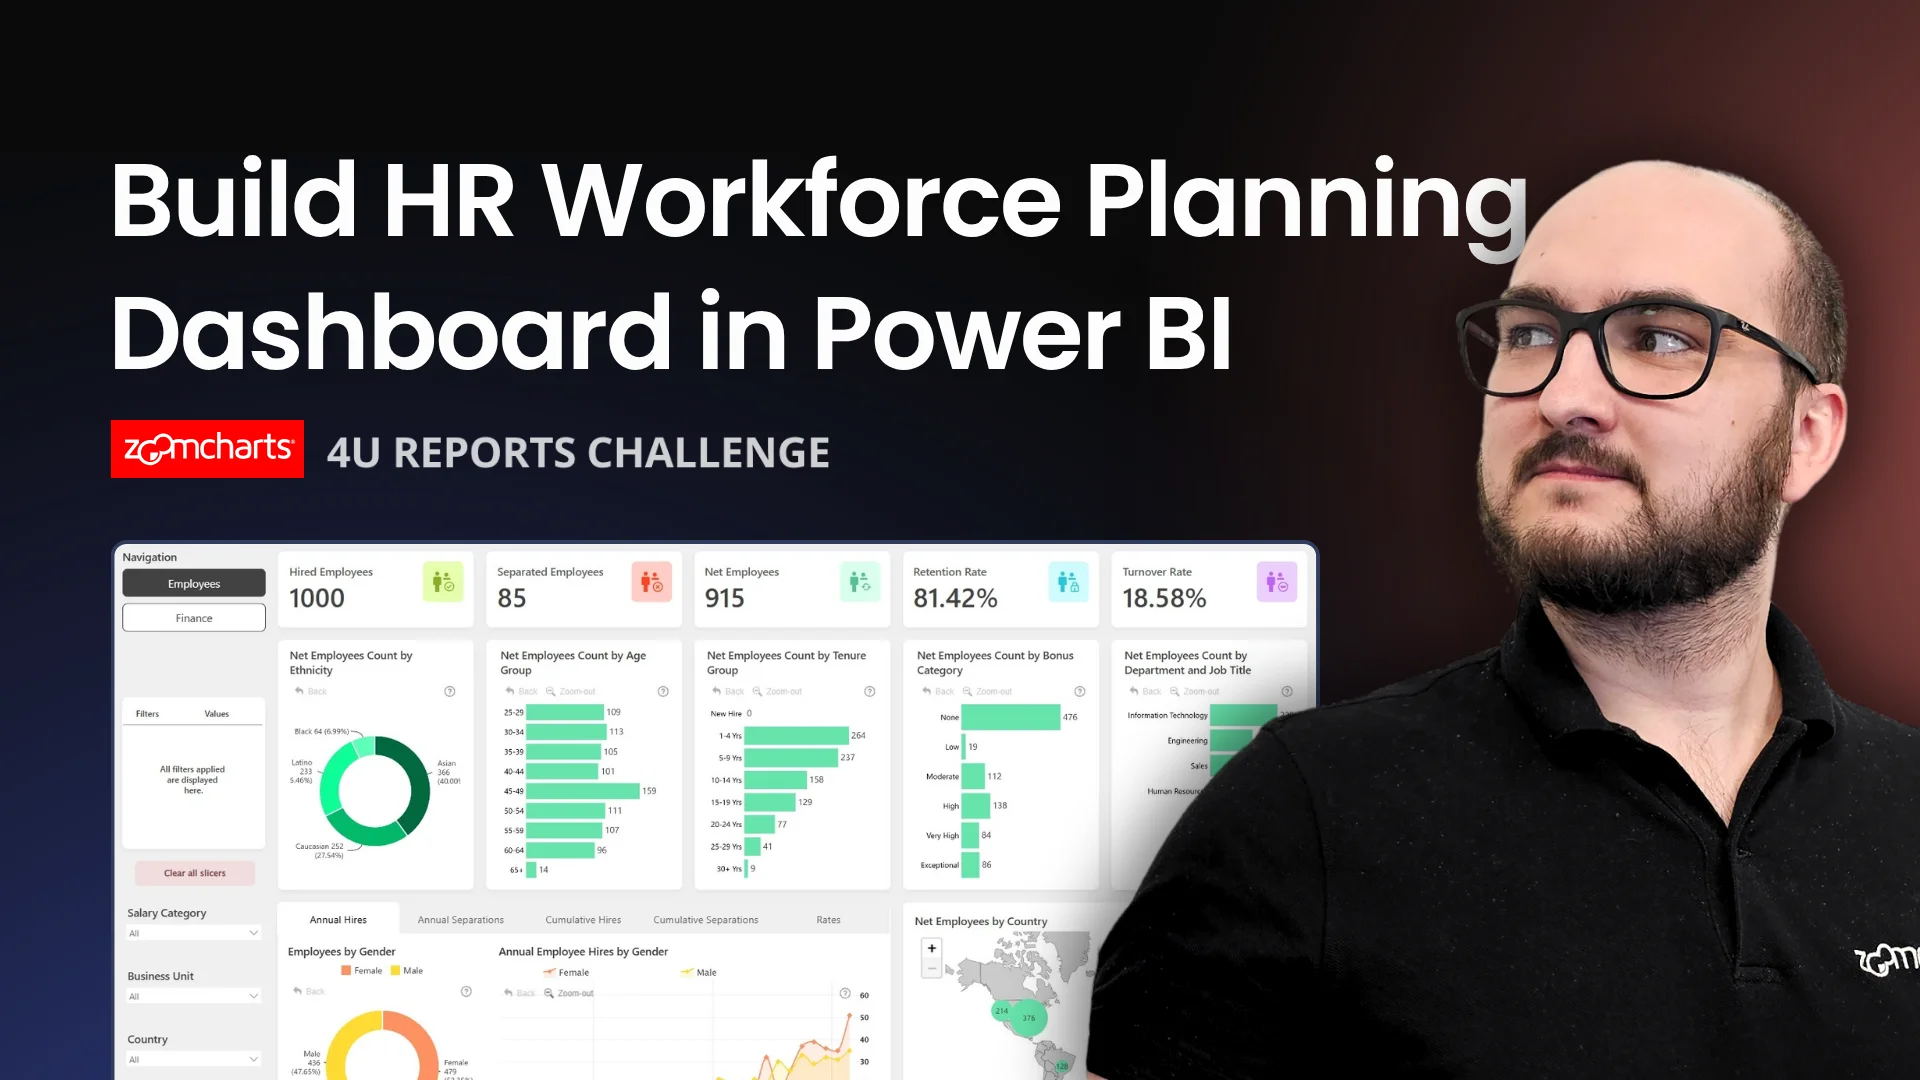
How to Build HR Workforce Planning Dashboard in Power BI
Join this hands-on Power BI workshop to explore the 4U Reports Challenge dataset and learn how to build an interactive HR analytics dashboard focused on headcount planning, attrition, retention, and workforce.
DAYS
HOURS
MINUTES
SECONDS
SIGN UP NOW
About webinar
Learn how to build an HR Workforce Planning & Attrition Analytics dashboard in Power BI using the July 2026 4U Reports Challenge dataset.
This workshop is based on the 4U Reports July 2026 Power BI Challenge . The dataset includes employee records, monthly workforce snapshots, hiring and termination events, compensation, engagement, performance, absence, recruitment activity, and workforce planning targets.
During the session, we will walk through practical ways to turn this HR dataset into a useful Power BI dashboard for workforce decision-making. You will see how to structure the analysis around core HR questions, compare actual workforce levels against planned targets, and highlight attrition patterns across departments, locations, tenure bands, and employee segments.
In this webinar, attendees will explore how to:
Structure HR analytics
Build a clear HR analytics report structure in Power BI.
Track workforce growth
Analyze headcount, FTE, workforce changes, and planning gaps.
Analyze attrition
Compare attrition by department, location, role, tenure, and termination reason.
Add retention context
Use engagement, performance, absence, and compensation data to support retention analysis.
Create drill-down views
Help users move from summary KPIs into detailed workforce insights.
Present findings clearly
Communicate workforce planning insights for HR and business stakeholders.
This webinar is useful for Power BI users, HR analysts, BI developers, and report designers who want to improve their approach to workforce planning dashboards and attrition analytics.
Webinar Date: July 9, 2026
Date and time
09 Jul, 2026
07:00 AM - EDT
Speakers

Aivis Pavlovs, Senior Product Expert at ZoomCharts
Sign up now
About webinar
Learn how to build an HR Workforce Planning & Attrition Analytics dashboard in Power BI using the July 2026 4U Reports Challenge dataset.
This workshop is based on the 4U Reports July 2026 Power BI Challenge . The dataset includes employee records, monthly workforce snapshots, hiring and termination events, compensation, engagement, performance, absence, recruitment activity, and workforce planning targets.
During the session, we will walk through practical ways to turn this HR dataset into a useful Power BI dashboard for workforce decision-making. You will see how to structure the analysis around core HR questions, compare actual workforce levels against planned targets, and highlight attrition patterns across departments, locations, tenure bands, and employee segments.
In this webinar, attendees will explore how to:
Structure HR analytics
Build a clear HR analytics report structure in Power BI.
Track workforce growth
Analyze headcount, FTE, workforce changes, and planning gaps.
Analyze attrition
Compare attrition by department, location, role, tenure, and termination reason.
Add retention context
Use engagement, performance, absence, and compensation data to support retention analysis.
Create drill-down views
Help users move from summary KPIs into detailed workforce insights.
Present findings clearly
Communicate workforce planning insights for HR and business stakeholders.
This webinar is useful for Power BI users, HR analysts, BI developers, and report designers who want to improve their approach to workforce planning dashboards and attrition analytics.
Webinar Date: July 9, 2026
Date and time
09 Jul, 2026
07:00 AM - EDT
Speakers
Aivis Pavlovs, Senior Product Expert at ZoomCharts