WEBINAR
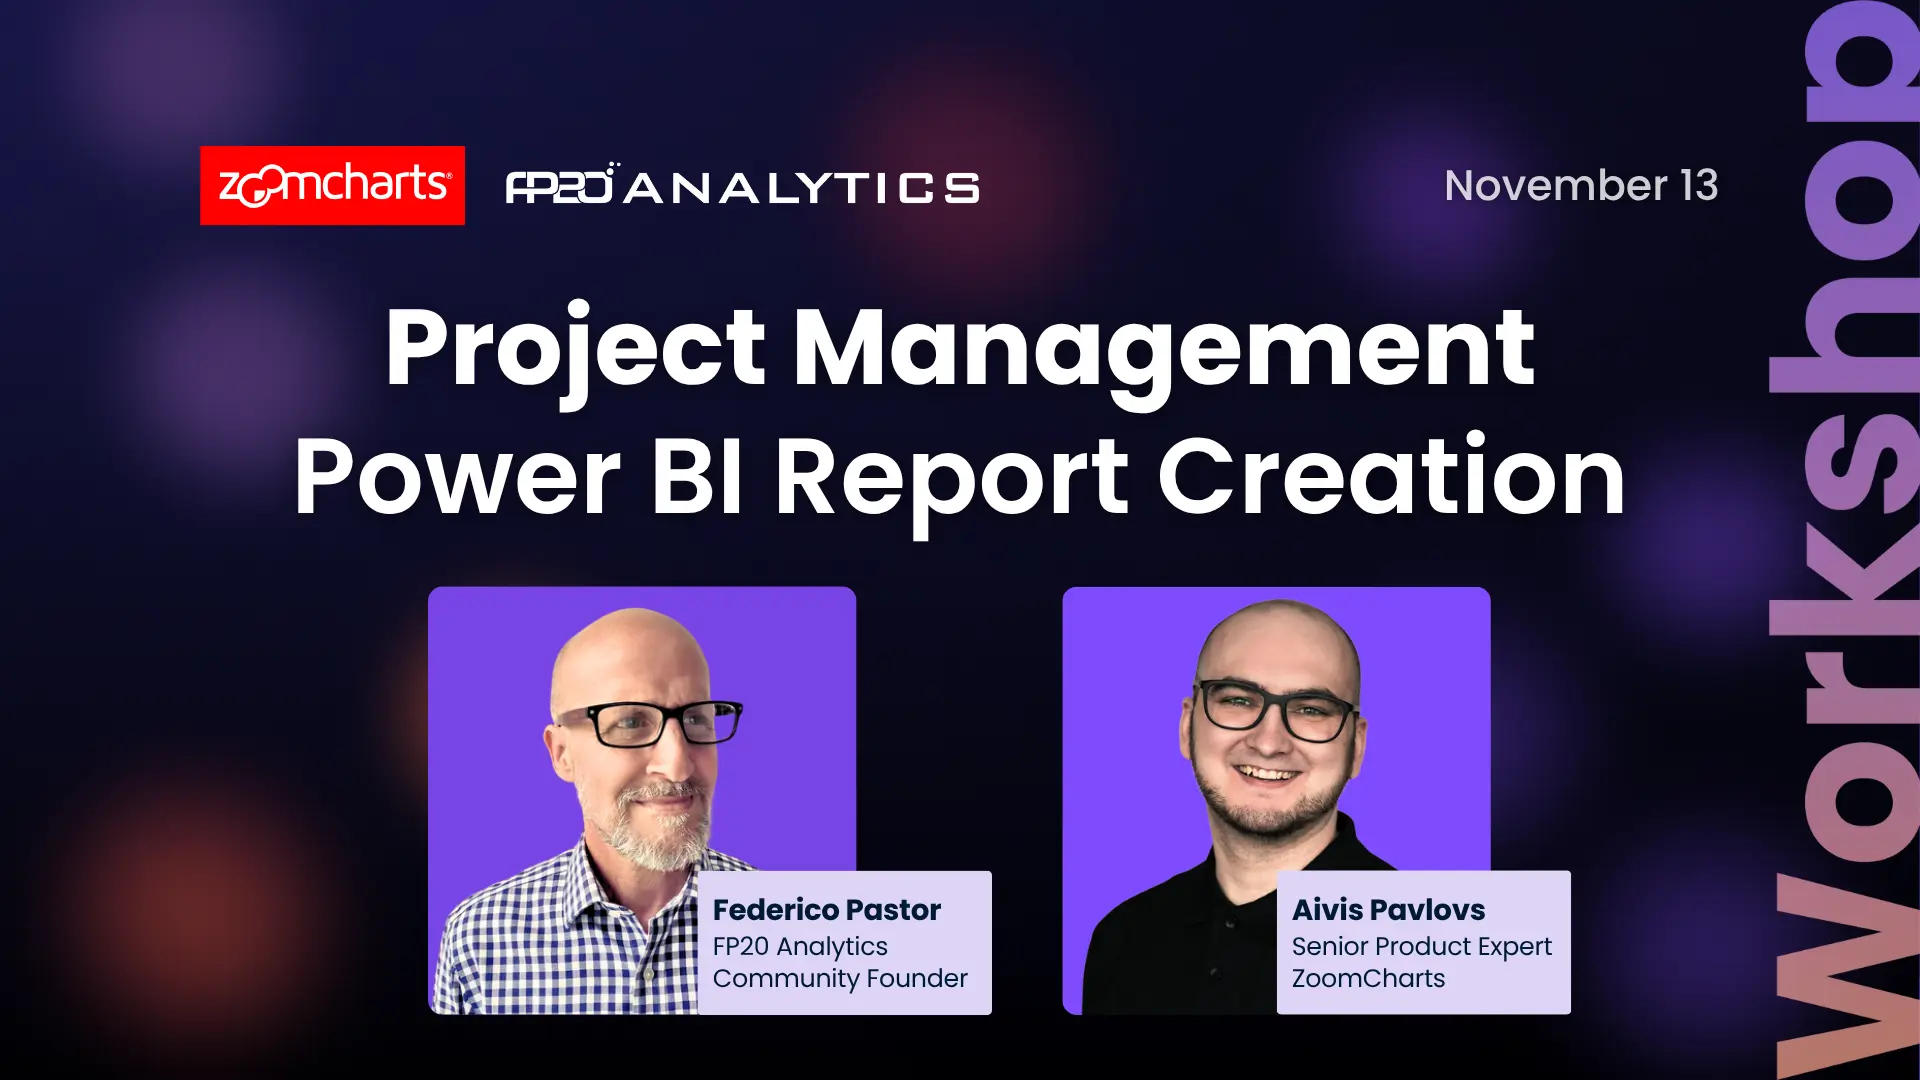
Create Fintech Project Management Power BI Report
In this live workshop, we’ll guide you through preparing the Fintech Project Management dataset and building an interactive Power BI dashboard to track project performance, resources, and costs step by step.
WATCH RECORDING
About webinar
In this live, hands-on session, you will learn how to prepare the Fintech Project Management dataset and build a Power BI report that tracks project delivery efficiency across multiple fintech initiatives. (Register for the FP20 Analytics Challenge to access the dataset.)
You will explore how to structure project and resource data, connect tables for cross-department insights, and use ZoomCharts Drill Down PRO visuals to reveal key trends in project timelines, costs, and productivity.
This session is beginner-friendly and focused on practical Power BI techniques you can apply right away to your reports!
What you will learn:
-
-
How to prepare data for effective analysis and visualization in Power BI
-
How to connect tables to monitor performance by project, department, and region
-
How to visualize data to identify workflow bottlenecks and potential project risks
-
How to use ZoomCharts Drill Down PRO visuals to explore data interactively
-
How to submit your Project Management dashboard to the FP20 Analytics ZoomCharts Data Challenge
-
Speakers
Aivis Pavlovs – Senior Power BI expert at ZoomCharts
Federico Pastor – Power BI trainer and founder of FP20 Analytics
This session is ideal for Power BI users, data analysts, and professionals working in fintech or project management who want to sharpen their reporting skills using real-world dataset, Power BI and ZoomCharts!
We will be streaming live on LinkedIn, YouTube, and Facebook.
Register using the form above to receive access links to the live rooms.
Date and time
13 Nov, 2025
08:00 AM - EST
Speakers

Federico Pastor, Power BI Trainer and FP20 Analytics Community Founder

Aivis Pavlovs, Senior Product Expert at ZoomCharts
Watch recording
About webinar
In this live, hands-on session, you will learn how to prepare the Fintech Project Management dataset and build a Power BI report that tracks project delivery efficiency across multiple fintech initiatives. (Register for the FP20 Analytics Challenge to access the dataset.)
You will explore how to structure project and resource data, connect tables for cross-department insights, and use ZoomCharts Drill Down PRO visuals to reveal key trends in project timelines, costs, and productivity.
This session is beginner-friendly and focused on practical Power BI techniques you can apply right away to your reports!
What you will learn:
-
-
How to prepare data for effective analysis and visualization in Power BI
-
How to connect tables to monitor performance by project, department, and region
-
How to visualize data to identify workflow bottlenecks and potential project risks
-
How to use ZoomCharts Drill Down PRO visuals to explore data interactively
-
How to submit your Project Management dashboard to the FP20 Analytics ZoomCharts Data Challenge
-
Speakers
Aivis Pavlovs – Senior Power BI expert at ZoomCharts
Federico Pastor – Power BI trainer and founder of FP20 Analytics
This session is ideal for Power BI users, data analysts, and professionals working in fintech or project management who want to sharpen their reporting skills using real-world dataset, Power BI and ZoomCharts!
We will be streaming live on LinkedIn, YouTube, and Facebook.
Register using the form above to receive access links to the live rooms.
Date and time
13 Nov, 2025
08:00 AM - EST
Speakers

Federico Pastor, Power BI Trainer and FP20 Analytics Community Founder

Aivis Pavlovs, Senior Product Expert at ZoomCharts
