logo
For Power BI
  • Products
    • Drill Down Donut Pro Drill Down Donut PRO
    • Drill Down Pie Pro Drill Down Pie PRO
    • Drill TimeSeries Pro Drill Down TimeSeries PRO
    • Drill Combo Pro Drill Down Combo PRO
    • Drill Map Pro Drill Down Map PRO
    • Drill Scatter Pro Drill Down Scatter PRO
    • Drill Bubble Pro Drill Down Bubble PRO
    • Drill Down Network Pro Drill Down Network PRO
    • Drill Down Waterfall Pro Drill Down Waterfall PRO
    • Drill Down Graph Pro Drill Down Graph PRO
    • Drill Down Timeline Pro Drill Down Timeline PRO
    • Drill Down Combo Bar PRO Drill Down Combo Bar PRO
    • Drill Down Line PRO Drill Down Line PRO

    Video tutorials

    Watch Now

    More than 90 videos on how to enhance Power BI with ZoomCharts

    Learn more
    All visuals
  • Resources

      Resources

    • Documentation
    • Report Examples
    • Blog
    • Webinars
    • Video Tutorials
    • Visuals Gallery

    Support

    • ZoomCharts Assistance
    • Contact Sales
    • Contact Support
    • FAQ

    Challenges

    Challenges

    Improve your report creation skills by participating in free challenges for report creators.

    Learn more
    Get Developer License
  • Services
    • Power BI Report Development
    • Custom Visual Development
  • Challenges
  • Pricing
Request a quote Get Developer License Sign in
Request a quote Book a Demo Get Developer License Sign in
Get it now
Go back

Contents

Reset your password

We'll email you instructions on how to reset your password

Go back

Share

Logo

Welcome to the FP20 Analytics November 2025 Challenge!

Nov 06 - Dec 09, 2025 | EST

In this Power BI data visualization challenge, you will work with a Fintech Project Management dataset from a company that develops and delivers innovative payment solutions across Europe.

Submission deadline

00

DAYS

00

HOURS

00

MINUTES

00

SECONDS

Sign in or sign up to continue

Make sure you provide an email address that you check regularly.


Already have an account? Sign in!

Login options
Forgot password?

Register for the FP20 Analytics Challenge with ZoomCharts!


Activate your ZoomCharts Drill Down visuals Free Developer License!

Go to your dashboard to download your free ZoomCharts Developer License and see how to apply it in Power BI Desktop here 👇


Ready to submit your report for review?

Thank you! Your report has been submitted!

View report

Submitted:

Your report will undergo validation. Once the validation of your report is complete, we will send you a Power BI Publish to Web link that you can share publicly.

Confirmed your submission fits the criteria:

Reviewed:

Rejection reason:

Sorry, we are no longer accepting entries for this competition. Stay tuned for future events!

Something went wrong, please contact support!

Timeline

Registration Open

Registration Open

06 November | 03:00

-

Submissions Open

Submissions Open

06 November | 03:00

-

Workshop | Create Fintech Project Management Power BI Report

Workshop | Create Fintech Project Management Power BI Report

13 November | 08:00

-

1:1 Mentoring Sessions

1:1 Mentoring Sessions

13 November | 08:00

06 November - 03 December

Entry Submission Deadline

Entry Submission Deadline

03 December | 16:59

06 November - 03 December

Winner Announced

Winner Announced

09 December | 08:00

06 November - 03 December

Webinar | Top 5 Power BI Reports for Fintech Project Management

Webinar | Top 5 Power BI Reports for Fintech Project Management

09 December | 11:00

06 November - 03 December

Dataset

Get the dataset

Share the challenge

About challenge
How to participate
The Brief
Judging criteria
Timeline
Dataset
My license
Mentoring

About FP20 Analytics ZoomCharts Data Challenge

🏆 Main Prize: $300 Amazon Gift Card

Want to learn to build PRO reports? With personalized feedback and informative workshops, this is your opportunity to take your report-building skills to the next level, build your professional portfolio, and network with like-minded people.

The ZoomCharts challenge is hosted in partnership with FP20 Analytics – a group that unites passionate and inspiring data enthusiasts, and helps new data analysts improve their skills and build a competitive portfolio. Join in and sharpen your skills together with this open and friendly data community. Read more about the challenges on the FP20 Analytics website. Join the community on LinkedIn.

Why join the FP20 Analytics ZoomCharts Challenge?

  1. Workshops & 1:1 Mentoring: Learn directly from experienced Power BI professionals through live workshops on report-building best practices, 1:1 mentoring sessions to review your report and get tailored advice.
  2. Get Personal Feedback: Every participant receives detailed, personalized feedback on their report - a great opportunity to improve based on real input from seasoned analysts.
  3. Free ZoomCharts PRO License: All participants get a ZoomCharts Developer License (worth hundreds of dollars) that gives full access to the Drill Down PRO visuals library.

🏆 Prize: 

The best overall report using ZoomCharts visuals will win a $300 Amazon gift card. The ZoomCharts winner will be announced in a special live webinar session on December 9, where we will review the Top 5 entries from the challenge.

Webinars

Learn more about ZoomCharts visuals & gain a knowledge advantage in the contest by joining the upcoming webinars! You'll also get the chance to your ask questions and get expert answers in the Q&A section.

Upcoming webinars

Recording thumbnail

Create Fintech Project Management Power BI Report

13th November, 2025

08:00 AM - EST

In this live workshop, we’ll guide you through preparing the Fintech Project Management dataset and building an interactive Power BI dashboard to track project performance, resources, and costs step by step.

Learn more
Recording thumbnail

Top 5 Power BI Reports for Fintech Project Management

9th December, 2025

11:00 AM - EST

Join us to explore the top 5 Power BI reports that reveal how data can improve project management efficiency across fintech product development.

Learn more

How to participate in FP20 Analytics & ZoomCharts challenge?

1. Register for the challenge: 

  • Register for the FP20 Analytics ZoomCharts Challenge using the form on this page.
  • Download the challenge dataset on this page. You can find the “Get the Dataset” button on the left side of the page. Read the challenge brief (see “The Brief” section) for additional information about the dataset and its use
  • Activate your free Drill Down Visuals Developer License for Power BI. Read license setup video or read the instructions

2. Build your report in Power BI: 

  • Add ZoomCharts License to your Power BI Desktop. Read the full guide.
  • Add ZoomCharts visuals to your Power BI visualization pane from the Power BI visuals library or AppSource.
  • Use the dataset to build a Power BI report including at least 2 ZoomCharts Drill Down Visuals in one report page. 
  • The recommended number of pages in the report is up to 3 pages, including drill-through pages.
  • Canvas size is 16:9 (Default Power BI size) or Full HD size = w:1920 - h:1080 

3. Improve your report and learn new skills: 

  • To learn more about applying ZoomCharts visuals in your reports, participate in the challenge workshop. 
  • If you have any questions or need advice, you can book a free individual consultation. 
  • Check out the submissions from past challenges for inspiration. 

4. Submit your challenge entry:

  • Log in to your account on this challenge page and submit your report in .pbix format for validation.

If your submission doesn’t match the challenge criteria, you will be notified by email indicating the reason. Don't worry if this happens! You can fix the issue and resubmit your report.

  • Your report will be reviewed within 1–2 business days. Once it’s validated, you’ll receive a Publish to Web link via email. You can use this link to add the report to your portfolio or share it publicly online.
  • All validated entries will also receive personalized feedback from the evaluation team via email within 1-2 business days. Use this feedback to revise your report and resubmit it before the deadline.

Note: Feel free to resubmit your entry as many times as necessary before the deadline.

5. Finalize your participation to compete for the ZoomCharts grand prize: 

  • Post the final version of your submission in PDF format on your LinkedIn profile. 
  • Use the caption "I am participating in FP20 Analytics ZoomCharts Challenge 31". 
  • Include a summary of your report's key insights and add the ZoomCharts publish to web link (if available).
  • Use #FP20Analytics, #builtwithzoomcharts, tag @Federico Pastor and @Zoomcharts.
  • Additionally, post your report in the FP20 Analytics LinkedIn Community group. 
  • Follow ZoomCharts on LinkedIn

6. Attend the challenge closing webinar:

  • The submissions are evaluated by ZoomCharts team (see "Judging criteria" for more info). The submissions of Top 5 ZoomCharts Challenge finalists are analyzed live during the challenge closing webinar to share the best practices and learning opportunities with the community. 
  • The author of the best report is awarded a $300 Amazon gift card.

Technical requirements

  • Build your report using Power BI
  • The recommended number of pages in the report is up to 3 pages, including drill-through pages.
  • Canvas size is 16:9 (Default Power BI size) or Full HD size = w:1920 - h:1080 
  • The report should contain at least 2 ZoomCharts Drill Down visuals within a single page. See a practical guide for using Drill Down PRO visuals.

The Brief 

Fintech Project Management Data Challenge

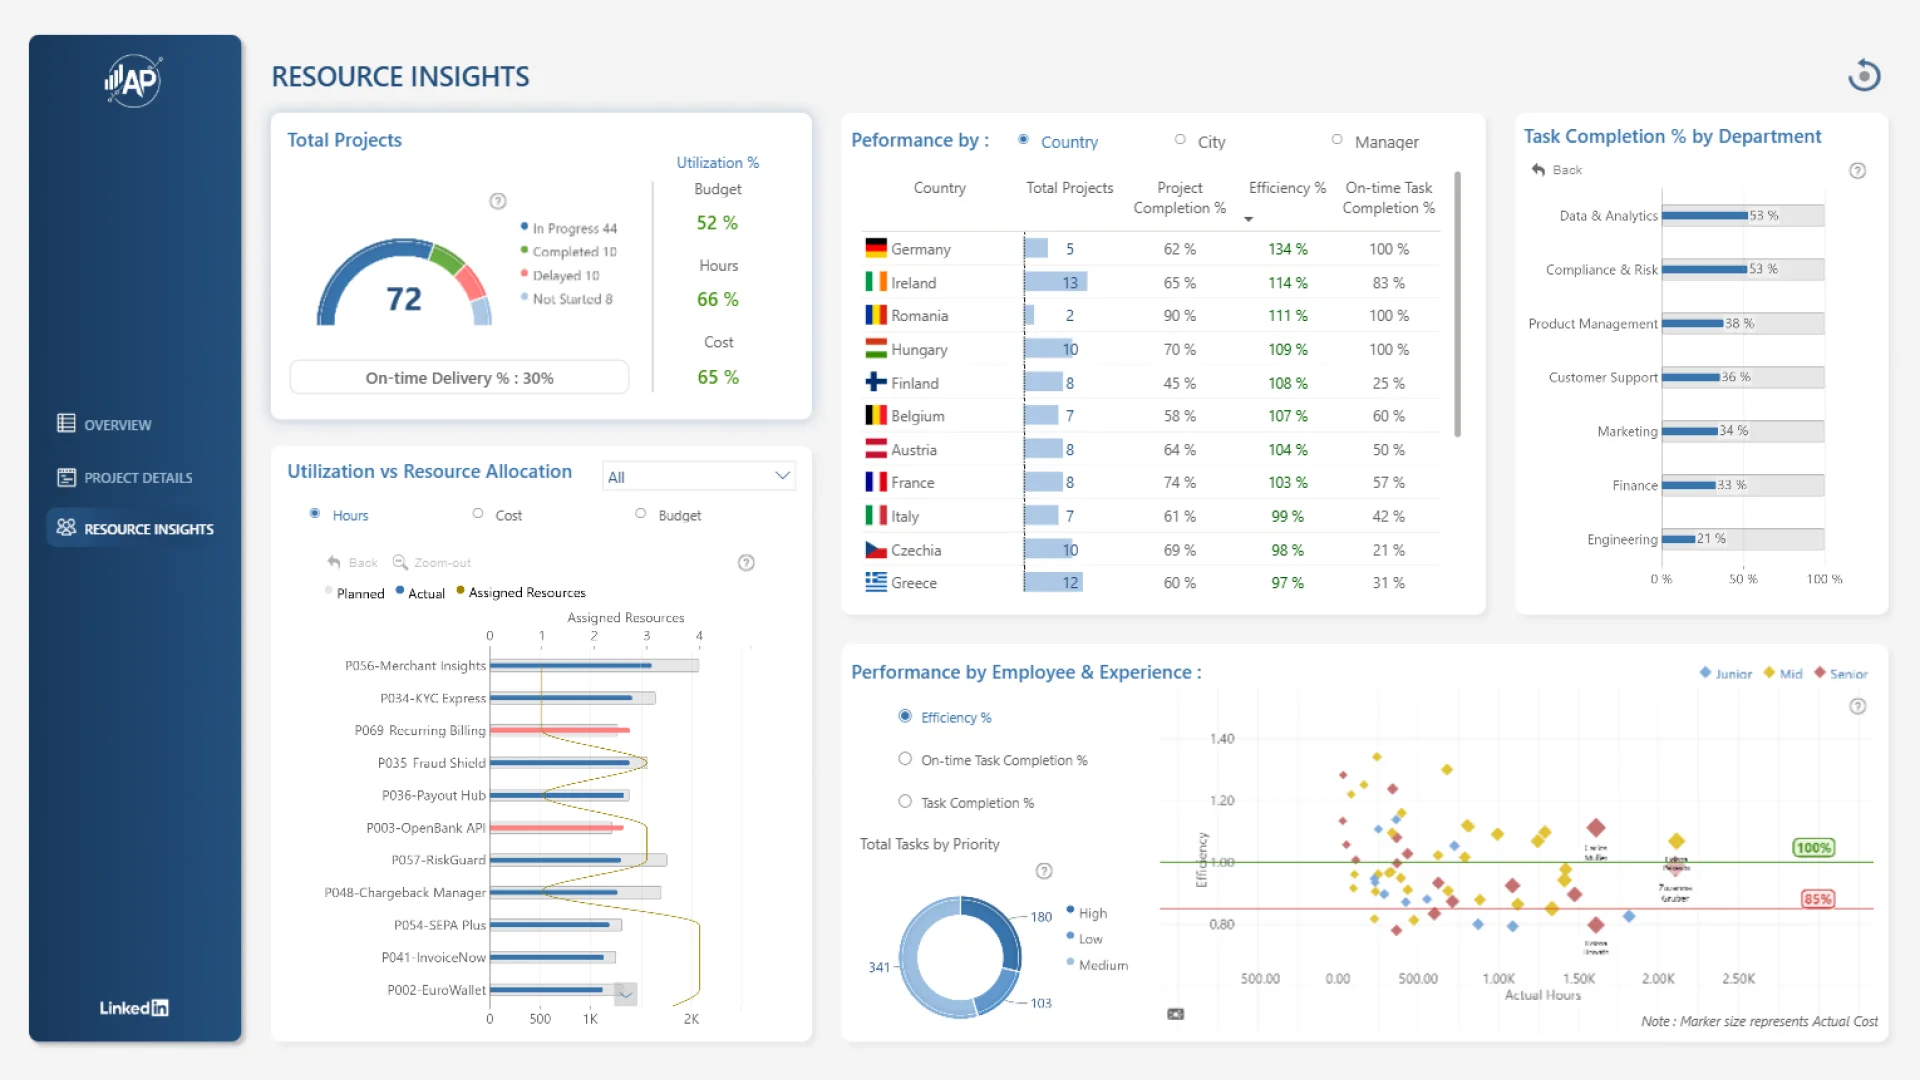
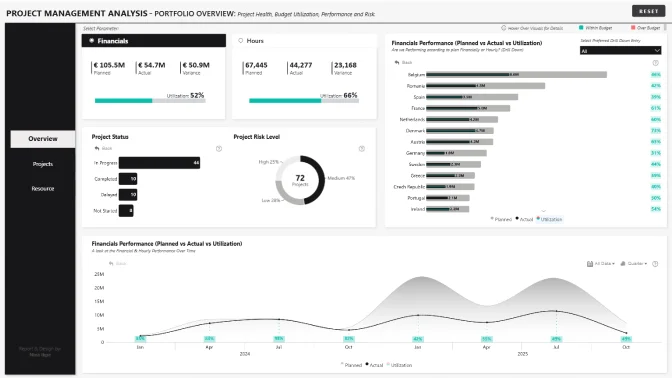
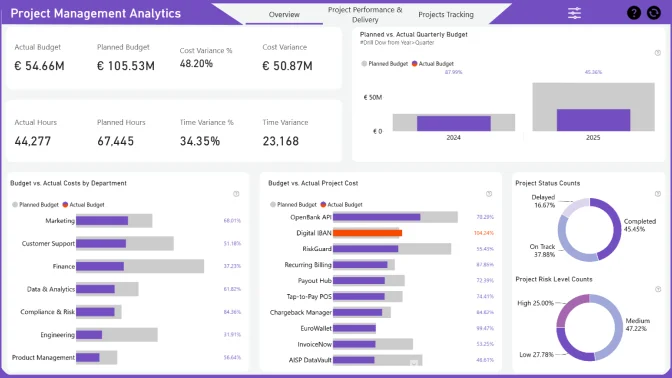
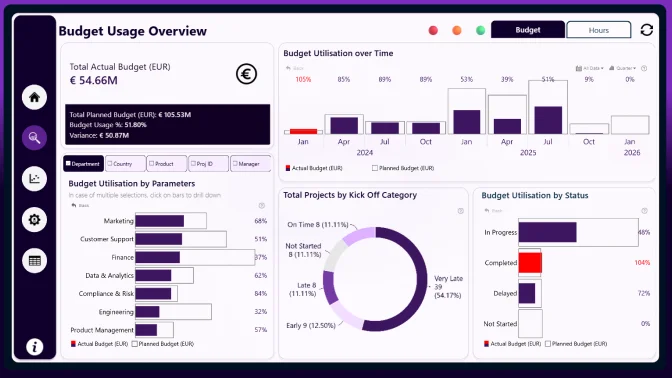
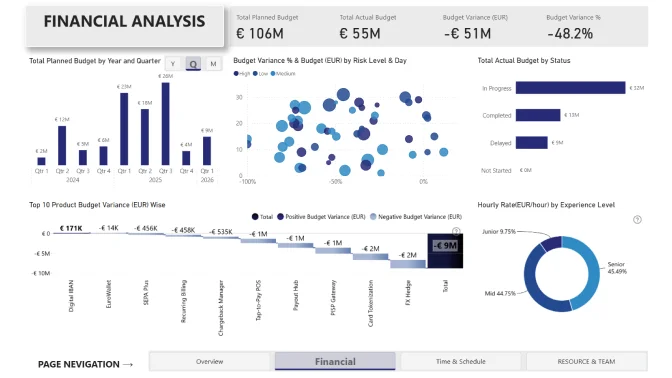
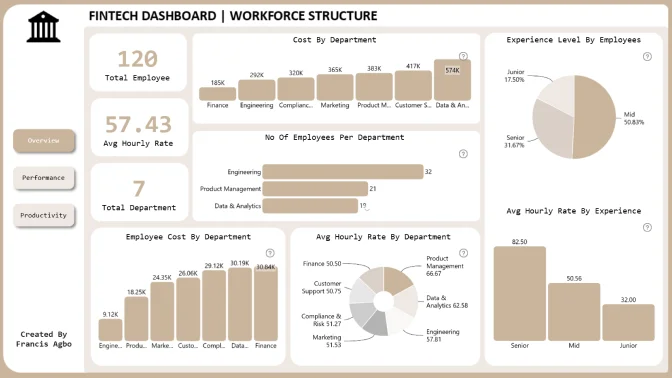
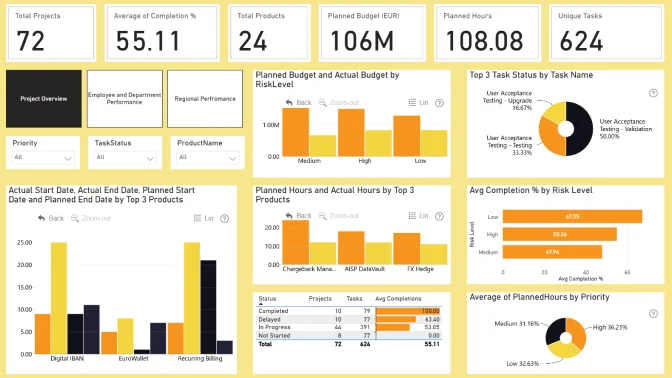
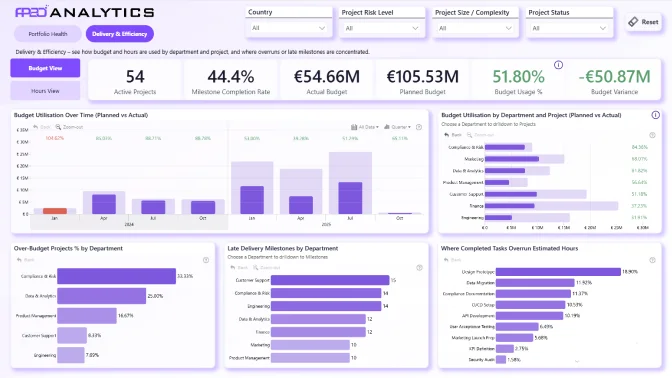
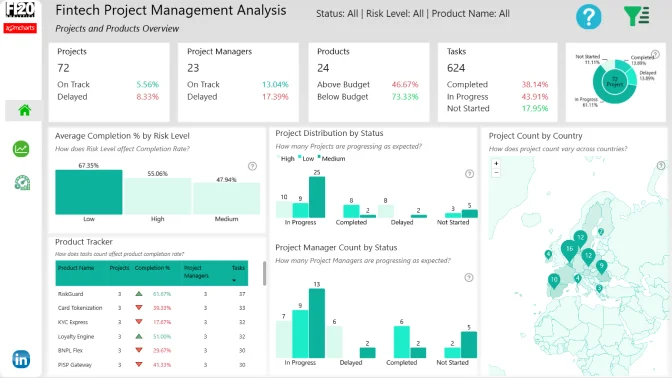
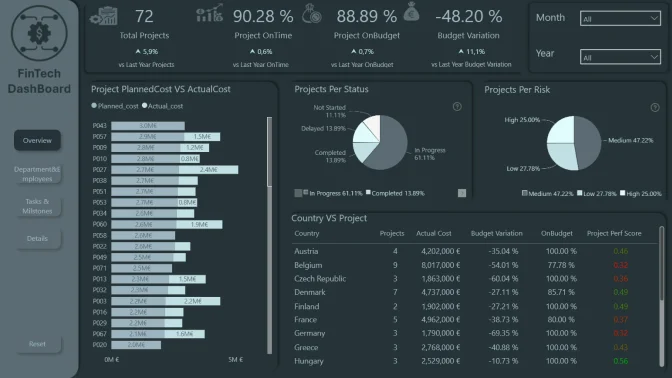
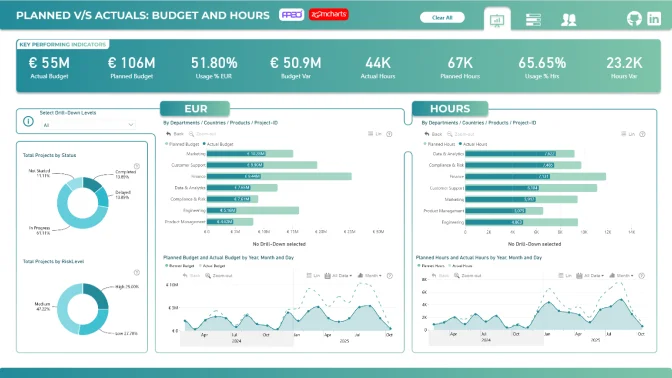
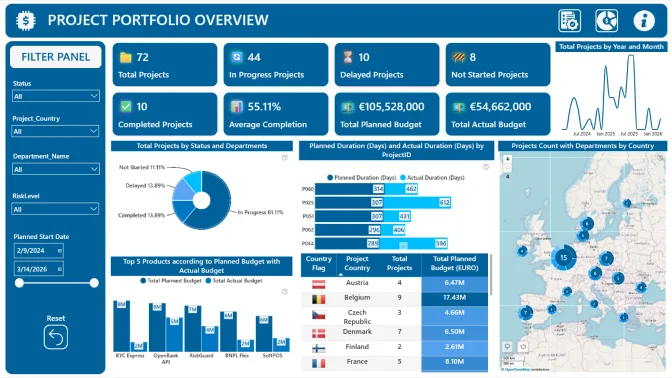
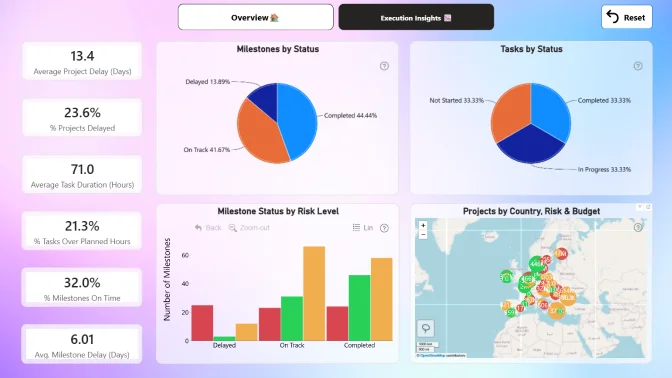
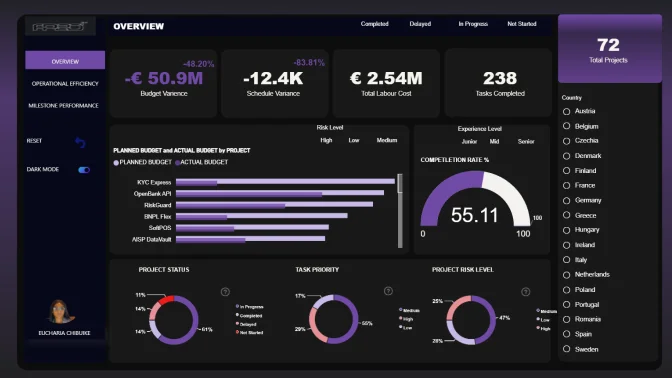
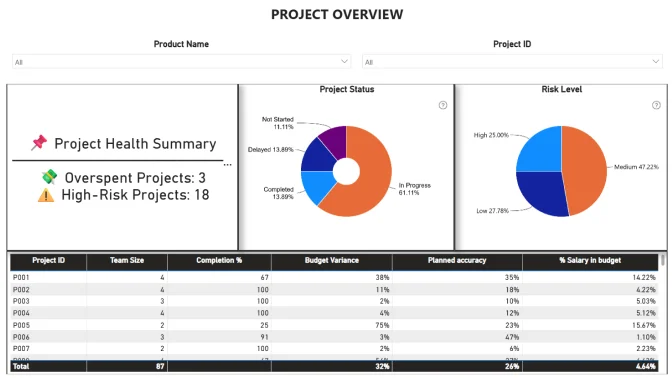
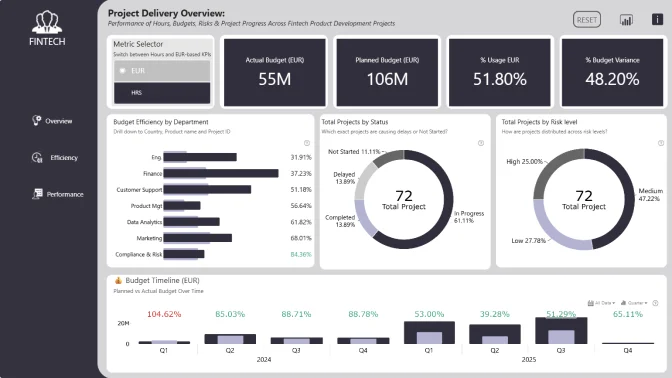
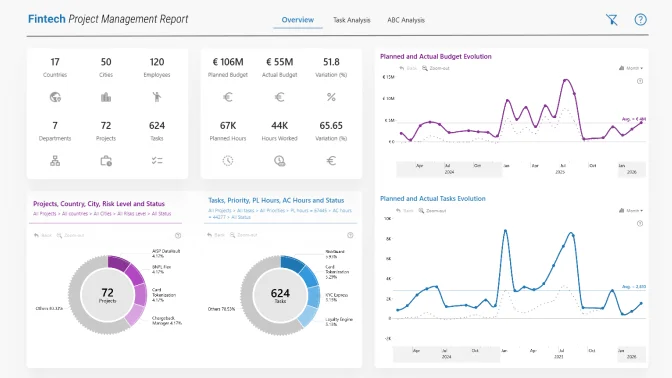
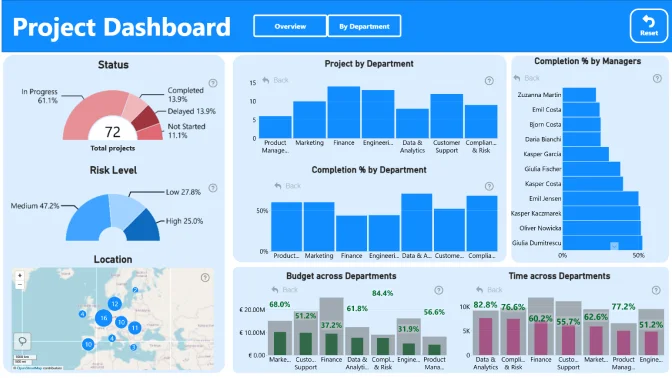
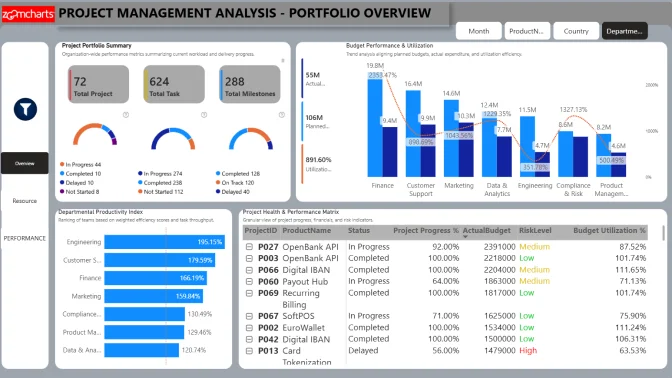
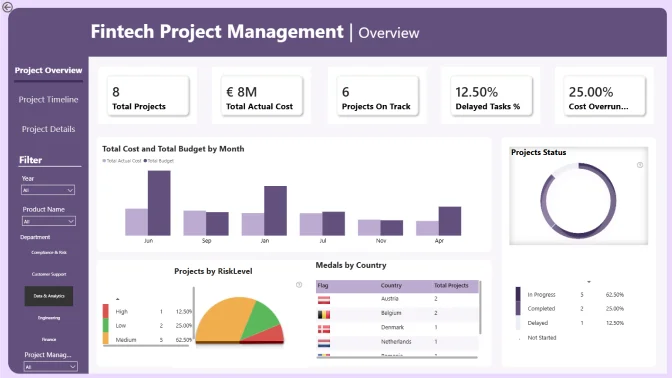
In this data challenge, you will work with a Fintech Project Management Dataset from a company that develops and delivers innovative payment solutions across Europe. The dataset captures how product development projects (such as digital wallets, tap-to-pay systems, and online payment APIs) are planned, executed, and monitored.

It includes information about projects, tasks, employees, departments, and milestones, showing how time, cost, and resources are managed throughout the fintech product development lifecycle.

Your goal is to analyze this data to identify insights that improve project delivery efficiency, resource allocation, and overall performance in payment solution development.

Use Case & Main Goal

Fintech companies often manage multiple projects at the same time, each with different goals, budgets, and deadlines. The main challenge is understanding how data can help manage these projects more effectively and ensure payment products are delivered on time and within budget.

In this challenge, you will use the dataset to:

  • Track project progress, budgets, and completion rates.
  • Compare planned versus actual hours and costs.
  • Identify departments or regions that perform most efficiently.
  • Understand how experience level and hourly rates affect costs.
  • Detect workflow issues such as frequent 'On Hold' or 'Review Required' tasks.

Your findings will support better planning, cost management, and resource optimization across fintech product development projects.

Questions to Explore (Optional)

  • Which projects are progressing as planned, and which are at risk of delay or overspending?
  • How do project duration, milestone completion, and task efficiency relate to success?
  • How do hourly rates and experience levels influence project cost and speed?
  • Are some departments or cities more consistent in meeting deadlines?
  • What task statuses or phases most often cause delays or rework?
  • Can early project data help predict delays or budget issues?

Your Mission

Use Power BI and ZoomCharts visuals to:

  • Build data models connecting data tables
  • Create performance metrics and KPIs.
  • Design dashboards that highlight project success and improvement opportunities.

Judging criteria

Business users use reports to make data-driven decisions. That’s why reports are called effective if they enable users to drill down and filter data quickly and intuitively to find answers to any question they might have, and analyse data in all possible directions and dimensions.

Each report is evaluated based on three main criteria: intuitiveness, insightfulness, and interactivity. These factors ensure that the reports are not only accurate and functional, but also meet the target audience's needs and are ready to be presented to the end-users. 


  1. Intuitive: How clear and easy it is to understand the report at a glance? (max 15 points)
    • Is the report visually appealing?
    • Choice of charts and visual elements
    • Does the report tell a story?
    • Is it not overwhelming to the user?
    • Choice of tooltips, titles, and legends

  2. Interactive: How engaging and seamless is the report exploration and interaction with data? (max 15 points)
    • Clear navigation that allows user to explore the report
    • Use of slicers and other interactive elements
    • Smooth cross-chart integration
    • Is report optimized for touch devices?
    • Are tutorials and guiding elements helpful to the user?

  3. Insightful: How accurate, complete, and meaningful is the data in driving decisions? (max 15 points)
    • Depth of analysis
    • Data cleaning and preparation
    • Does data show up accurately in the report?
    • Is report optimized for quicker loading time?
    • Does the report provide deeper exploration of data (drill-down)?

Timeline

Registration Open

Registration Open

06 November | 03:00

-

Submissions Open

Submissions Open

06 November | 03:00

-

Workshop | Create Fintech Project Management Power BI Report

Workshop | Create Fintech Project Management Power BI Report

13 November | 08:00

-

1:1 Mentoring Sessions

1:1 Mentoring Sessions

13 November | 08:00

06 November - 03 December

Entry Submission Deadline

Entry Submission Deadline

03 December | 16:59

06 November - 03 December

Winner Announced

Winner Announced

09 December | 08:00

06 November - 03 December

Webinar | Top 5 Power BI Reports for Fintech Project Management

Webinar | Top 5 Power BI Reports for Fintech Project Management

09 December | 11:00

06 November - 03 December

Dataset

Get the dataset

My license

1:1 mentoring sessions

You can book a personal session with Senior Product Expert at ZoomCharts, Aivis Pavlovs, to gain practical knowledge about Drill Down Visuals and how they can be used to enhance data storytelling in a report.

Book a meeting

Your Drill Down Visuals Developers License

Use the email and password provided below to log in Power BI Desktop and access an account with a license to use all ZoomCharts Drill Down Visuals.

Upon logging in, you will need to change your password and enable two-factor authentication. If you encounter any problems, feel free to reach out to us via chat. For more information click here.

*This Developer License can be used to create a report for this ZoomCharts Mini Challenge or for your personal training purposes. Commercial use of this license is prohibited.

Submit your report to the FP20 Analytics ZoomCharts Challenge!

Enter your submission by attaching the Power BI report file. Your report will be published on the web, and we will e-mail you a link to your report that you can share publicly.

Upload failed
Attach file
File requirements: 16MB
warning If you are experiencing trouble with uploading your report, please send it in .pbix format along with all required information to [email protected]


Any questions? Reach out to us at [email protected]!

Are you sure you want to delete the report?

Activate your Drill Down visuals Developer License!

You can use these credential to access ZoomCharts visuals and create your report for this ZoomCharts Mini Challenge, or for your personal training purposes.


Invalid email address

Unfortunately, we couldn't reach the email address linked to this profile "". If you wish to receive news, feedback, and the Publish to Web link for your contest submissions, you'll need to create a new ZoomCharts account with a valid email address, or log into an existing account.

Switch account
logo
[email protected]
+44 204 577 3993
logo

Products

Drill Down Network PRO Drill Down Waterfall PRO Drill Down Graph PRO Drill Down Combo PRO Drill Down Combo Bar PRO Drill Down Donut PRO Drill Down Pie PRO Drill Down TimeSeries PRO Drill Down Timeline PRO Drill Down Map PRO Drill Down Scatter PRO All Visuals

Resources

Report Examples Webinars Blog ZoomCharts Academy Visuals Gallery Documentation Custom Visual Development Subscribe to News

Solutions

Custom Visual Development

Company

Pricing About Us Partners Leave feedback Join PowerGroup EU Funding

Help

ZoomCharts Assistance Contact Sales Contact Support FAQ

Drill Down Network PRO Drill Down Waterfall PRO Drill Down Graph PRO Drill Down Combo PRO Drill Down Combo Bar PRO Drill Down Donut PRO Drill Down Pie PRO Drill Down TimeSeries PRO Drill Down Timeline PRO Drill Down Map PRO Drill Down Scatter PRO All Visuals

Report Examples Webinars Blog ZoomCharts Academy Visuals Gallery Documentation Custom Visual Development Subscribe to News

Custom Visual Development

Pricing About Us Partners Leave feedback Join PowerGroup EU Funding

ZoomCharts Assistance Contact Sales Contact Support FAQ
+44 204 577 3993
[email protected]

Ready to get in touch?

Contact our experts with any question about Power BI and ZoomCharts for Free!

Contact us

© 2025, Data Visualization Software Lab

U.S. Patents No. 11,645,343; 11,921,804; 12,346,389

Cookies Policy
Manage cookies
Privacy Policy
Global
EULA
Patent
warning

Error message

success

Success info: Done!

ZoomCharts AI Assistant

We noticed you're using an old OS version.

For the best experience, we recommend upgrading to ensure that all website features display correctly.

Cookie settings

We use necessary cookies for site functionality, as well as statistic, marketing, and preference cookies to enhance your experience. For more information and to manage your preferences, please visit our Cookie policy