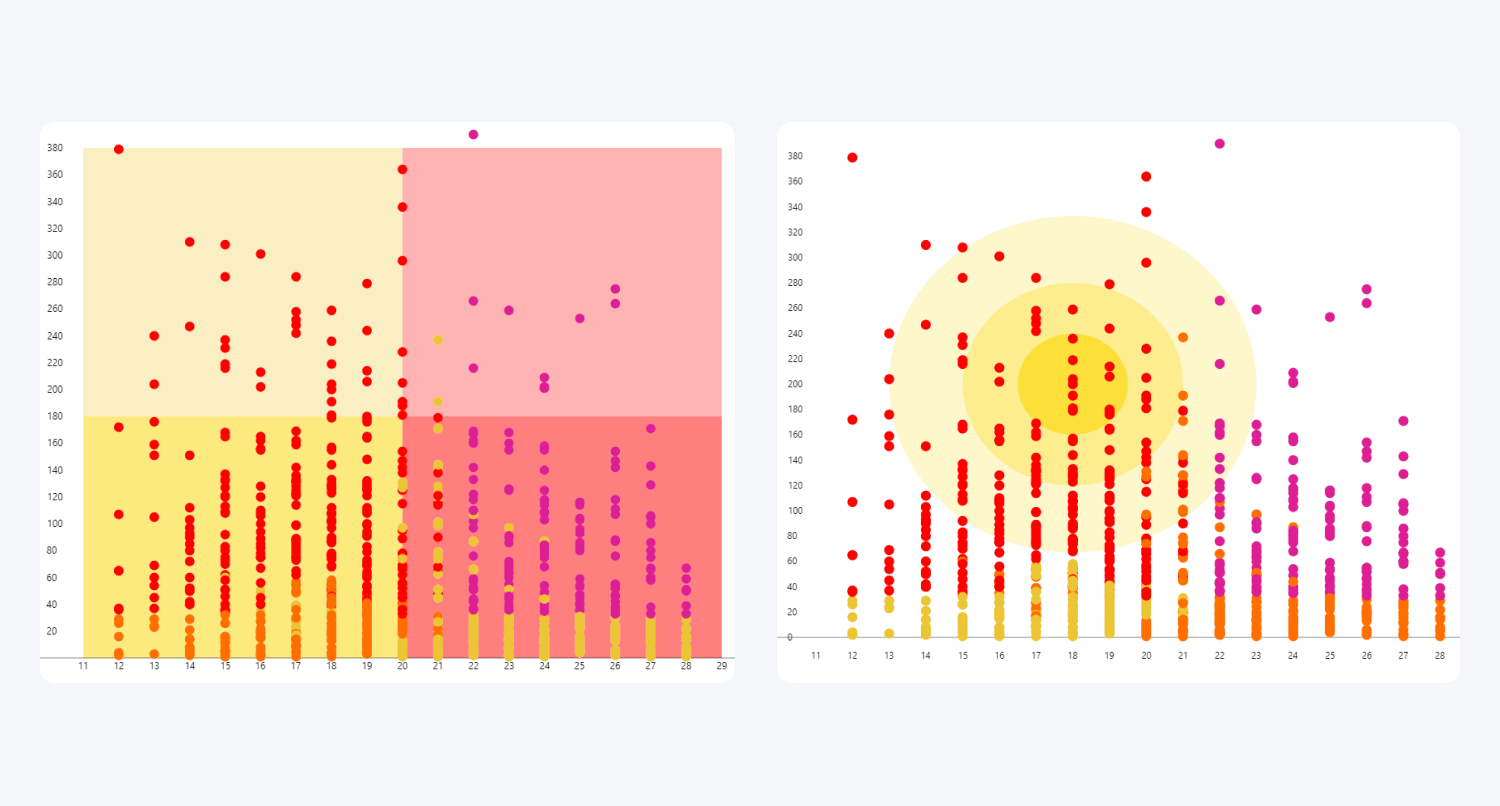
Use the Area Shading settings to highlight specific regions of the scatter chart with customizable shaded areas. You can use area shading to emphasize ranges, distinguish chart sections, or visually separate regions of the plot.
Drill Down Scatter PRO supports up to eight independently configurable areas. By default, no areas are enabled. Enable one or more areas in the Enabled Areas section, then select an area from the Apply Settings To list to customize it.
- Enabled Areas: choose which areas are displayed on the chart.
- General: configure the shape and position of the selected area.
- Style: customize the appearance of the selected area, including its fill and border.
Was this helpful? Thank you for your feedback!
Sorry about that.
How can we improve it?