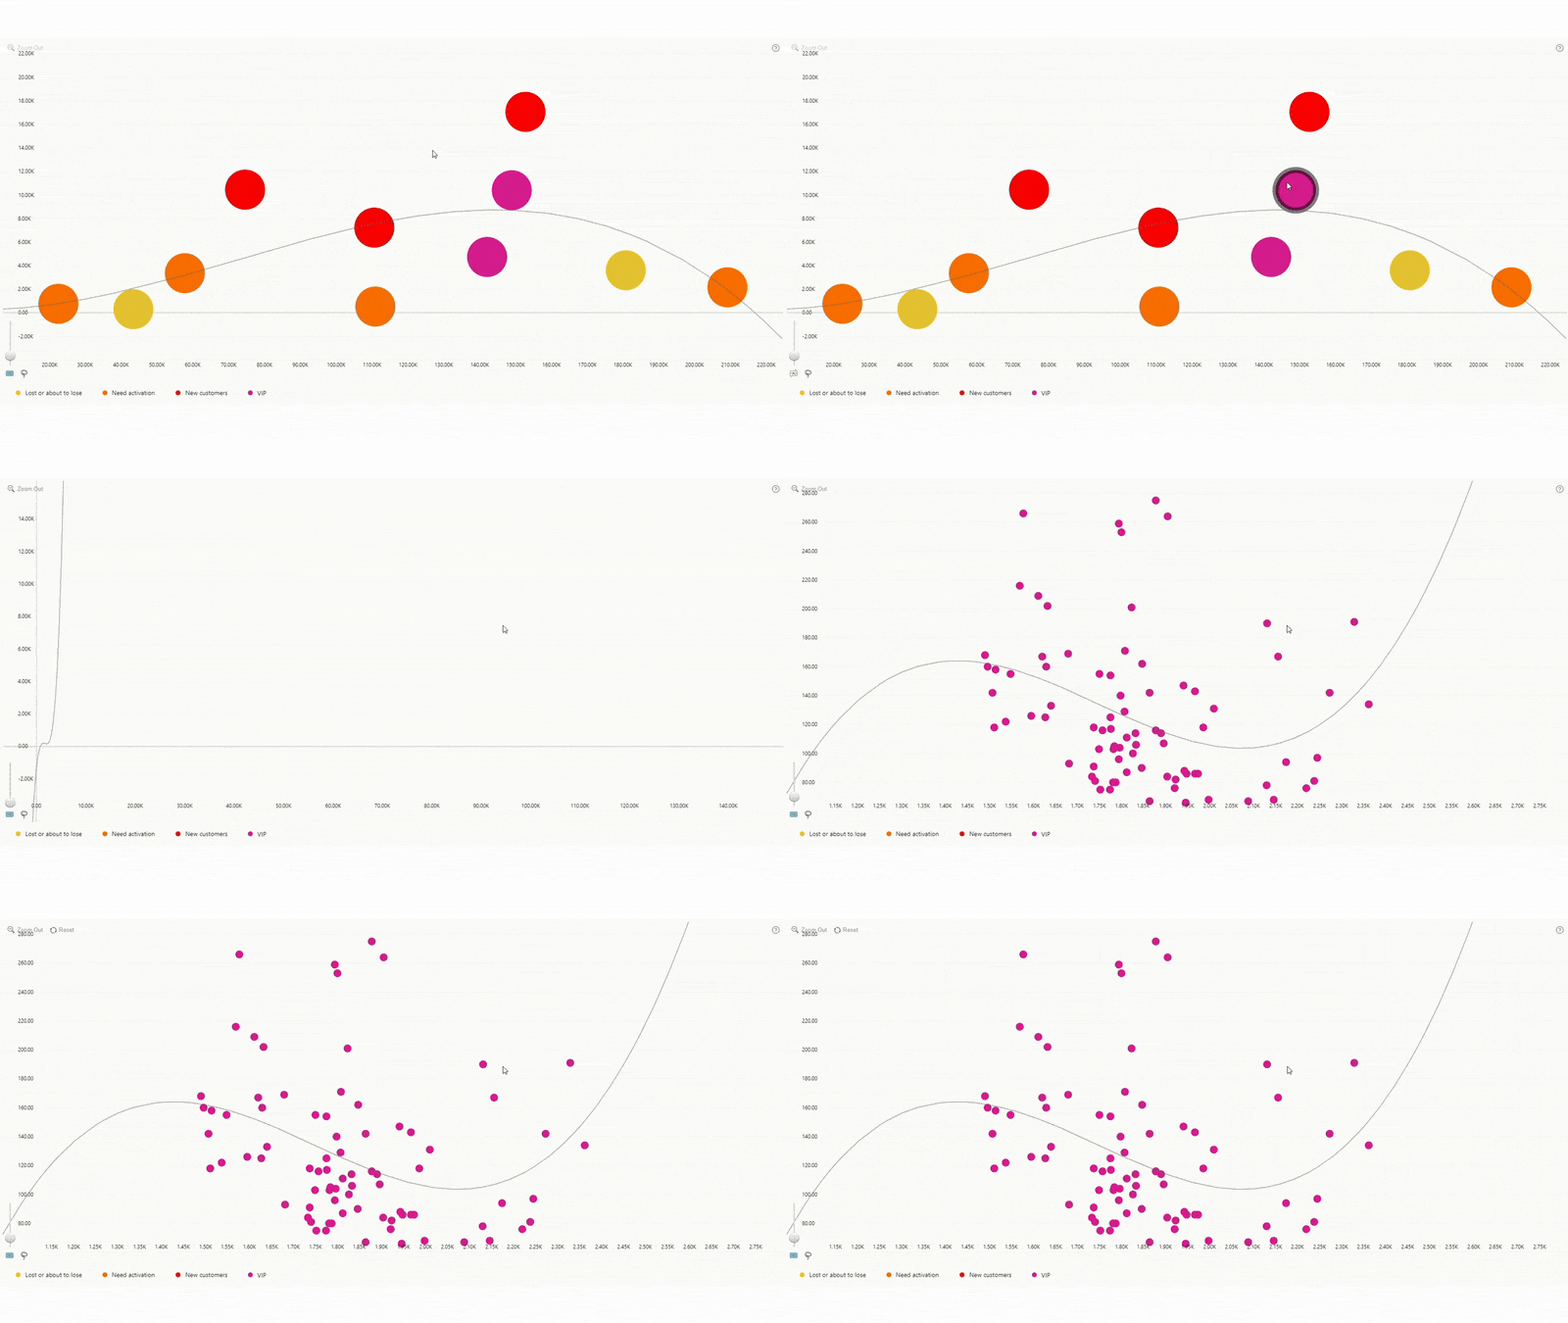
Multi-level Drill Down
With Drill Down Scatter PRO, you can create scatter charts
that feature multiple levels of drill down, allowing users to explore data in
closer detail with just a click or tap.
The visual plots data points from the X-Axis and Y-Axis
fields based on the category structure of the Categories field. You
can add multiple columns to the Categories field to create a drill down
hierarchy in your desired order.
This means that you can display an overview of your data in
the initial view, while providing the ability to drill down to a specific category
data point and reveal all the subcategories within. Combine clarity with
capability, all within the same visual!

Was this helpful? Thank you for your feedback!
Sorry about that.
How can we improve it?