830
ZoomCharts Christmas Analytics Challenge December 2024
ZoomCharts Christmas Analytics Challenge December 2024
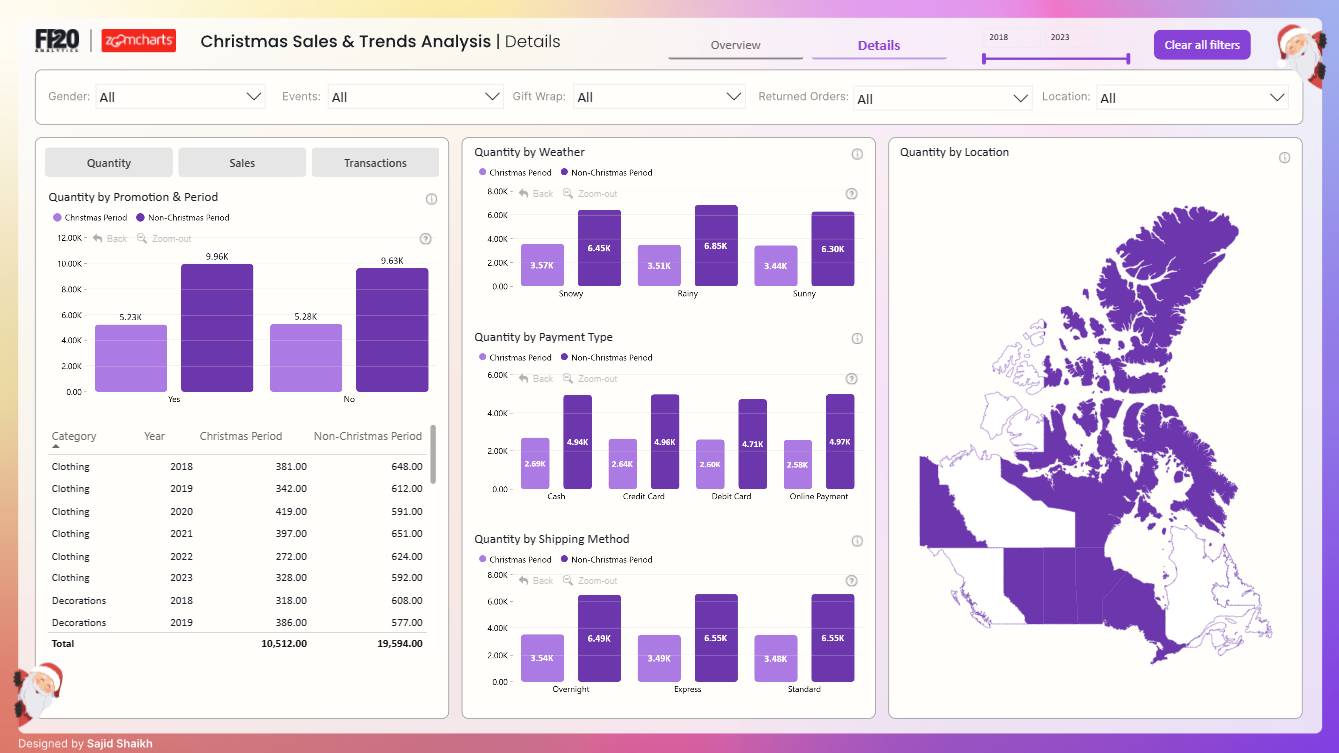
More Report pages
Report Author: Sajid Shaikh
830
Share template with others
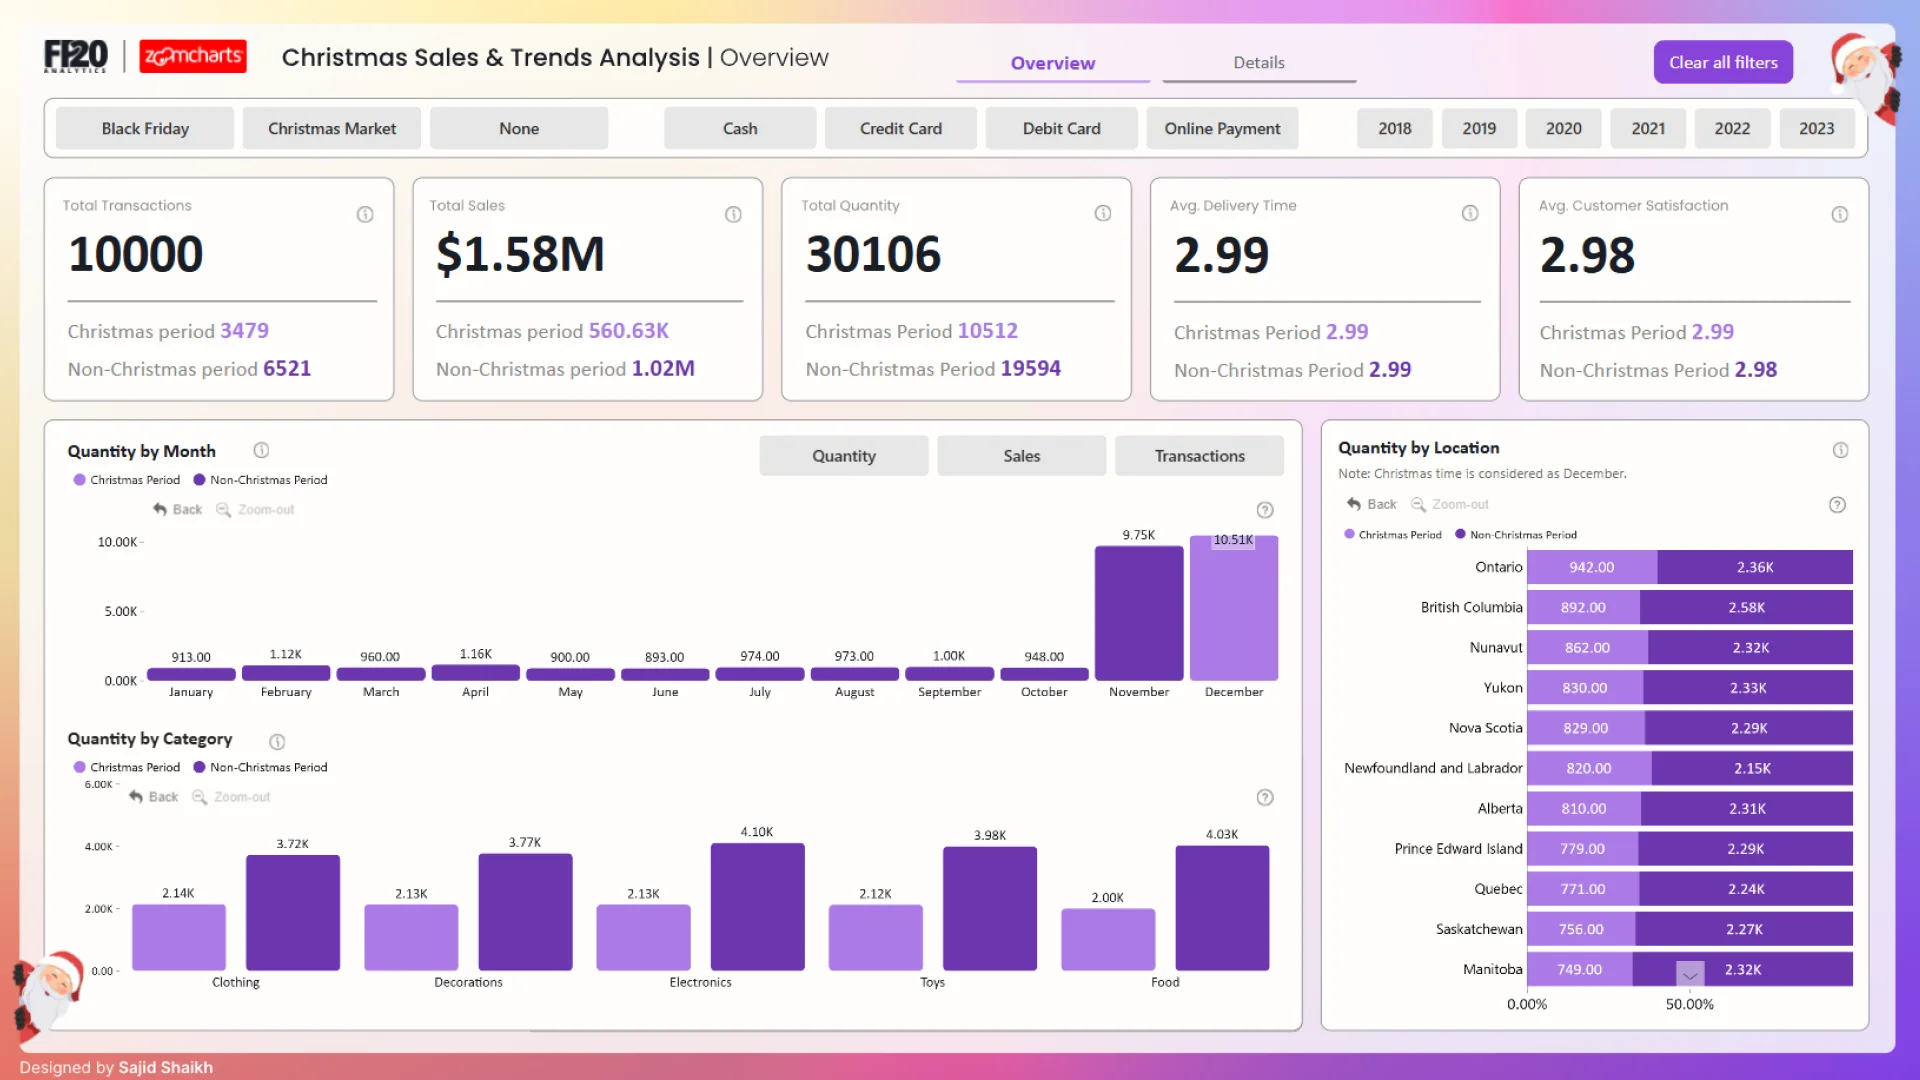
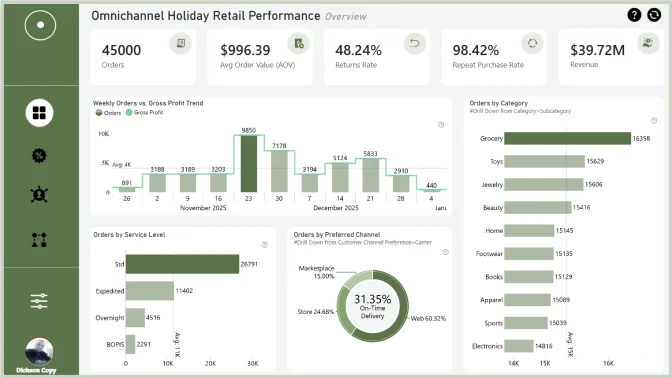
Report submitted for the FP20 Analytics ZoomCharts Challenge, December 2024. The report was built using the Christmas Sales & Trends Dataset and includes ZoomCharts custom Drill Down PRO visuals for Power BI.
Author's description:
The dashboard analyzes Christmas sales and trends, comparing metrics between the Christmas period (December) and non-Christmas periods. It includes key performance indicators such as total transactions, sales, quantity, average delivery time, and customer satisfaction. The visualizations highlight trends by month, product categories, and locations. Filters for payment methods, years, and events like Black Friday or Christmas Markets allow deeper insights. The design emphasizes clarity and seasonality, with notable peaks in sales and transactions during Christmas.


4U Report Challenges
Participate in data challenges, build and submit reports to get free template downloads.
Join CommunityMobile view allows you to interact with the report. To Download the template please switch to desktop view.
How to use a PBIX template
Preview the interactive report, download the PBIX file, open it in Power BI Desktop, and replace the same data connection with your own dataset.
Preview and download
Explore the report online and download the PBIX template file.
Open in Power BI Desktop
Open the downloaded PBIX file in Power BI Desktop.
Connect your data
Replace the sample data source with your own dataset.
Refresh and adjust
Refresh the model and update fields or visual were needed.
Save and share
Save your report and publish it for your audience.


