1007
Xmas Shopping Canada Dashboard
Xmas Shopping Canada Dashboard
More Report pages
Report Author: Norman Reynaldo Sabillon Castro
1007
Share template with others
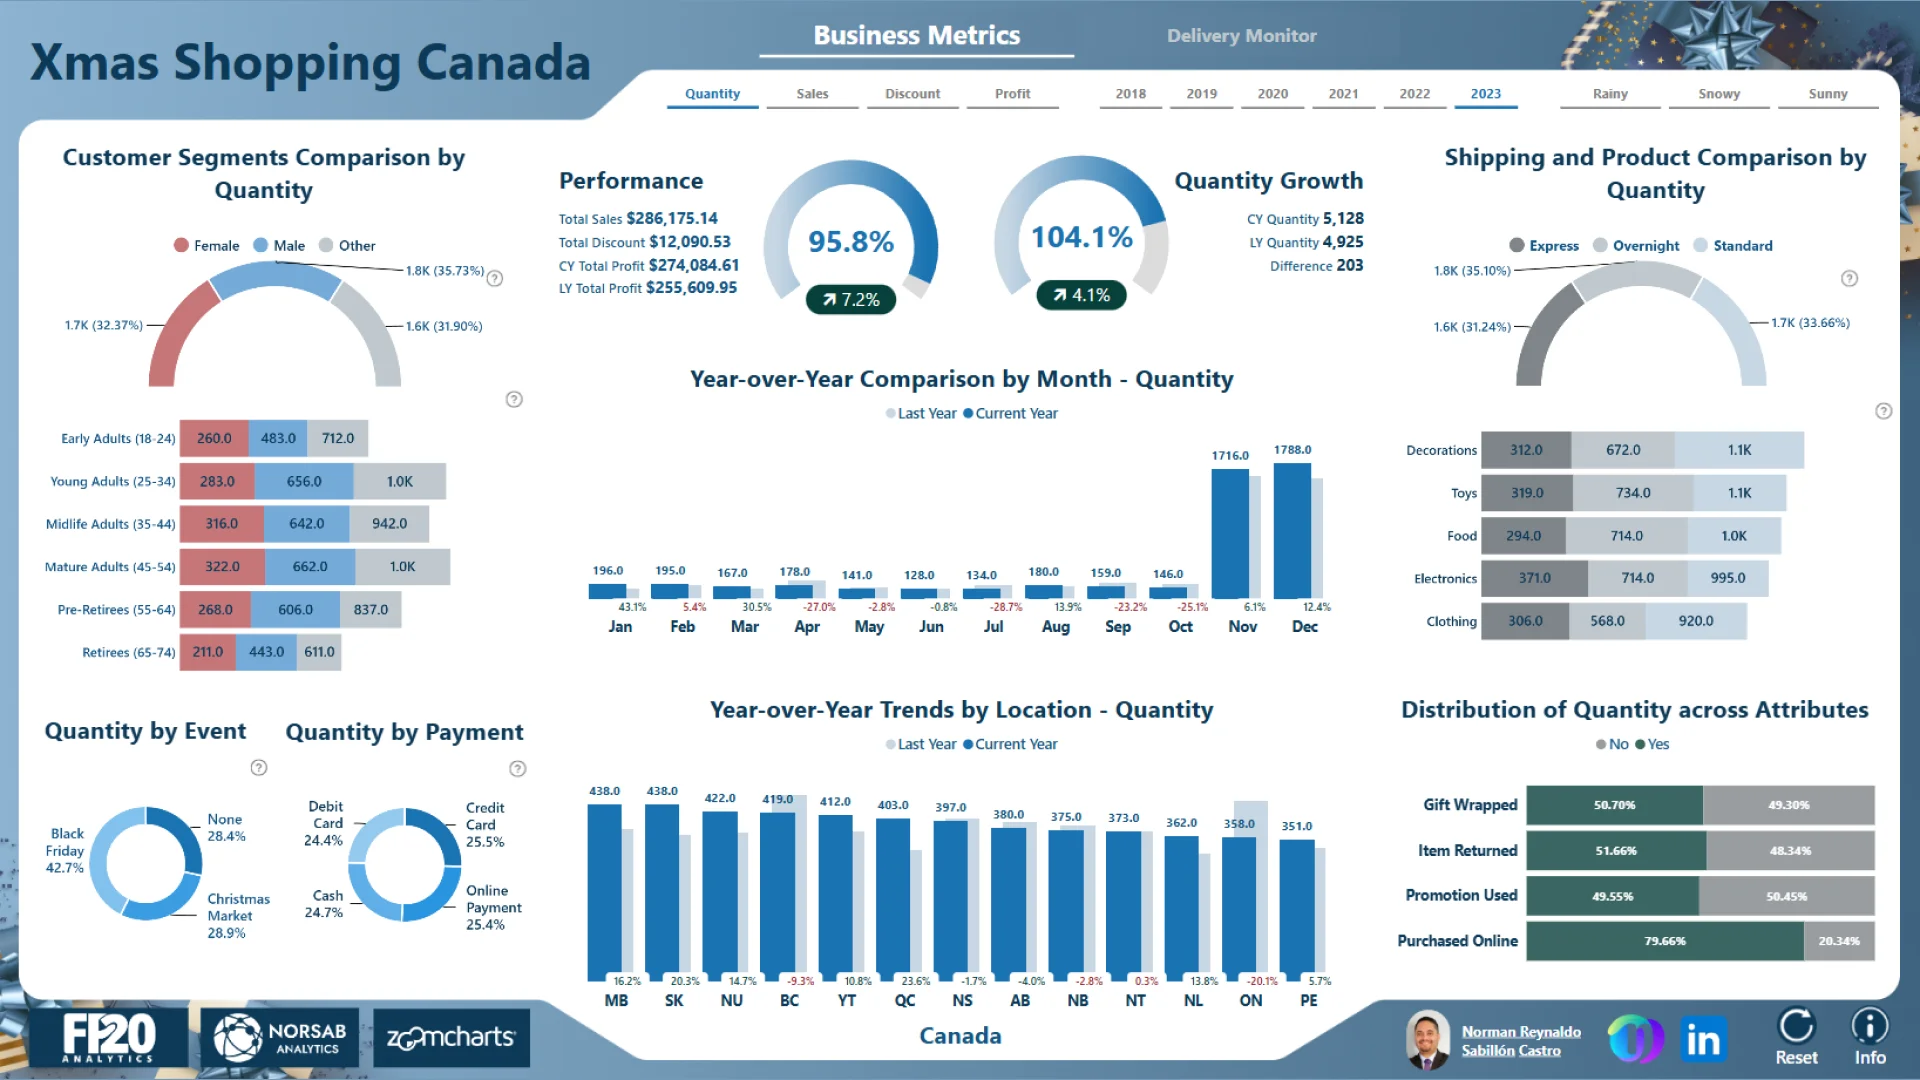
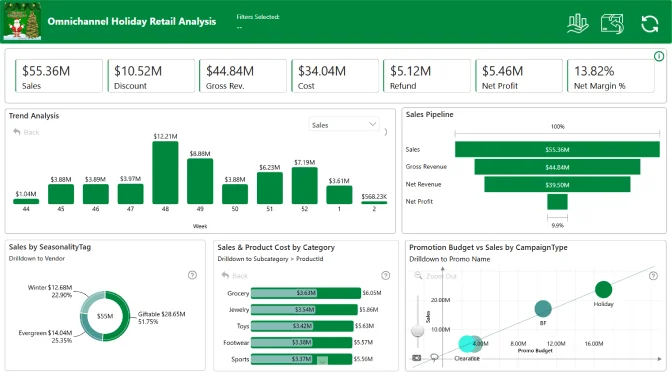
Report submitted for the FP20 Analytics ZoomCharts Challenge, December 2024. The report was built using the Christmas Sales & Trends Dataset and includes ZoomCharts custom Drill Down PRO visuals for Power BI.
Author's description:
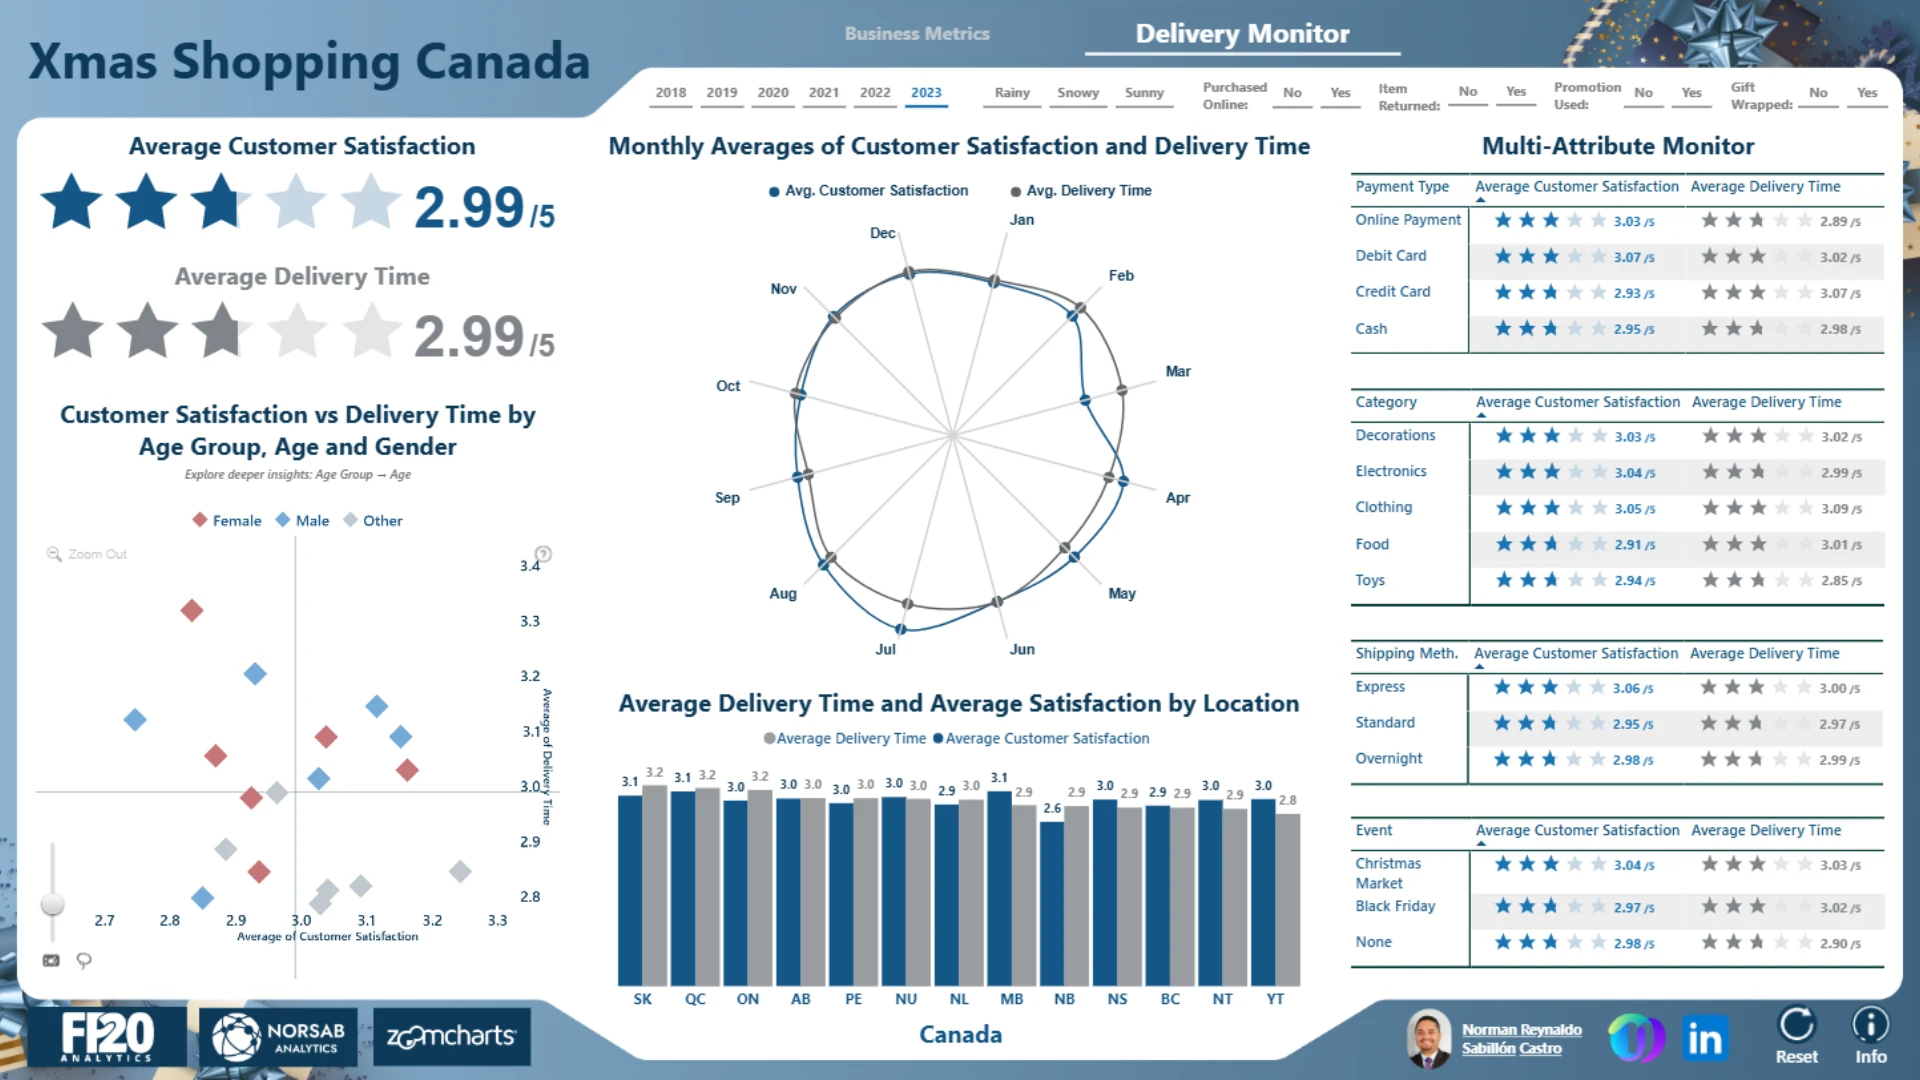
Welcome to the Xmas Shopping Canada Dashboard, designed to provide a comprehensive view of the holiday shopping landscape in Canada. This dashboard consists of two interactive pages: Page 1: Key Metrics Overview: Gain insights into essential metrics, including total sales, discounts applied, and profit margins. This page allows you to explore the overall performance of your holiday shopping campaigns with intuitive visuals. Page 2: Delivery Performance: Dive into delivery trends, including average delivery times and customer satisfaction levels. Monitor performance by region, identify potential bottlenecks, and ensure a seamless shopping experience for customers. This dashboard is your one-stop solution for analyzing the effectiveness of your holiday shopping efforts and enhancing your decision-making process.



4U Report Challenges
Participate in data challenges, build and submit reports to get free template downloads.
Join CommunityMobile view allows you to interact with the report. To Download the template please switch to desktop view.
How to use a PBIX template
Preview the interactive report, download the PBIX file, open it in Power BI Desktop, and replace the same data connection with your own dataset.
Preview and download
Explore the report online and download the PBIX template file.
Open in Power BI Desktop
Open the downloaded PBIX file in Power BI Desktop.
Connect your data
Replace the sample data source with your own dataset.
Refresh and adjust
Refresh the model and update fields or visual were needed.
Save and share
Save your report and publish it for your audience.


