646
World Roasters Review 2
World Roasters Review 2
Report Author: Iris Mejuto Crego
646
Share template with others
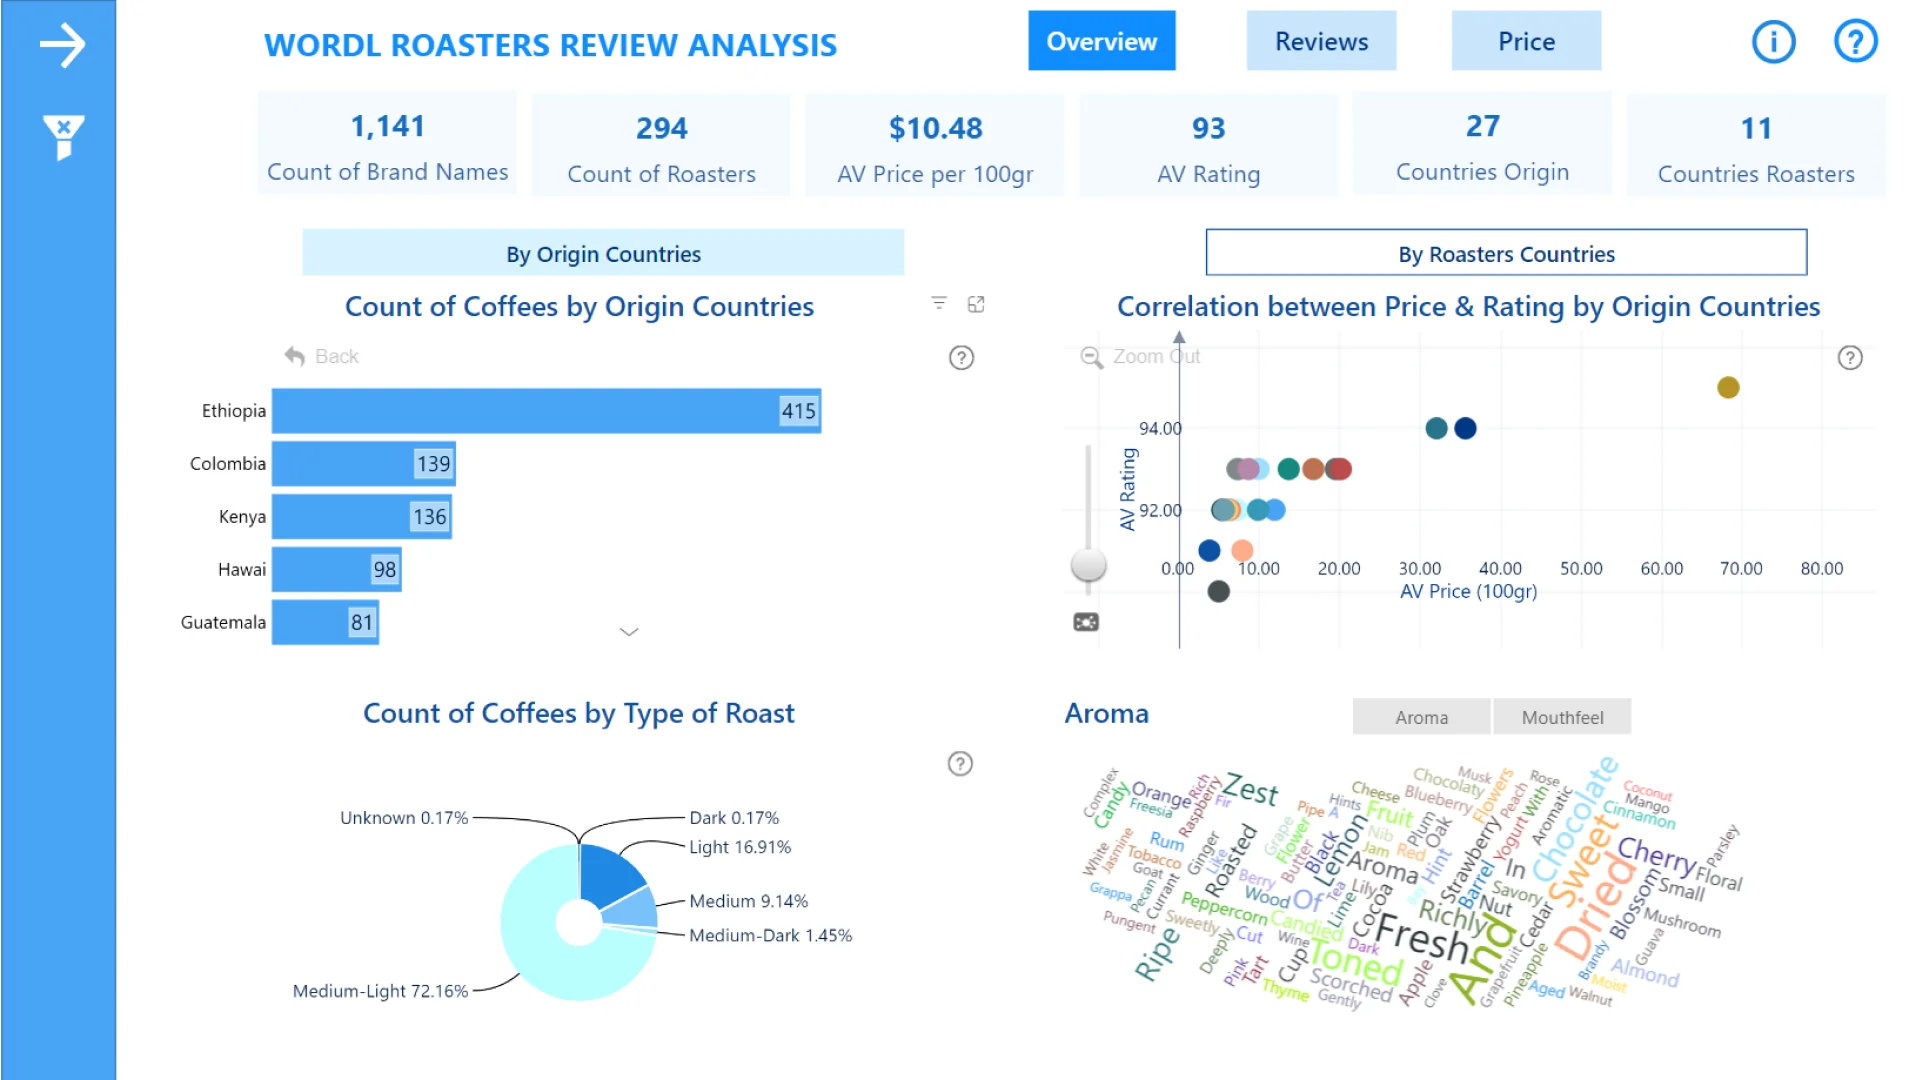
Report submitted for FP20 Analytics ZoomCharts Challenge 16 (May 2024). The report was built with the Coffee Roaster Dataset and includes ZoomCharts custom Drill Down PRO visuals for Power BI.
Author's description:
This Power BI dashboard analyzes coffee brand reviews, highlighting average ratings, prices, total reviews, trends by roast type, brand, and origin, as well as the geographical distribution of roasters and origins.
ZoomCharts visuals used
4U Report Challenges
Participate in data challenges, build and submit reports to get free template downloads.
Join CommunityMobile view allows you to interact with the report. To Download the template please switch to desktop view.

Was this helpful? Thank you for your feedback!
Sorry about that.
How can we improve it?