991
WorkForce In-Depth Analysis
WorkForce In-Depth Analysis
More Report pages
Report Author: Kunal Kaul
991
Share template with others
Report submitted for Onyx Data DataDNA ZoomCharts Mini Challenge, October 2024. The report was built based on Employee Performance dataset and includes ZoomCharts custom Drill Down PRO visuals for Power BI.
Author's description:
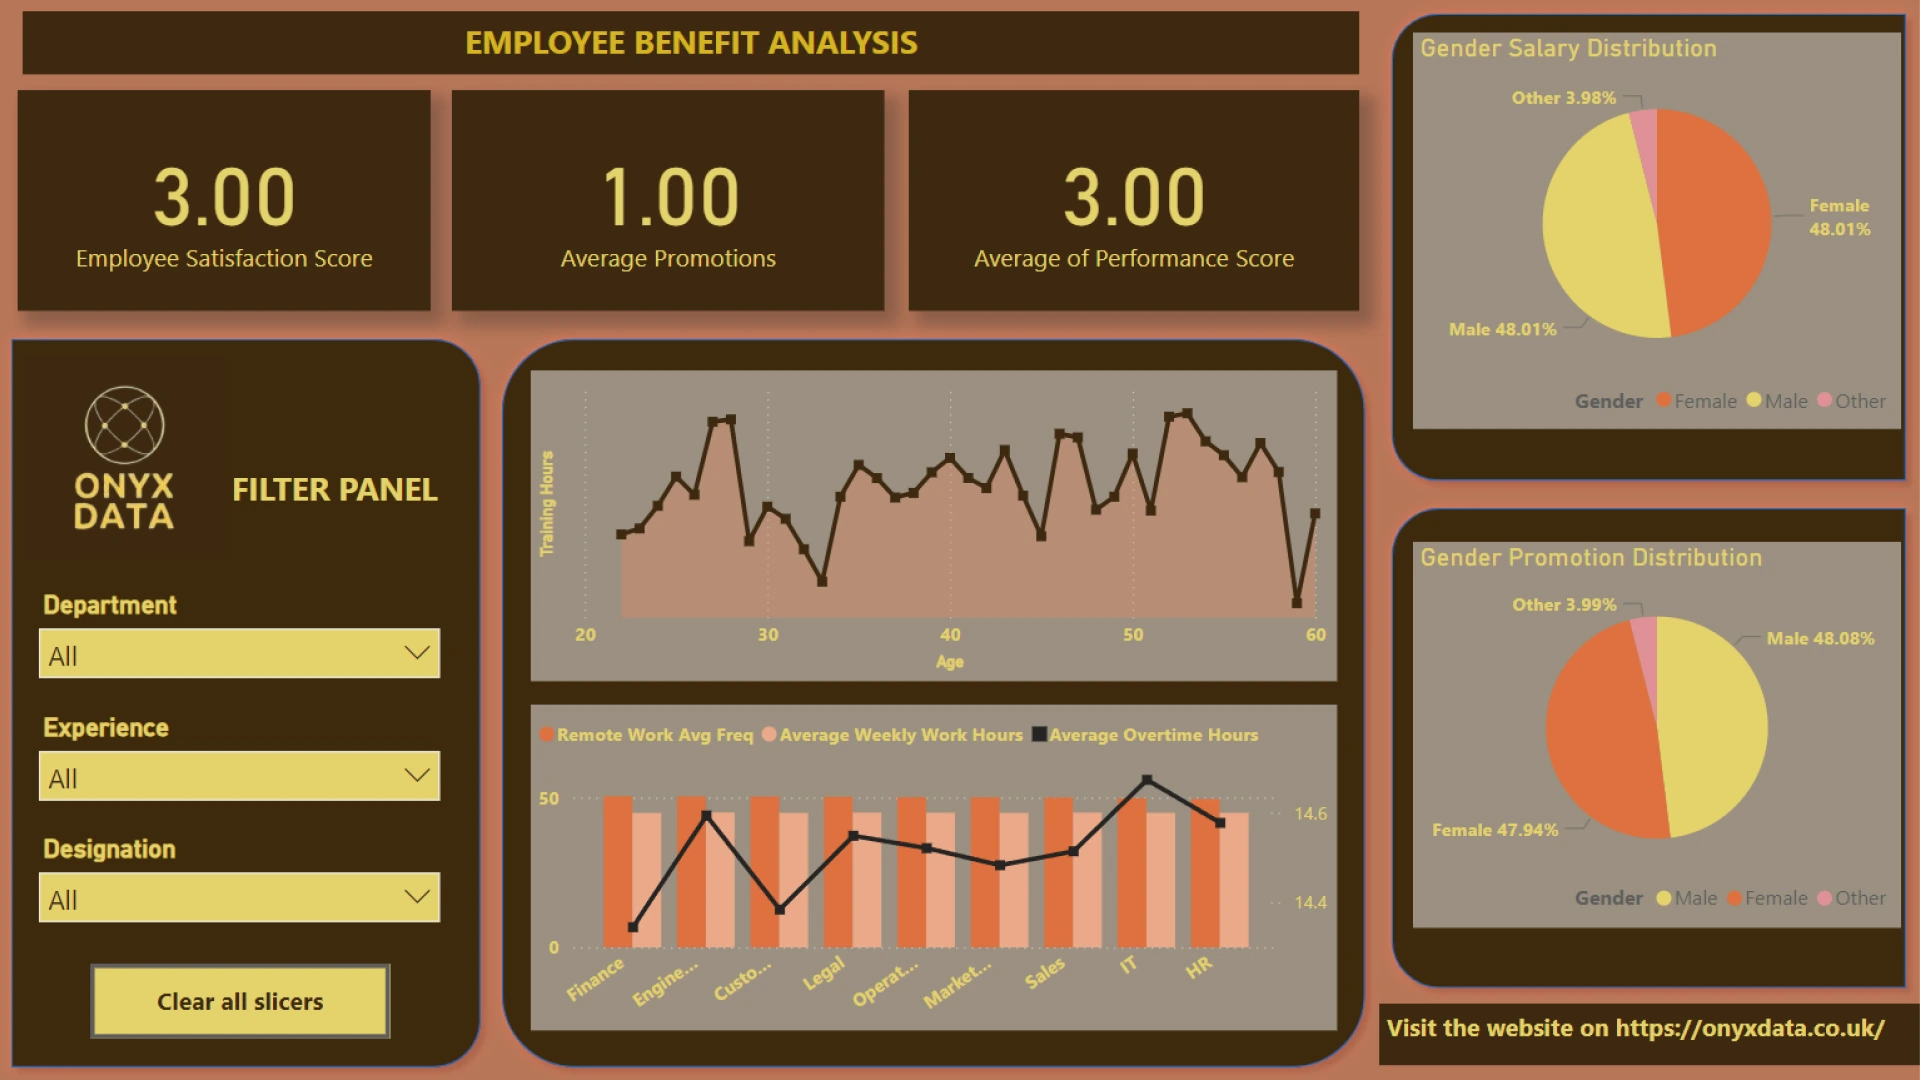
The dashboard has 4 pages: Each Page gives a different but related story from the provided dataset
1) Page 1 - Welcome page - It gives us an idea about the learning and financial benefit each employee recieves and company's diverse nature
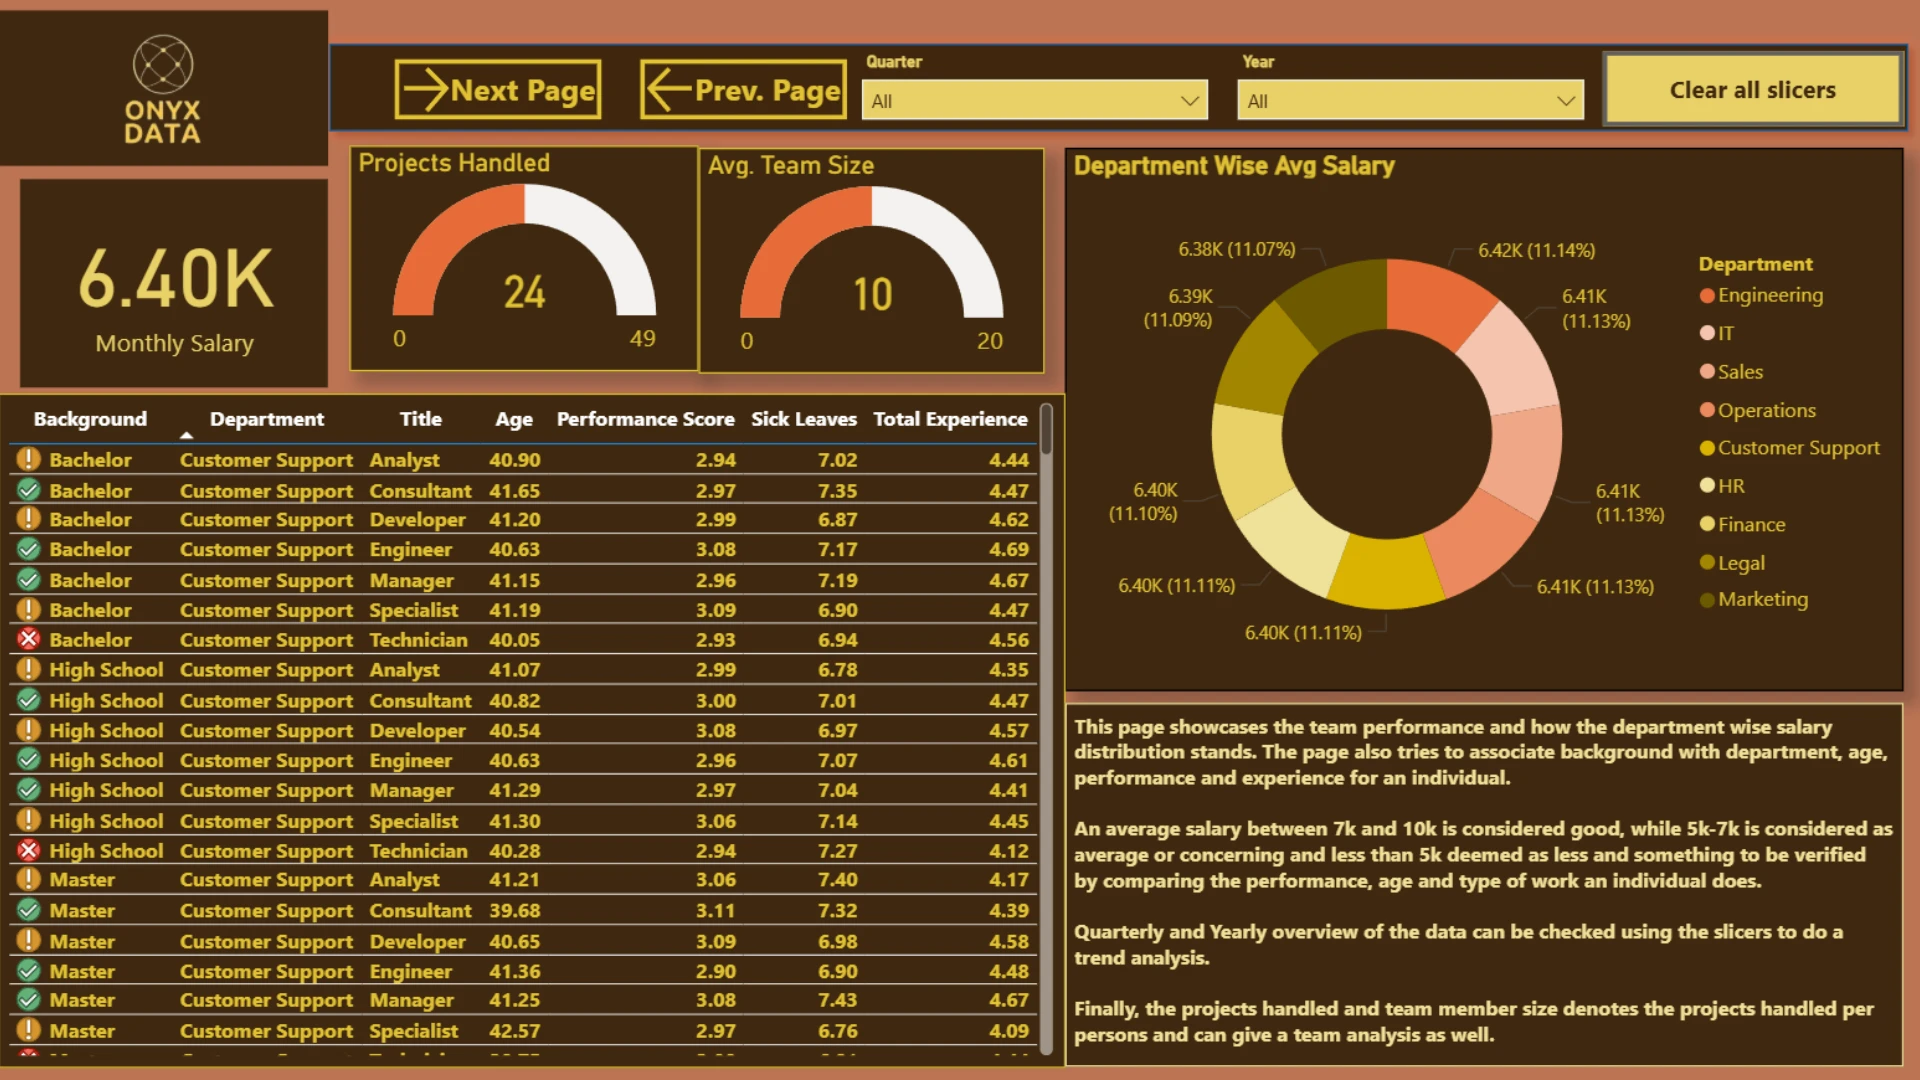
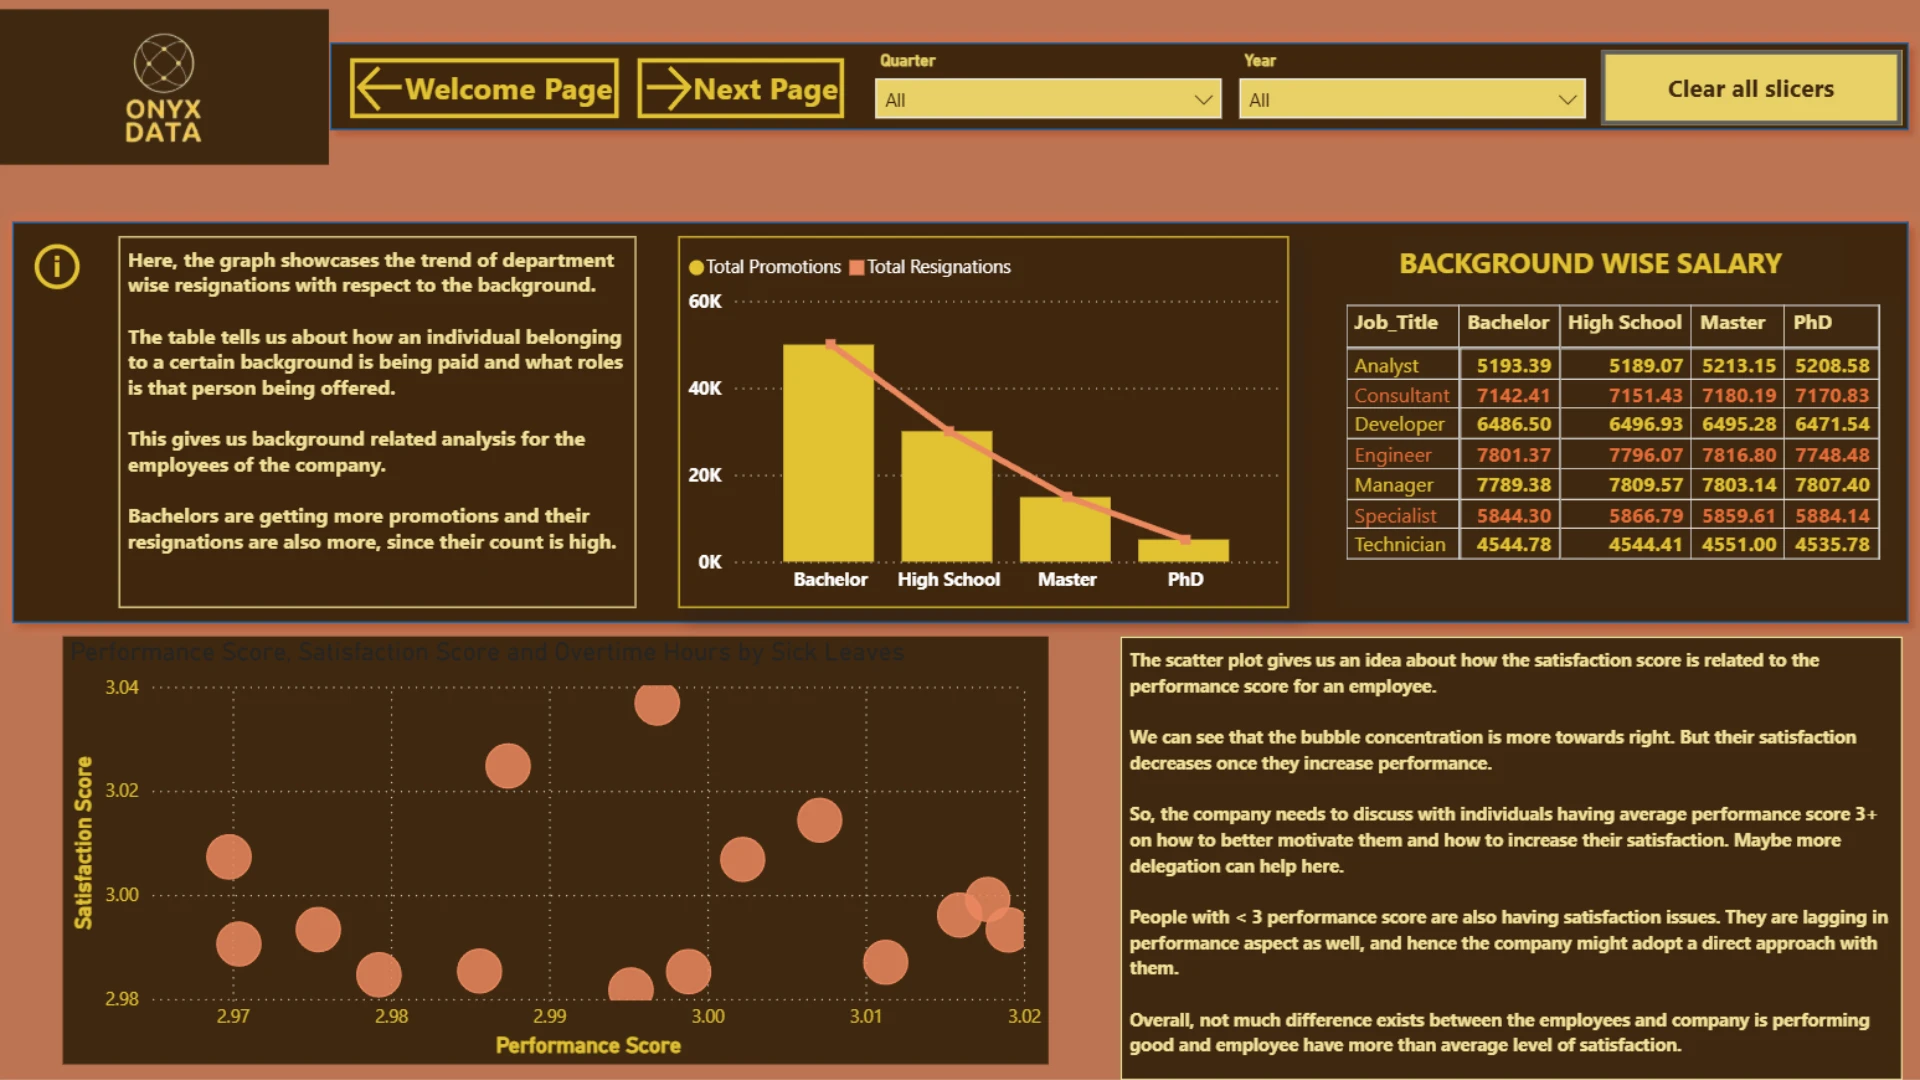
2) Page 2 - Compares Performance and Satisfaction, Background with respect to financial benefits
3) Page 3 - In depth performance, team wise, department wise and how salary is related to the performance is given here.
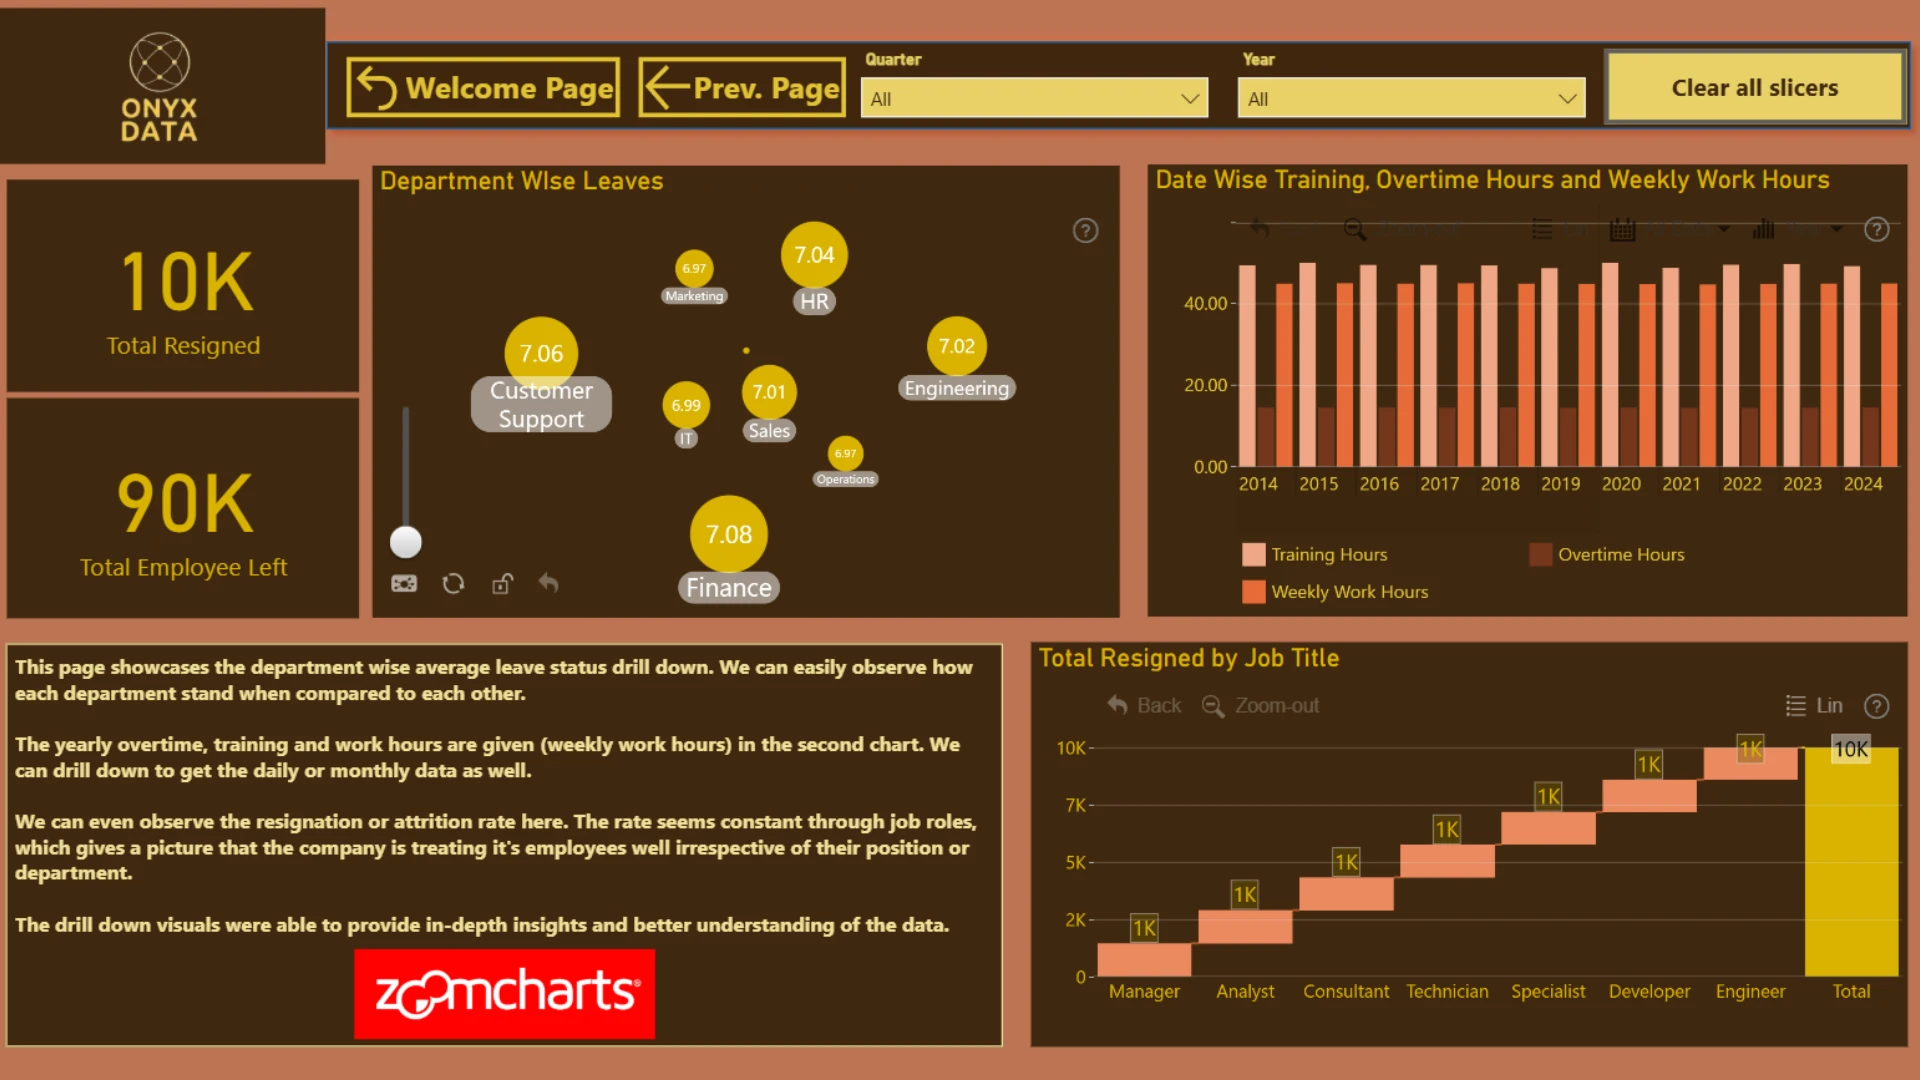
4) Final Page - Year wise work, overtime, training data with resignation rate (attrition rate) for each job position. Also, how each department stands when average sick leaves are compared.
The 4 pages give us in-depth analysis of the company's workforce and how different factors are effecting it.



4U Report Challenges
Participate in data challenges, build and submit reports to get free template downloads.
Join CommunityMobile view allows you to interact with the report. To Download the template please switch to desktop view.
How to use a PBIX template
Preview the interactive report, download the PBIX file, open it in Power BI Desktop, and replace the same data connection with your own dataset.
Preview and download
Explore the report online and download the PBIX template file.
Open in Power BI Desktop
Open the downloaded PBIX file in Power BI Desktop.
Connect your data
Replace the sample data source with your own dataset.
Refresh and adjust
Refresh the model and update fields or visual were needed.
Save and share
Save your report and publish it for your audience.


