682
Western Europe Holiday Earnings A Targeted Market Analysis
Western Europe Holiday Earnings A Targeted Market Analysis
More Report pages
Report Author: Norman Reynaldo Sabillon Castro
682
Share template with others
Report submitted for FP20 Analytics ZoomCharts Challenge, December 2023. The report was built with Xmas Gift Sales dataset and includes ZoomCharts custom Drill Down PRO visuals for Power BI.
Author's description:
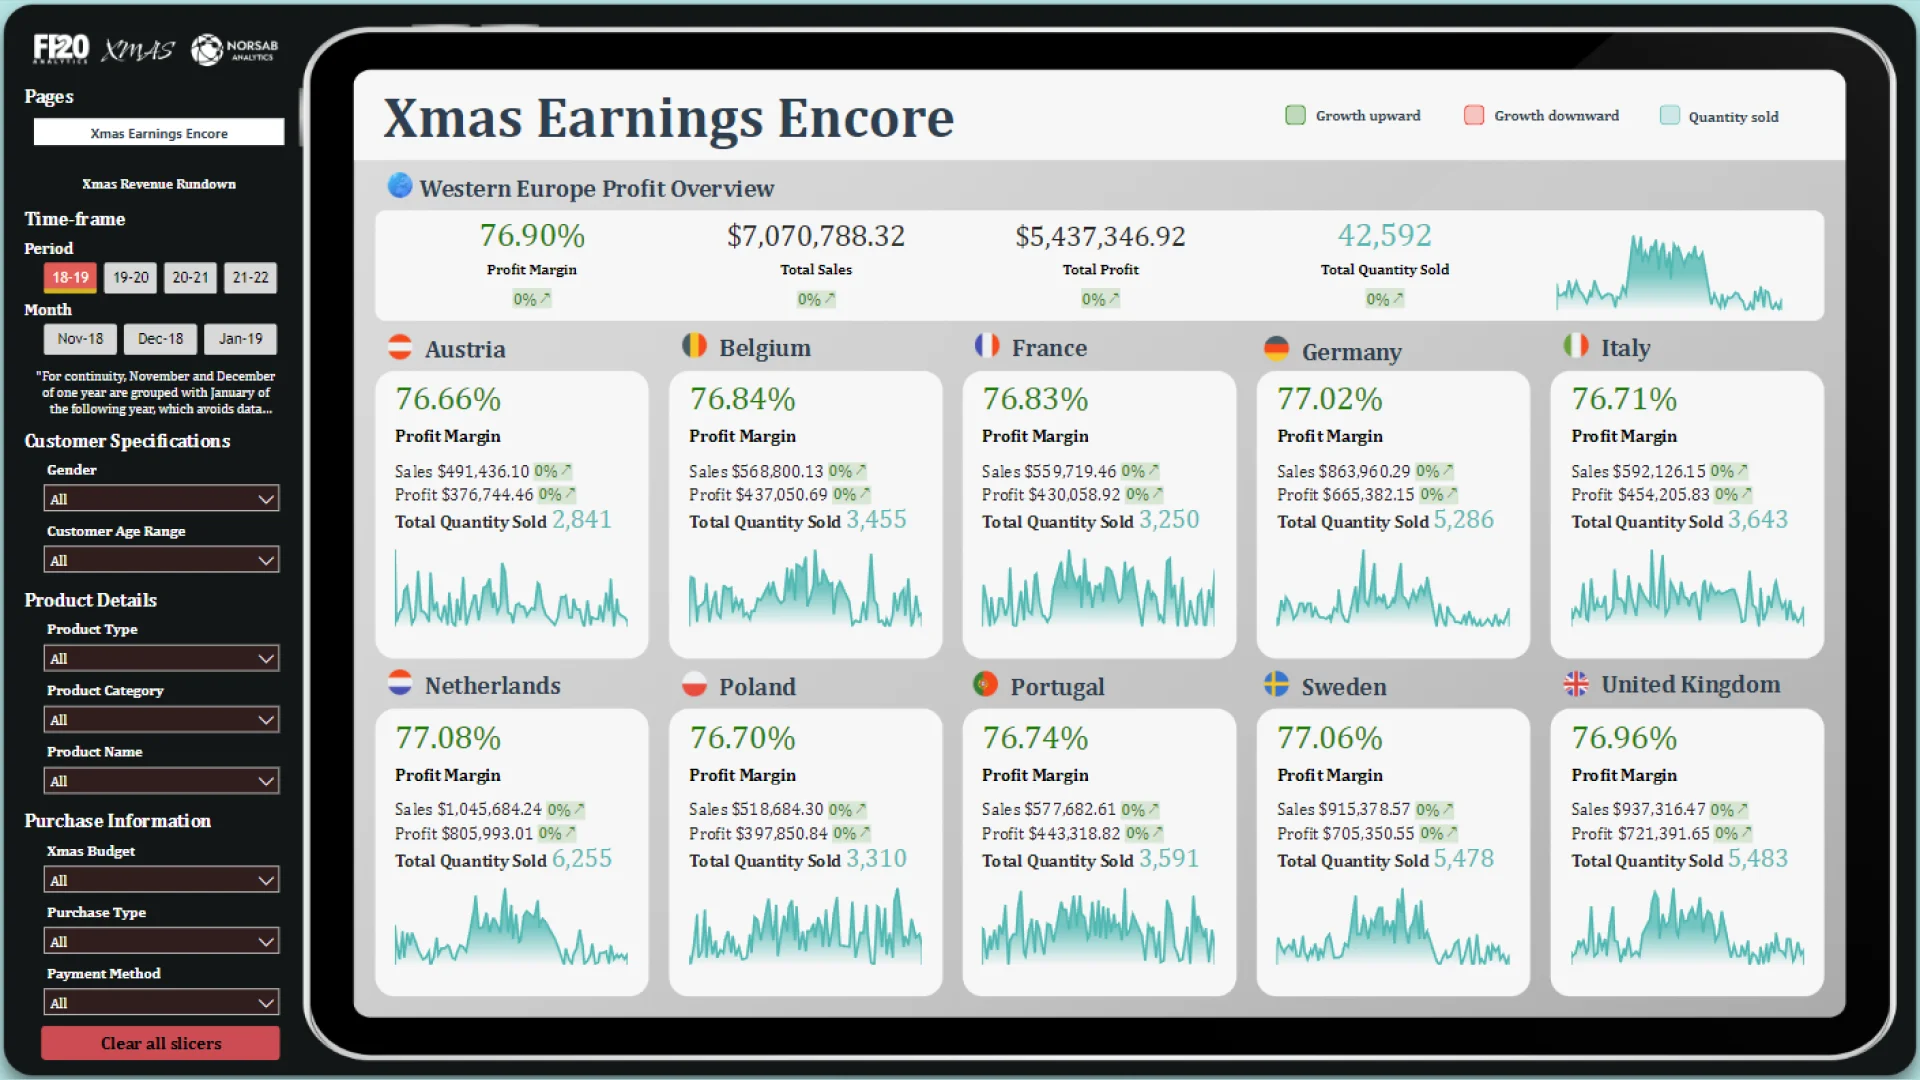
Page 1: This page shows how profitable each country was during the holiday season. You can see key metrics like profit margin, sales, profit, and total quantity sold for each country. There's also a graph for each country that shows how these metrics changed over time.
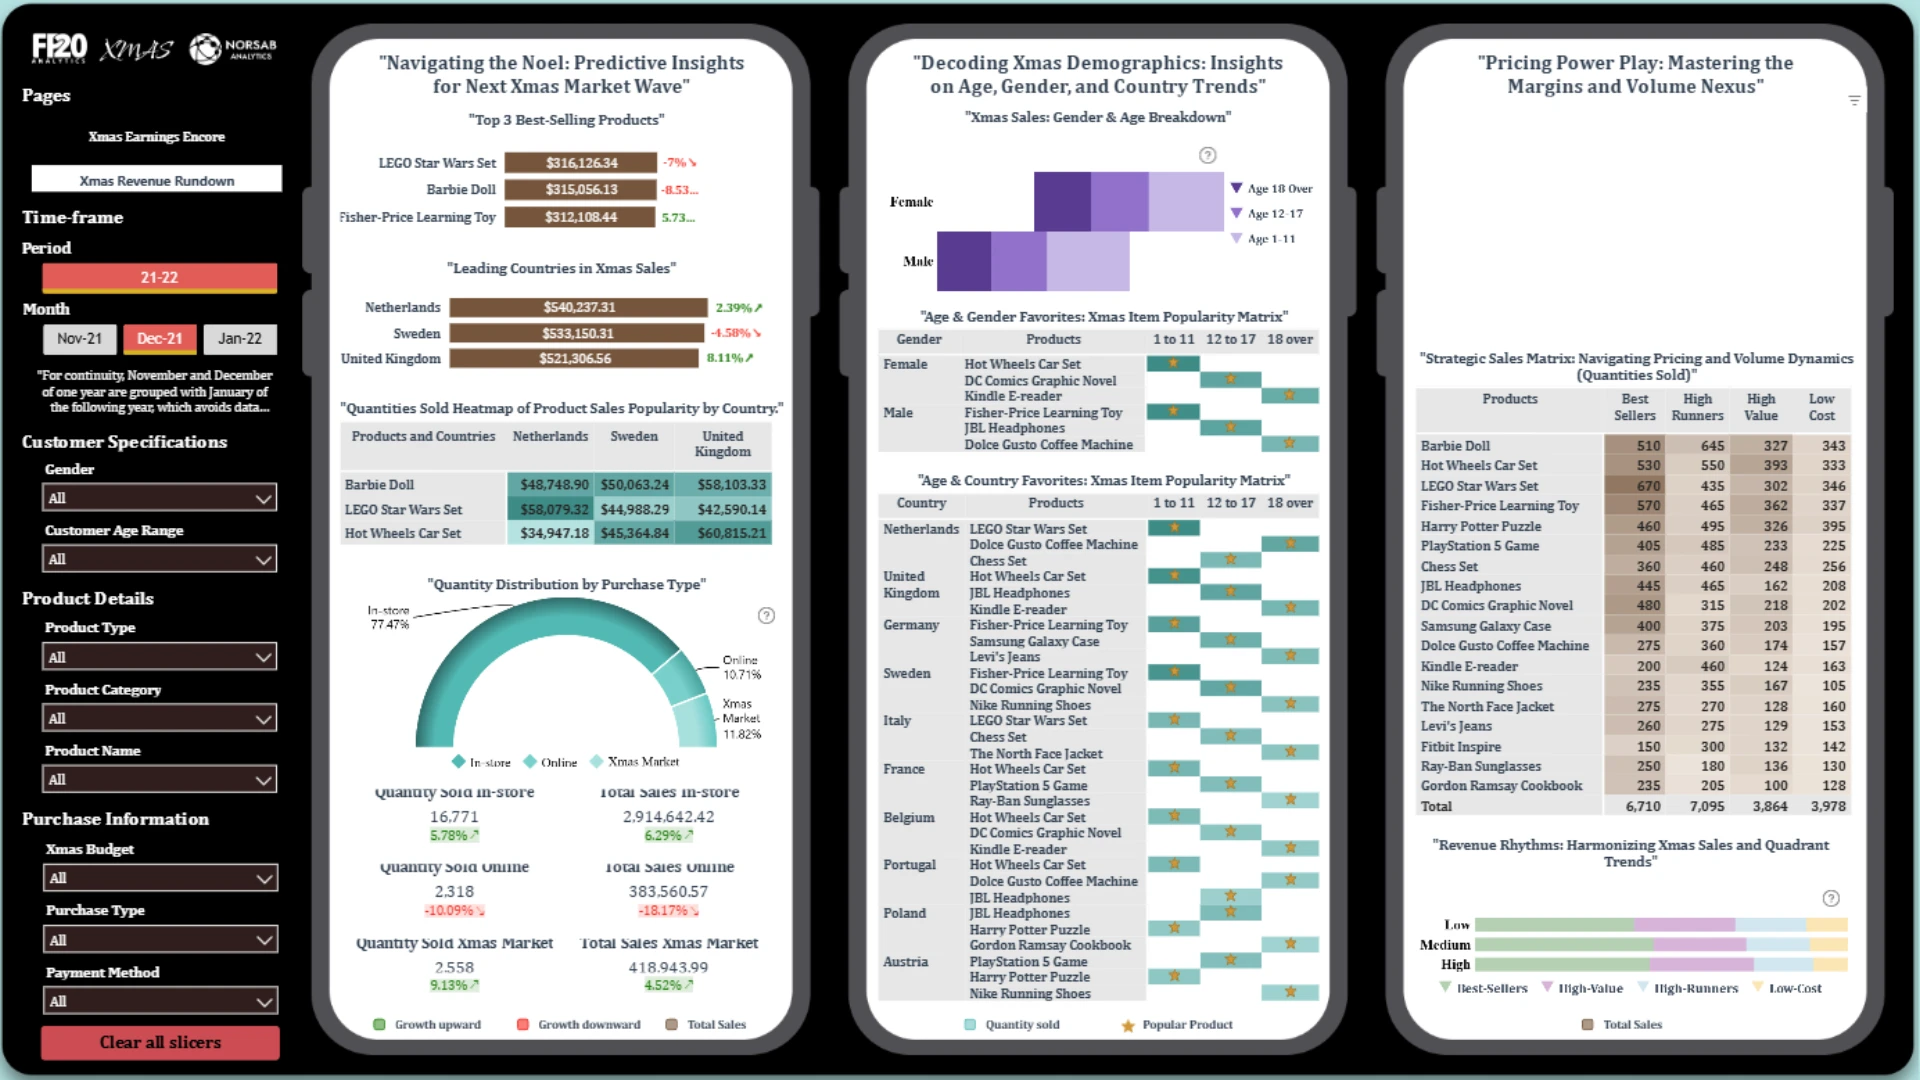
Page 2: This page has three sections that break down holiday sales in different ways. The first section looks at things like which products sold the most and which countries did the most shopping. The second section looks at who bought what, based on age, gender, and country. The third section looks at how different pricing strategies affected sales.
4U Report Challenges
Participate in data challenges, build and submit reports to get free template downloads.
Join CommunityMobile view allows you to interact with the report. To Download the template please switch to desktop view.

Was this helpful? Thank you for your feedback!
Sorry about that.
How can we improve it?