647
Udemy Courses Analysis 9
Udemy Courses Analysis 9
Report Author: Joseph Szczesniak
647
Share template with others
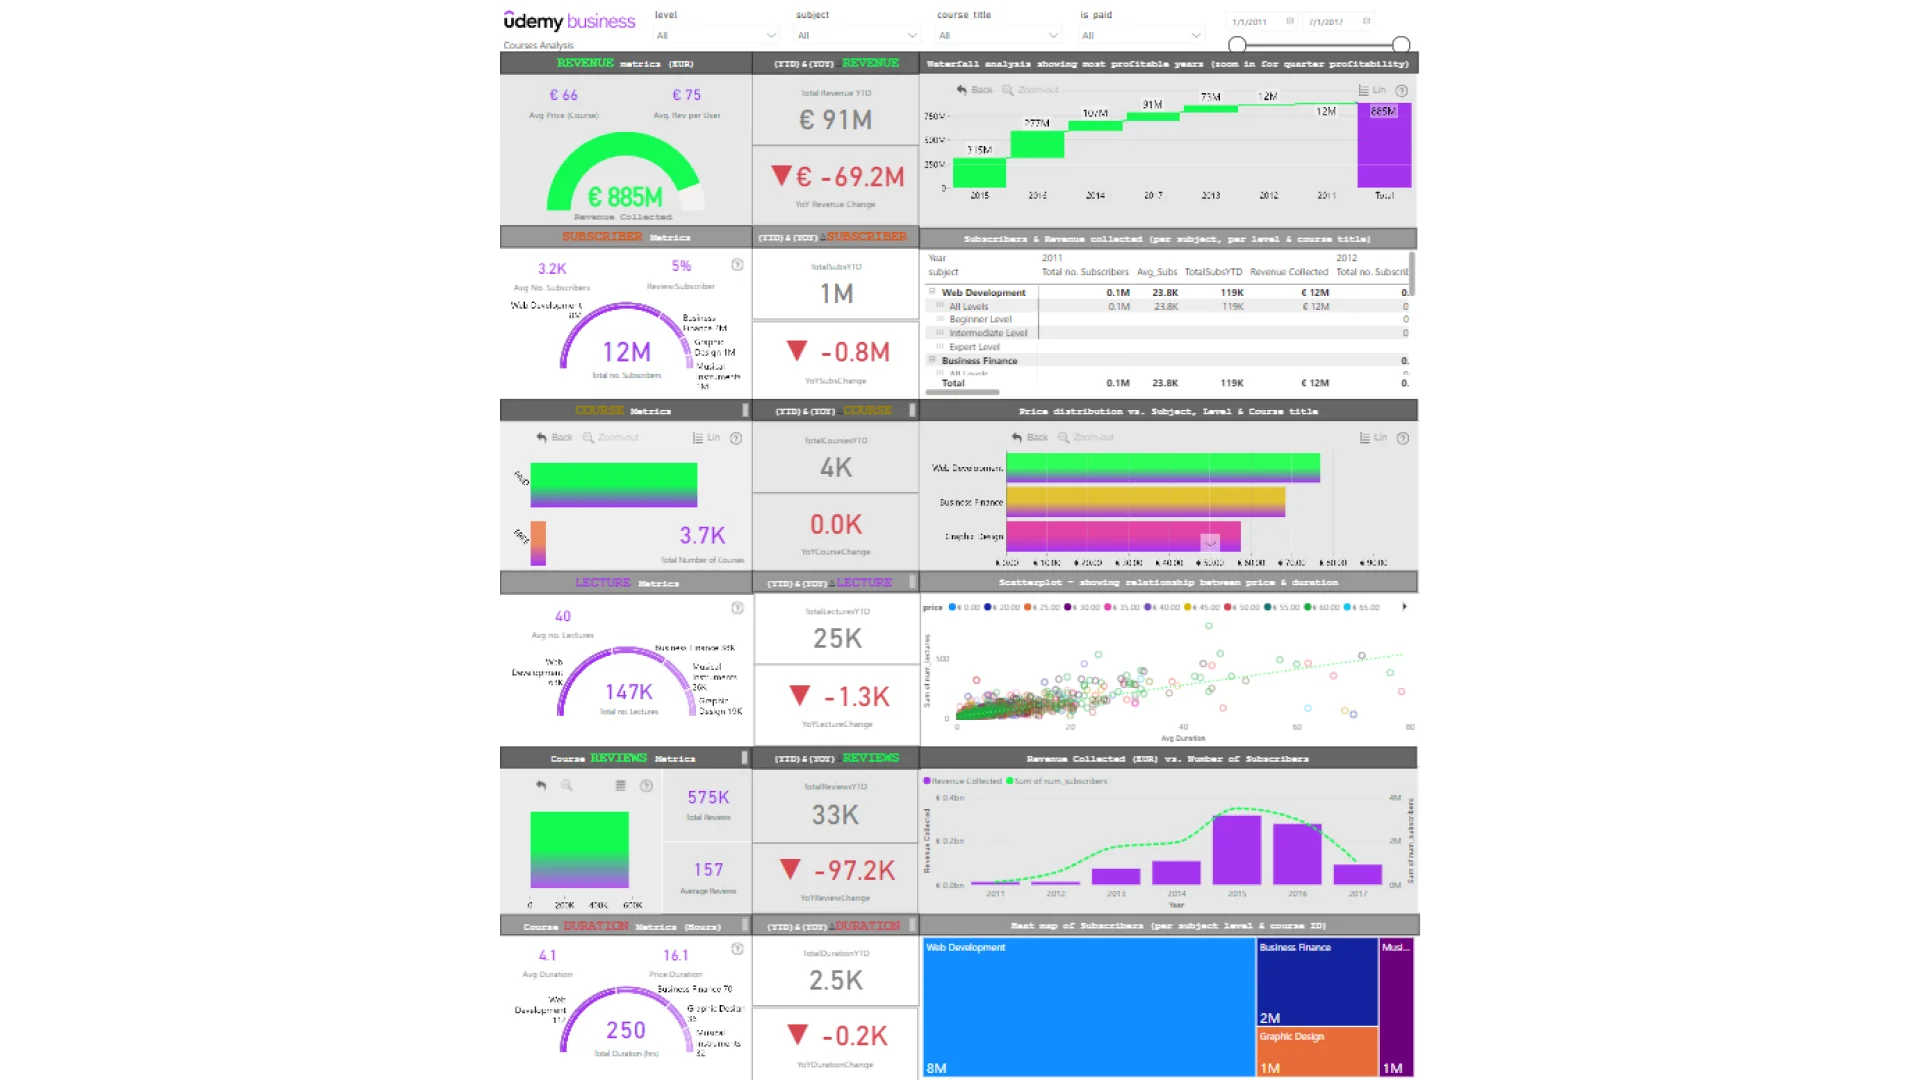
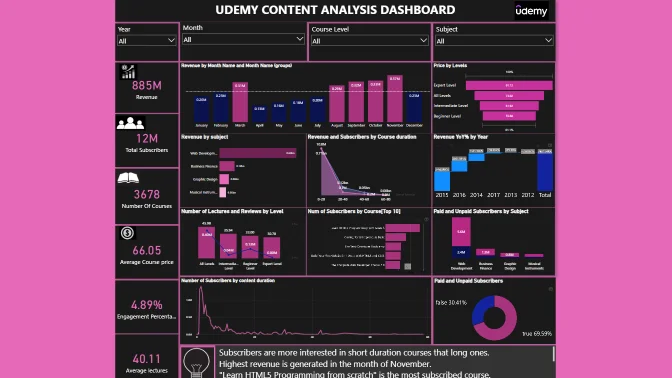
Report submitted for Onyx Data DataDNA ZoomCharts Mini Challenge, January 2024. The report was built based on Udemy Courses dataset and includes ZoomCharts custom Drill Down PRO visuals for Power BI.
Author's description:
PowerBI report based on Udemy Data. Exploring metrics (Revenue, Subscribers, Courses, Lectures, Reviews & Duration) and any potential relationships which may explain performance. (e.g., which year is the most profitable? Is price correlated with number of lectures? Is Price distributed by popularity (demand inflating price)? Is Revenue driven by the number of subscribers? Which difficulty levels see the highest participation per course? What are the Year-to-date (YTD) values & Year-on-year (YoY) values for the metrics?).
4U Report Challenges
Participate in data challenges, build and submit reports to get free template downloads.
Join CommunityMobile view allows you to interact with the report. To Download the template please switch to desktop view.
Was this helpful? Thank you for your feedback!
Sorry about that.
How can we improve it?