2585
Udemy Courses Analysis
Udemy Courses Analysis
More Report pages
Report Author: Prathamesh Sawant
2585
Share template with others
Report submitted for Onyx Data DataDNA ZoomCharts Mini Challenge, January 2024. The report was built based on Udemy Courses dataset and includes ZoomCharts custom Drill Down PRO visuals for Power BI.
Author's description:
🌐Dashboard Highlights:
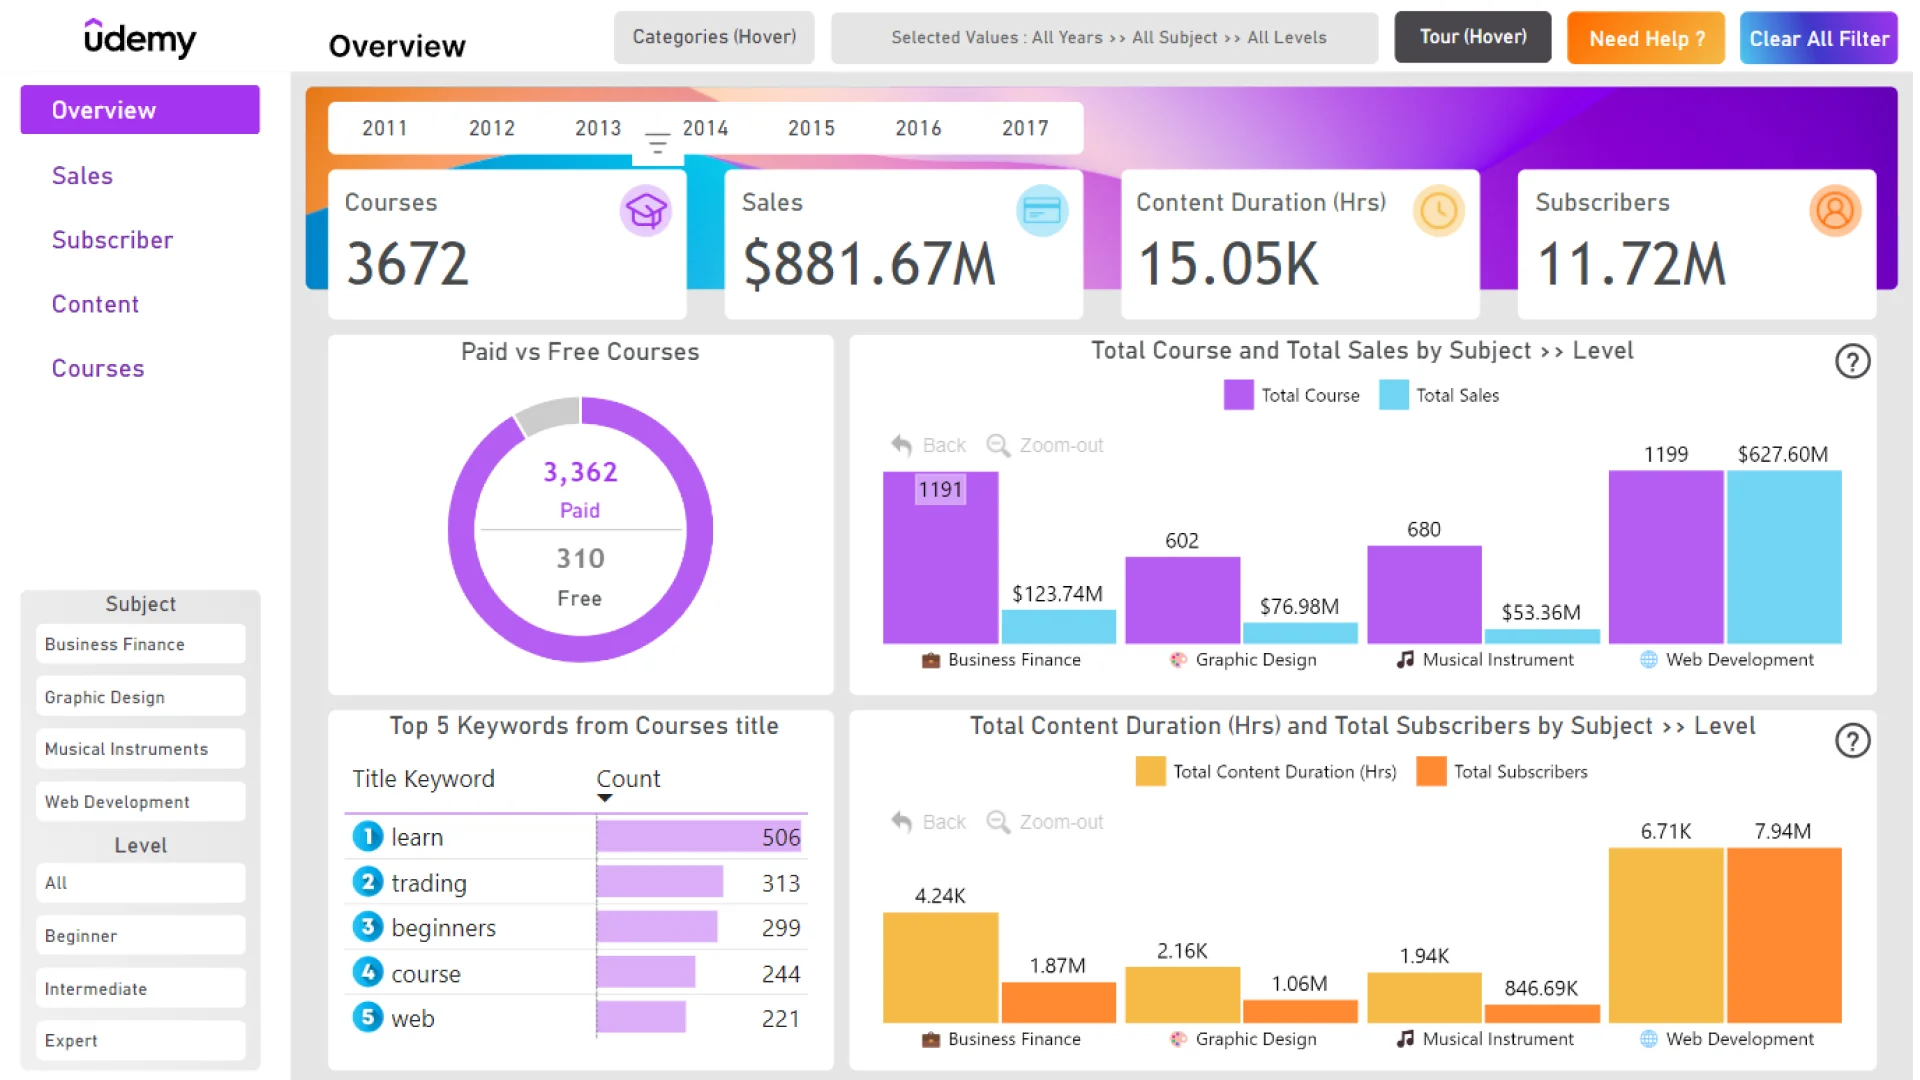
👉Overview: Four powerful KPIs - Total Sales, Course Count, Content Duration, and Subscribers - providing a snapshot of performance.
👉Engagement Visuals: Donut chart showcasing the distribution between paid and free courses, and a bar chart allowing drill-downs for in-depth insights.
👉Top 5 Keywords: Table with conditional formatting highlighting the top 5 keywords from course titles.
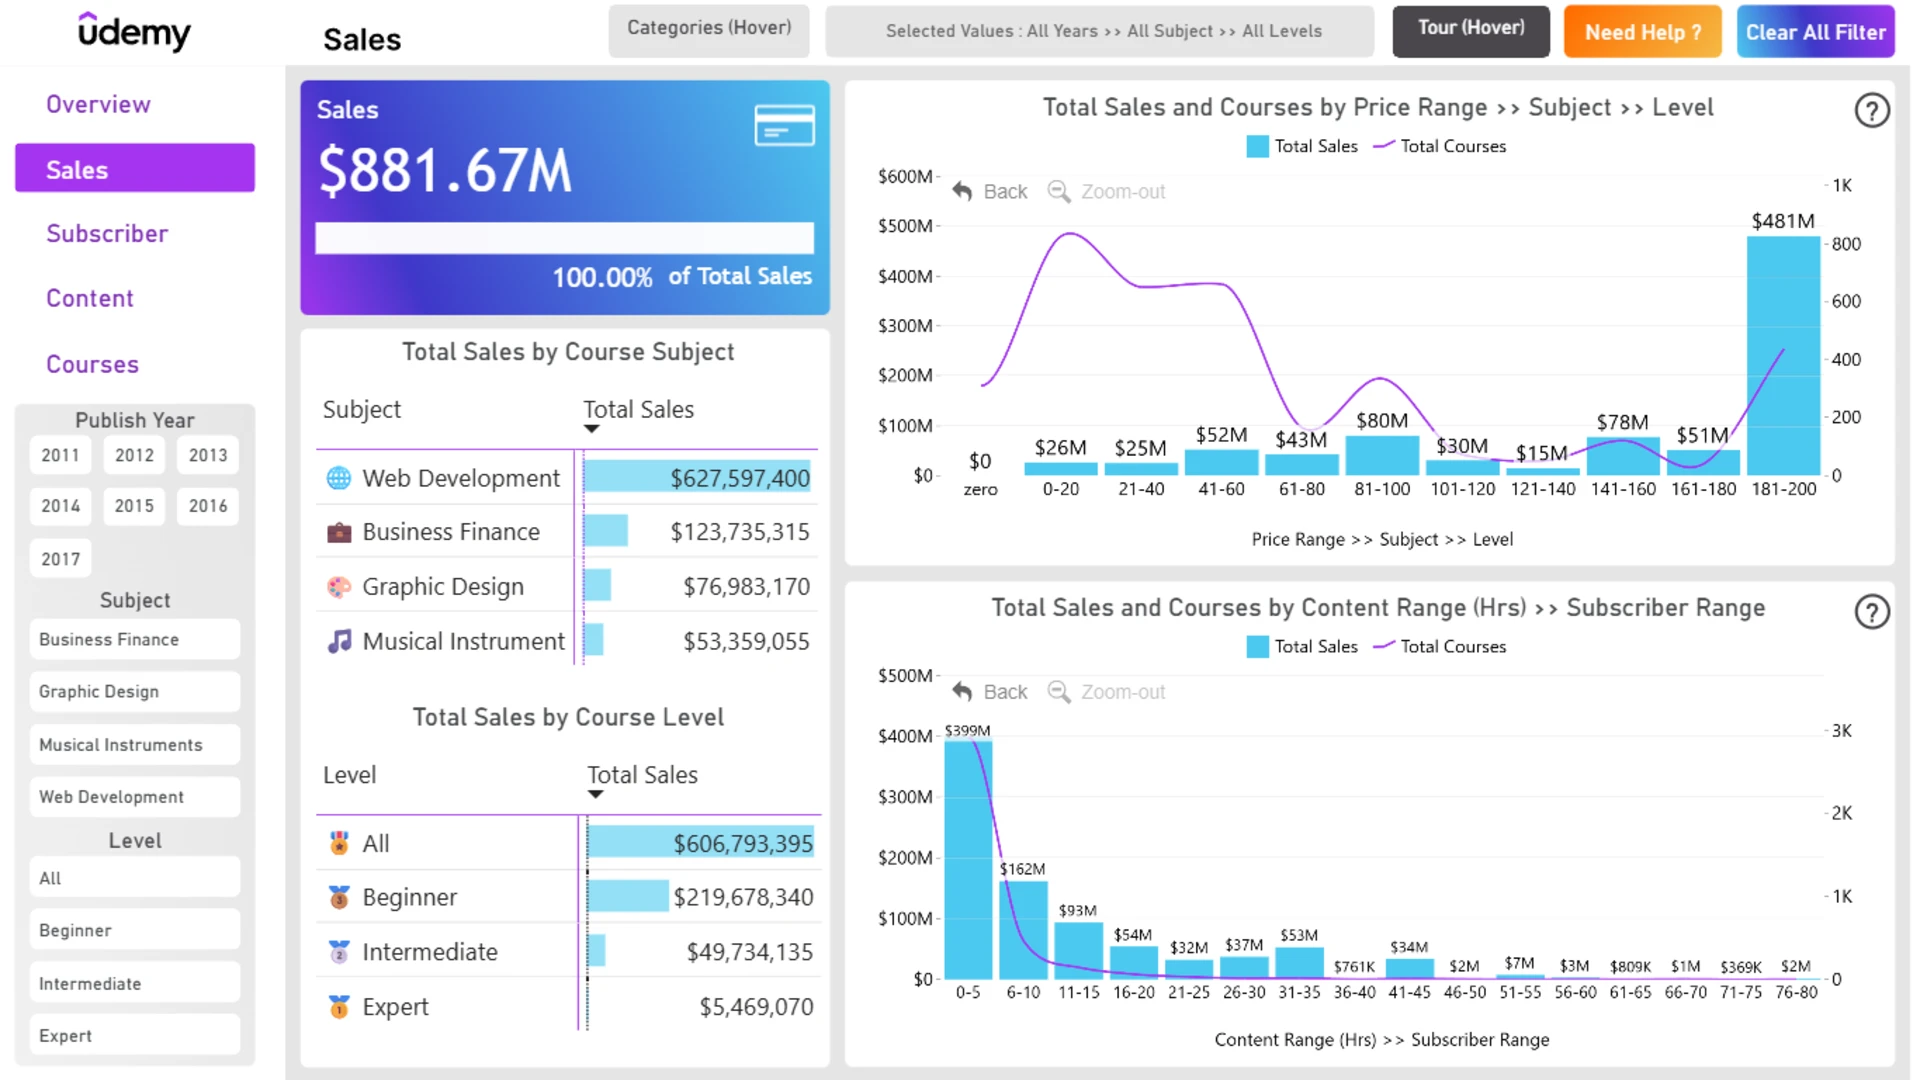
🚀 Sales Page: Dive into sales , explore sales based on price range, subject, and level, and understand the distribution by subject and level.
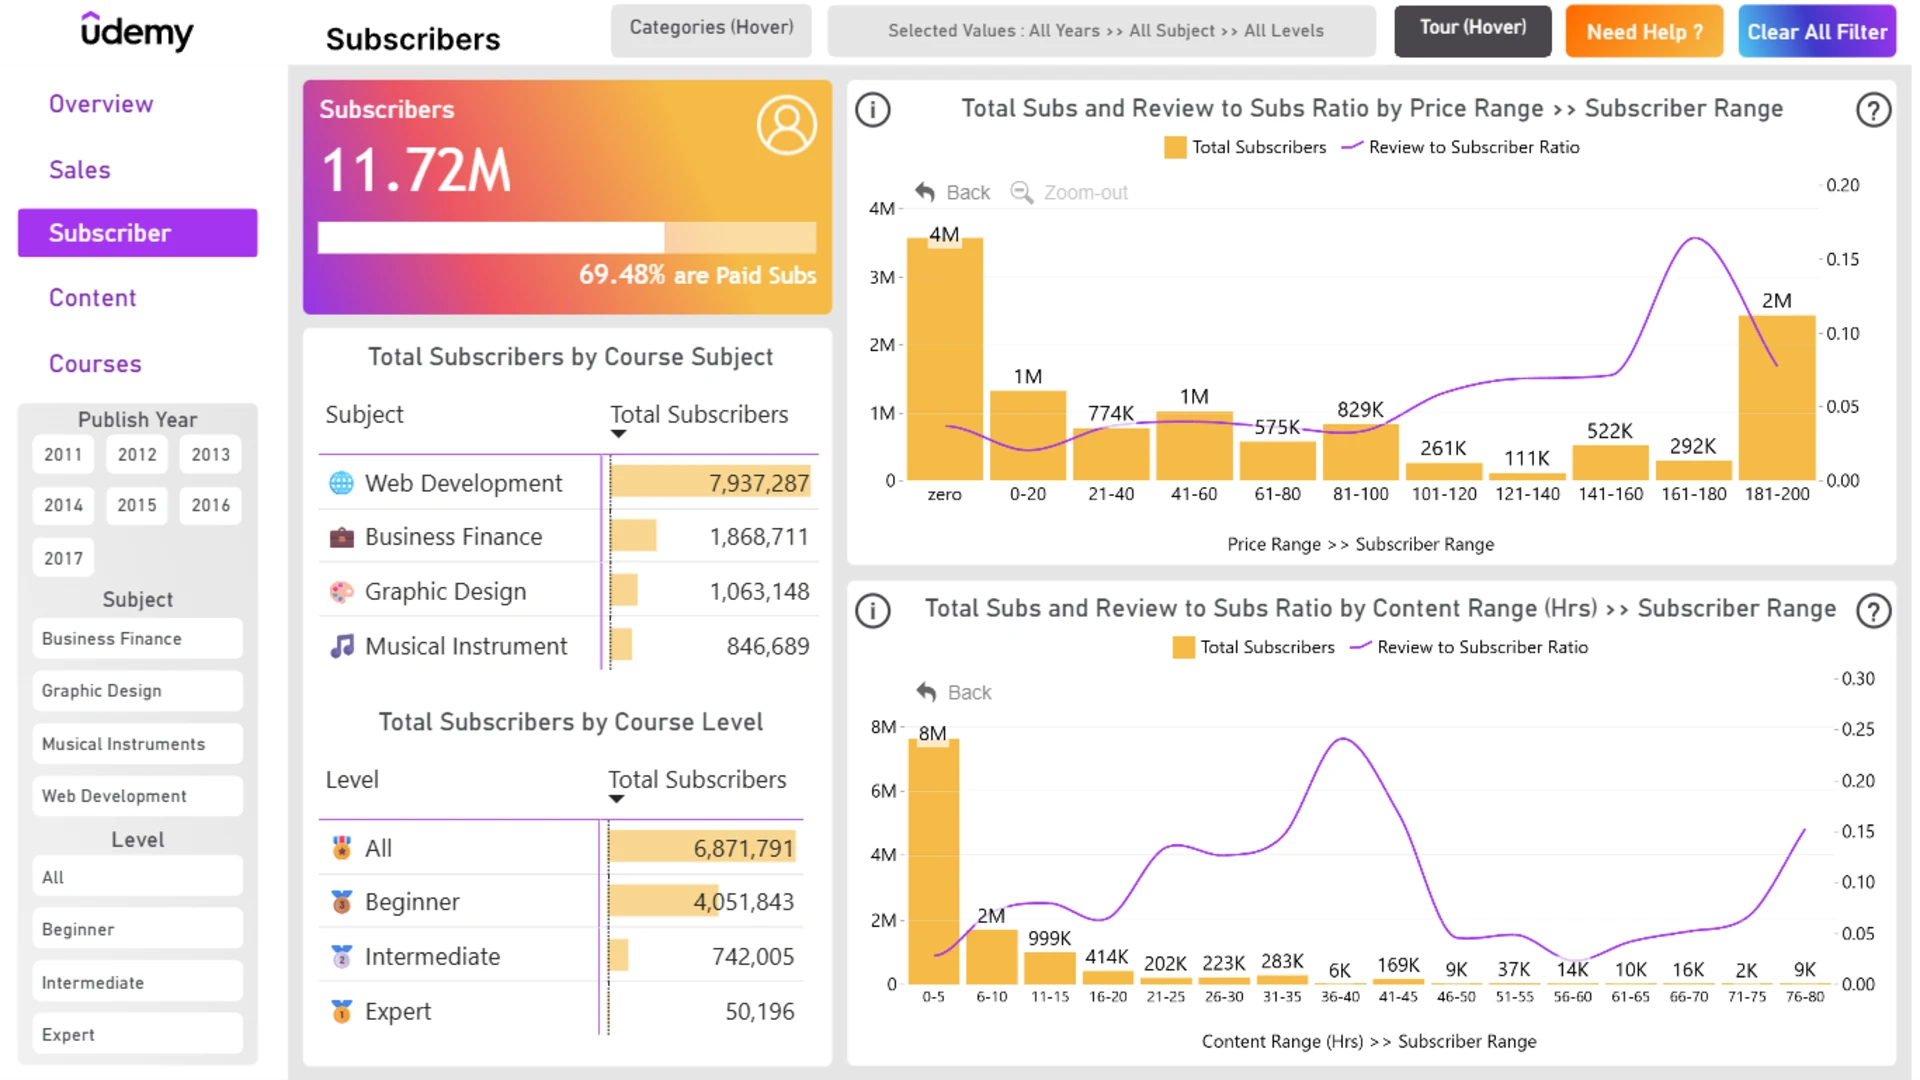
😊 Subscriber Page: Learn about total subscribers, review-to-subscriber ratios, and distribution by subject and level.
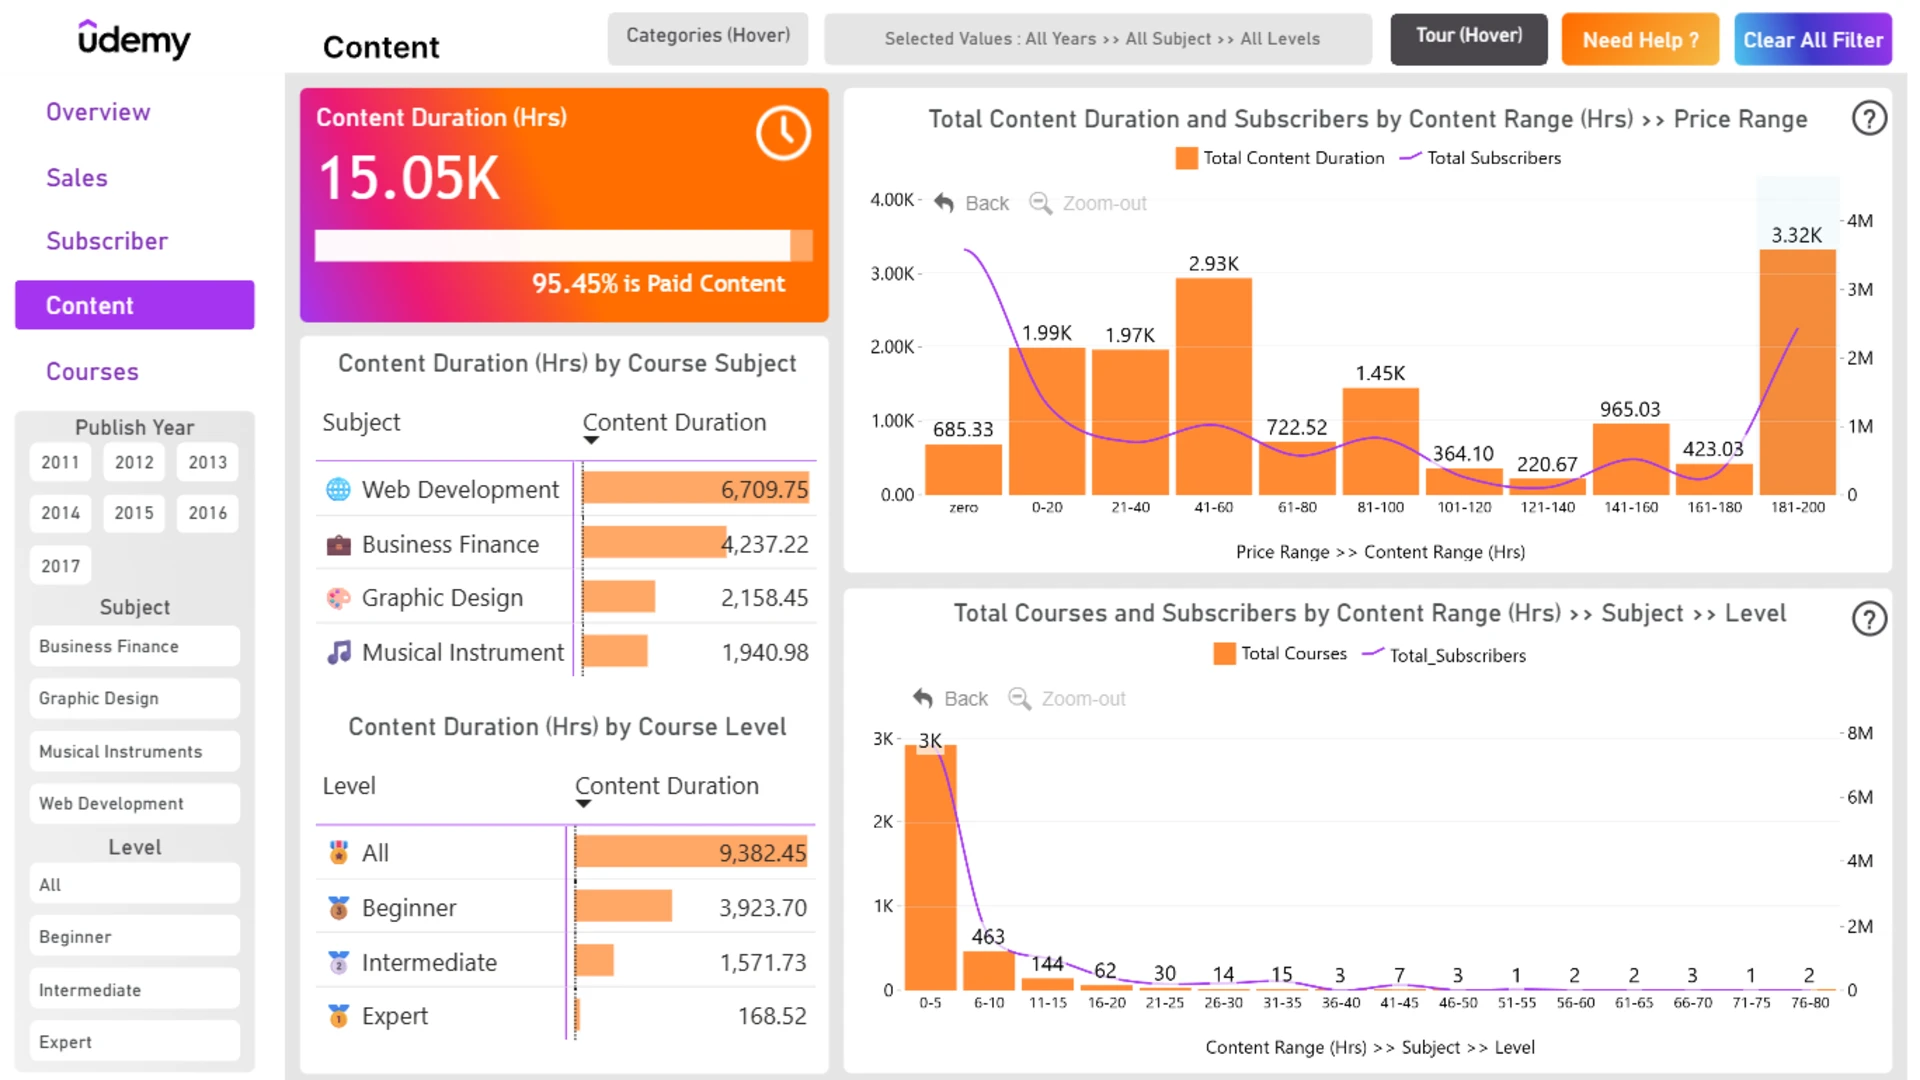
⏰ Content Page: Explore total content duration and insights into content duration based on range, subject, and level.
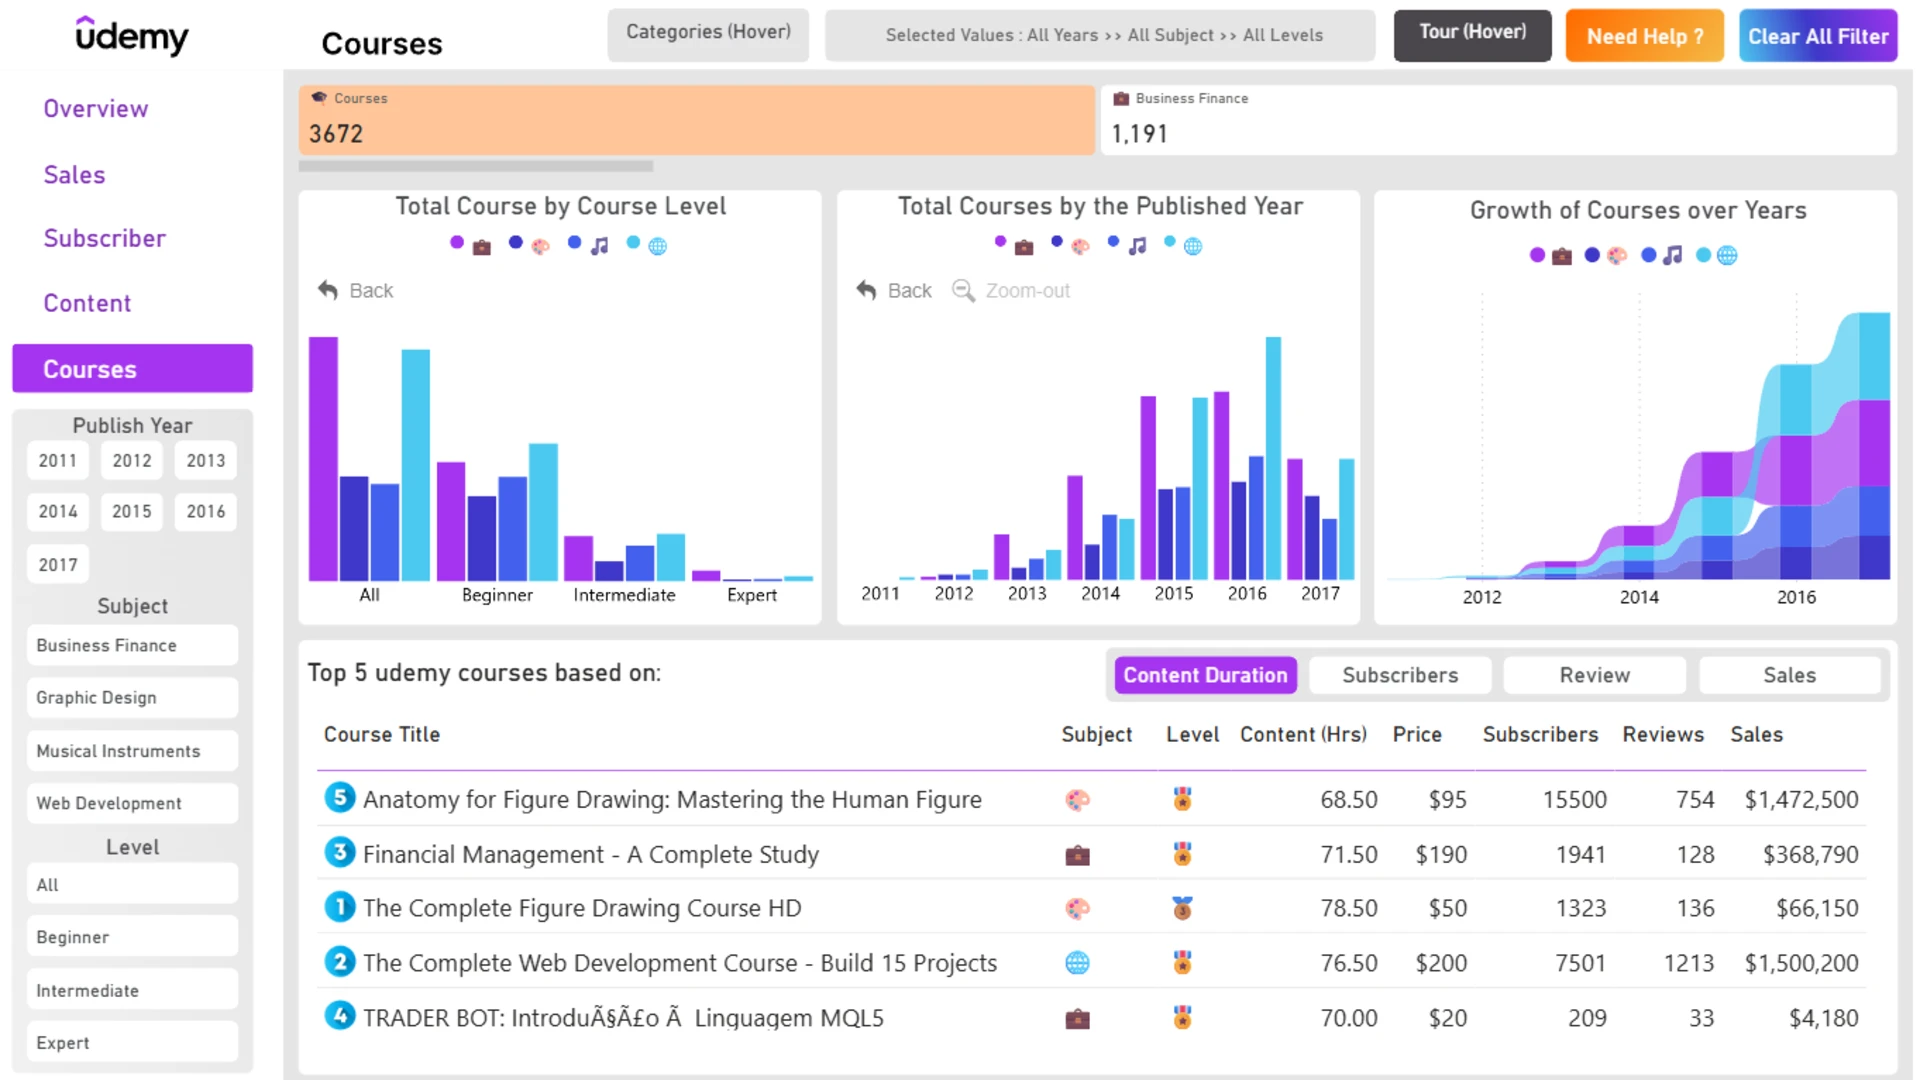
📚 Courses Page: Discover the total count of courses, trend of course subject over the years, and a table featuring the top 5 courses based on different parameter.
🌟Design & Interactivity: Clear visuals, cross-chart filtering, and zoomcharts drill-down functionality for an intuitive user experience. Your feedback is welcomed!
ZoomCharts visuals used
4U Report Challenges
Participate in data challenges, build and submit reports to get free template downloads.
Join CommunityMobile view allows you to interact with the report. To Download the template please switch to desktop view.
Was this helpful? Thank you for your feedback!
Sorry about that.
How can we improve it?