298
Travel Power BI Dashboard
Travel Power BI Dashboard
More Report pages
Report Author: Samim Imtiaz
298
Share template with others
The Summer Travel Dashboard takes users through three stages of travel planning: Destination → Guide → Explore.
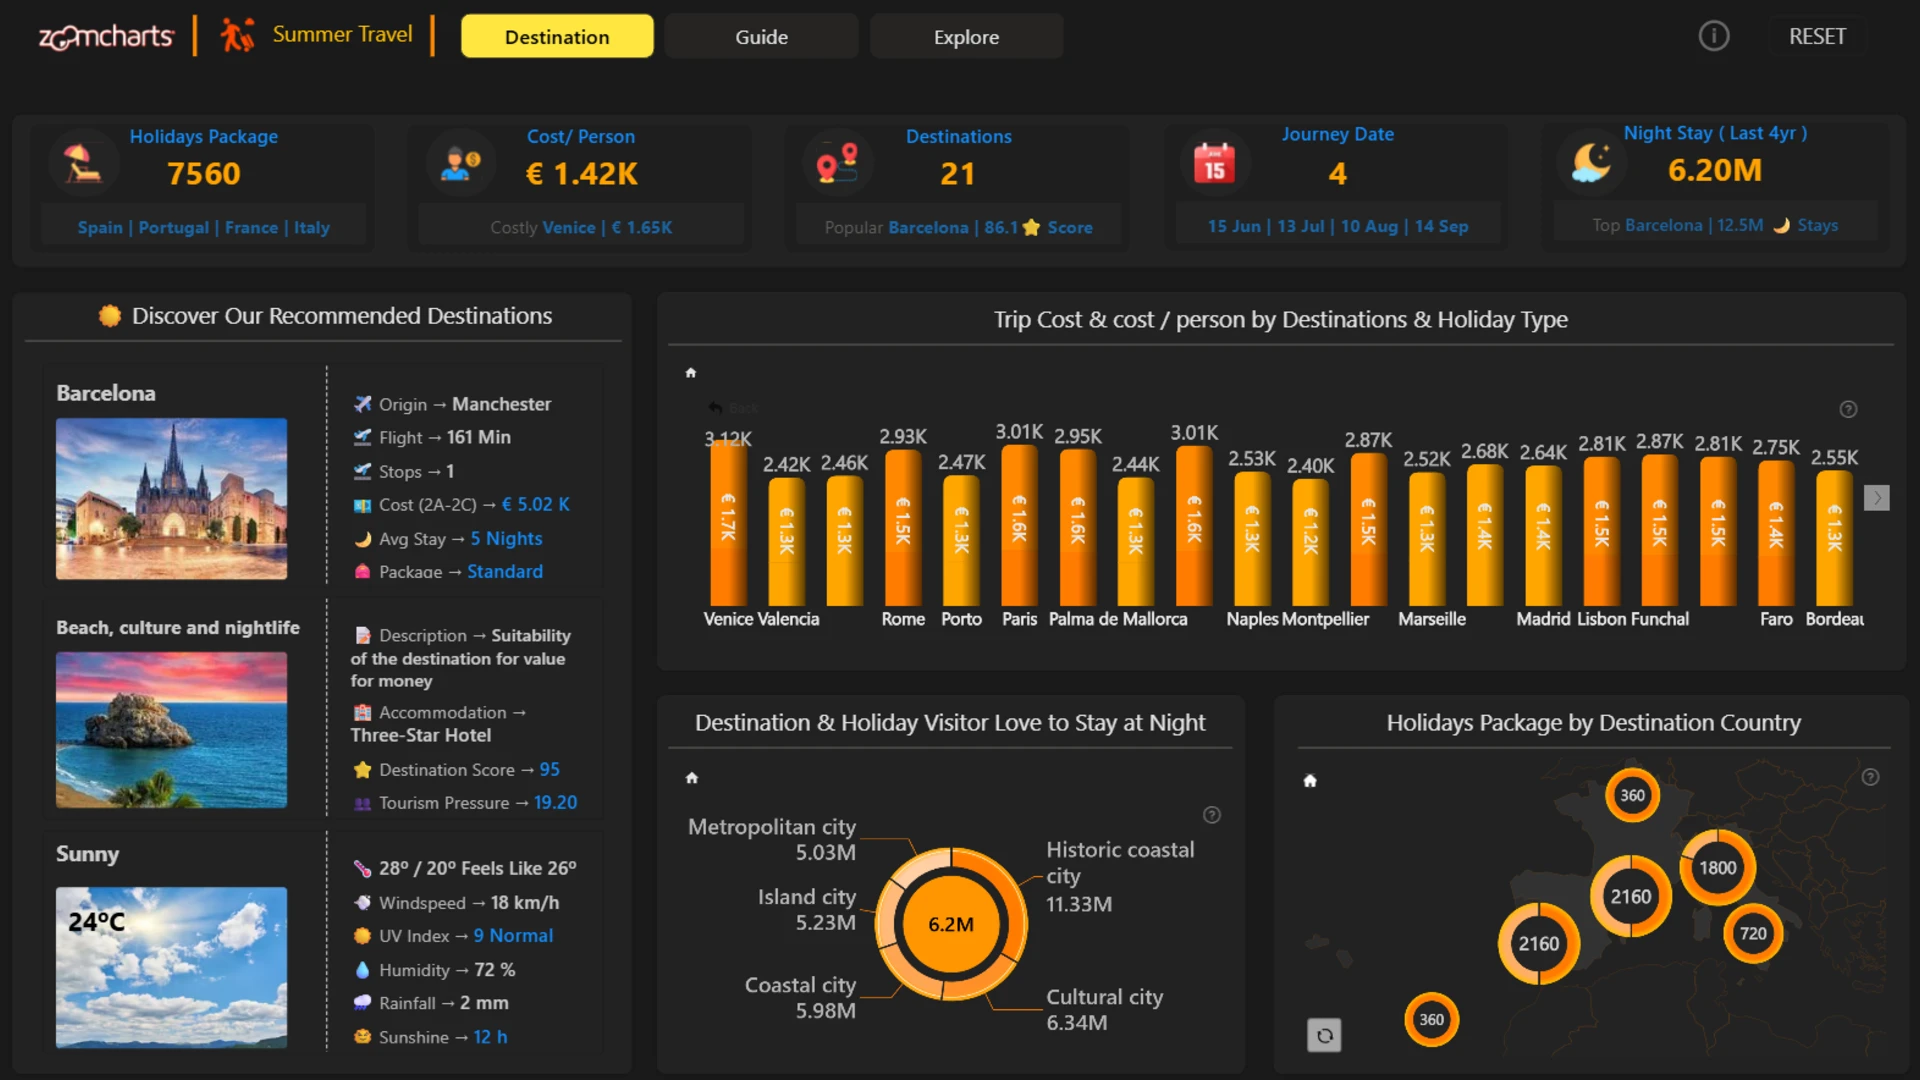
Destination gives an overview of the available travel options. Users can compare destinations by trip cost, cost per person, holiday type, visitor stay patterns, and country. The recommendation panel provides additional context for selected destinations, including flight details, accommodation, destination score, tourism pressure, and weather conditions.
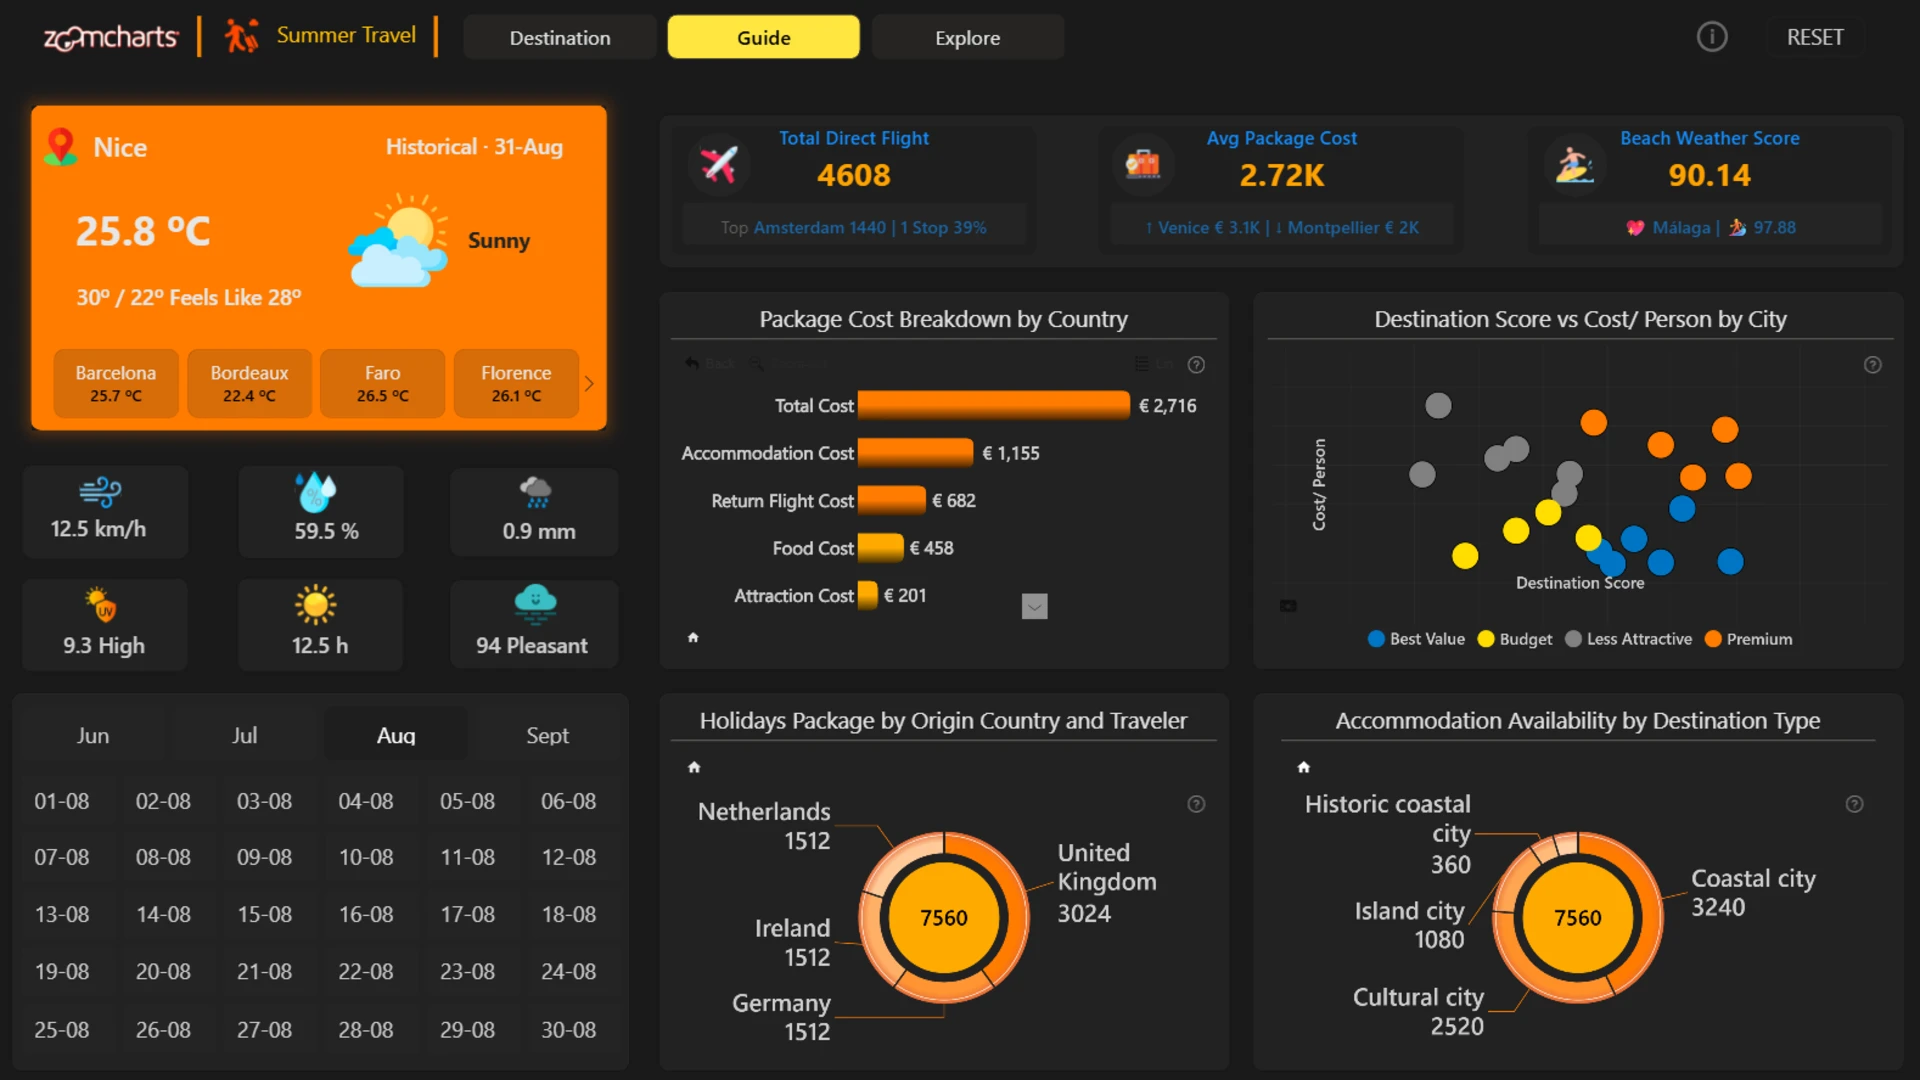
Guide provides a closer look at destinations and helps users compare the practical aspects of a trip. It covers direct flights, package costs, weather, accommodation availability, traveller origins, and destination scores. The score-versus-cost view groups destinations into Best Value, Budget, Less Attractive, and Premium, making it easier to see how price compares with destination appeal.
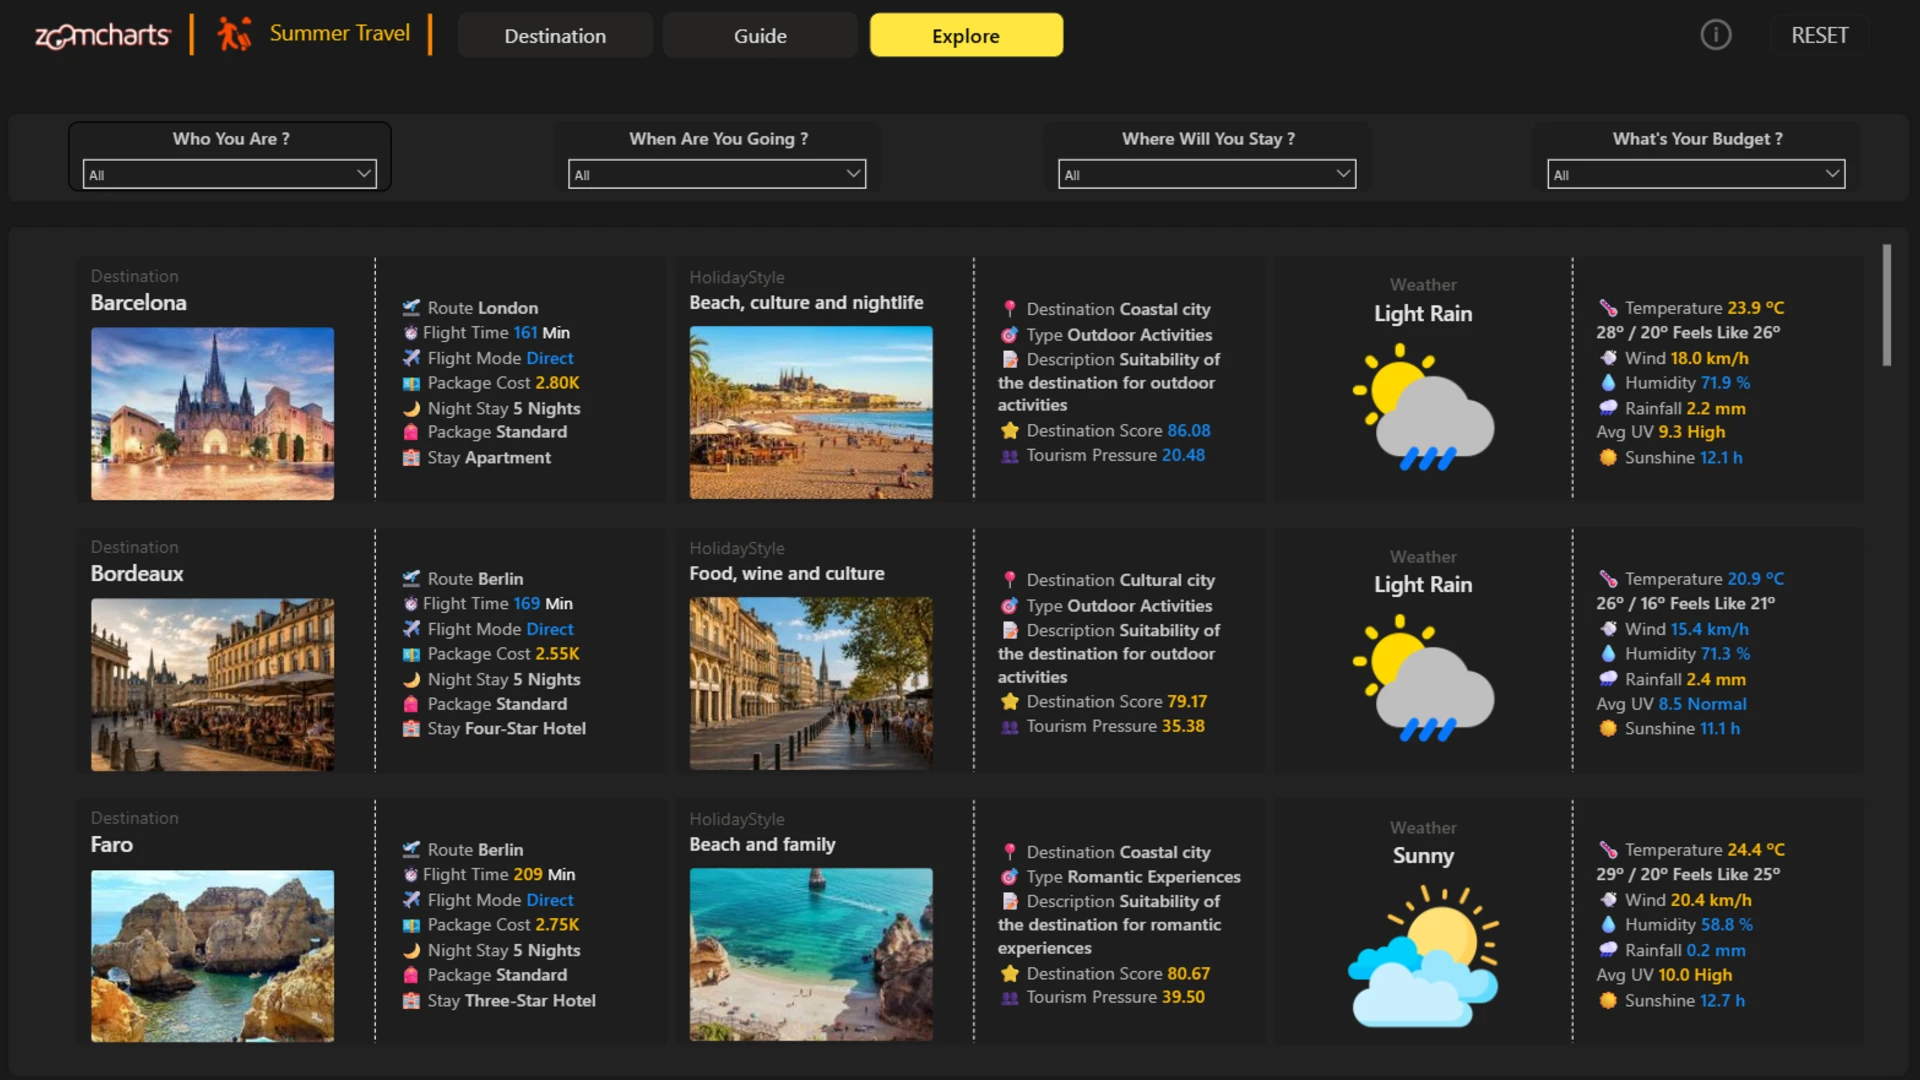
Explore brings the information together for more detailed trip planning. Users can filter options by traveller type, travel period, accommodation preference, and budget, then browse destination cards with information about flights, package costs, length of stay, accommodation, holiday style, destination score, tourism pressure, and weather.
Report interactions
The report combines interactive analysis with fixed reference panels. This is intentional.
On the Destination page, the recommendation panel remains independent from selections in the analytical visuals so users can continue comparing recommended destinations rather than seeing the panel repeat their current selection.
On the Guide page, the weather panel works separately from the main visuals because it is intended for exploring weather by destination and date.
The remaining visuals interact where cross-filtering adds useful context to the analysis.
Together, the three pages create a simple flow: discover destinations, compare the details, and explore options that match your trip.
ZoomCharts visuals used





4U Report Challenges
Participate in data challenges, build and submit reports to get free template downloads.
Join CommunityMobile view allows you to interact with the report. To Download the template please switch to desktop view.
How to use a PBIX template
Preview the interactive report, download the PBIX file, open it in Power BI Desktop, and replace the same data connection with your own dataset.
Preview and download
Explore the report online and download the PBIX template file.
Open in Power BI Desktop
Open the downloaded PBIX file in Power BI Desktop.
Connect your data
Replace the sample data source with your own dataset.
Refresh and adjust
Refresh the model and update fields or visual were needed.
Save and share
Save your report and publish it for your audience.


