1417
Transportation & Logistics Report
Transportation & Logistics Report

More Report pages
Report Author: Suleman Abdulmalik
1417
Share template with others
Report submitted for the FP20 Analytics ZoomCharts Challenge, February-March 2025. The report was built using the Transportation & Logistics Dataset and includes ZoomCharts custom Drill Down PRO visuals for Power BI.
Author's Description:
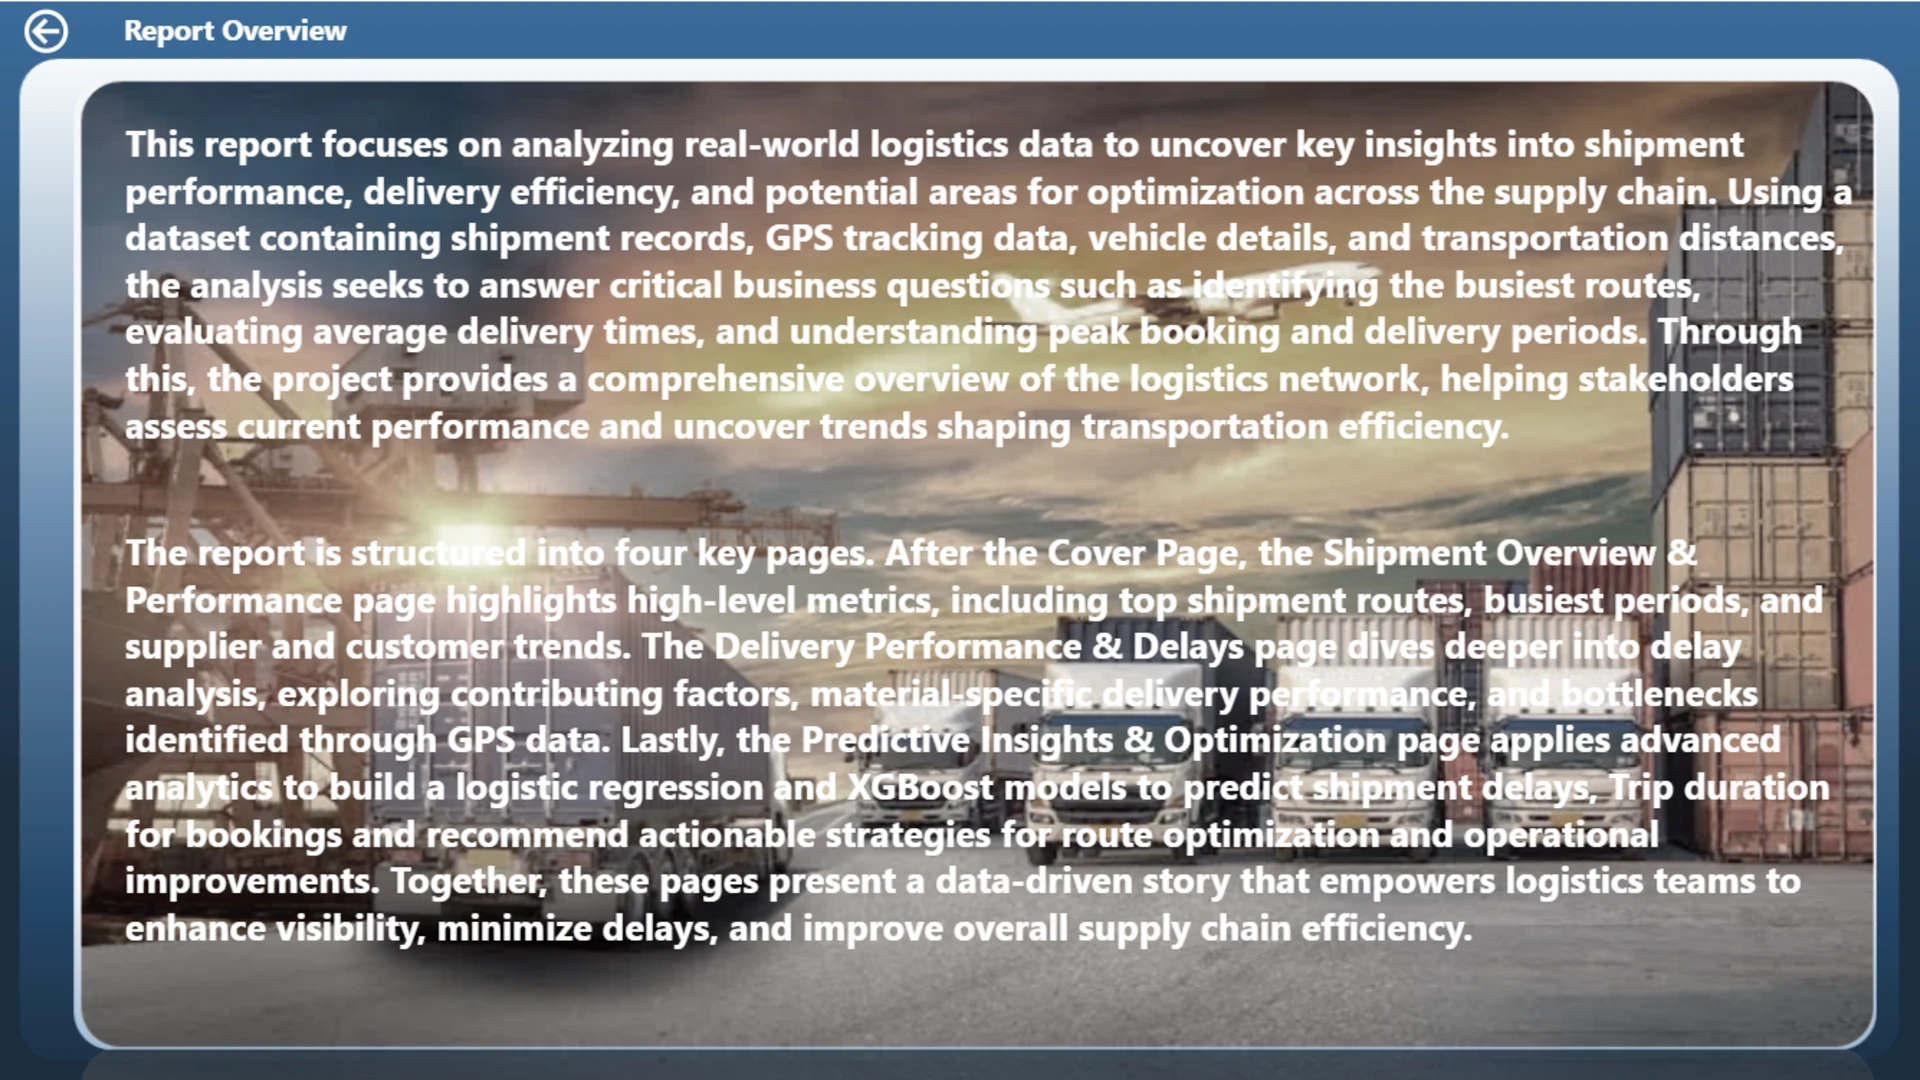
The report is structured as follows:
-
Cover Page
The cover page serves as the entry point into the report. -
Shipment Overview & Performance
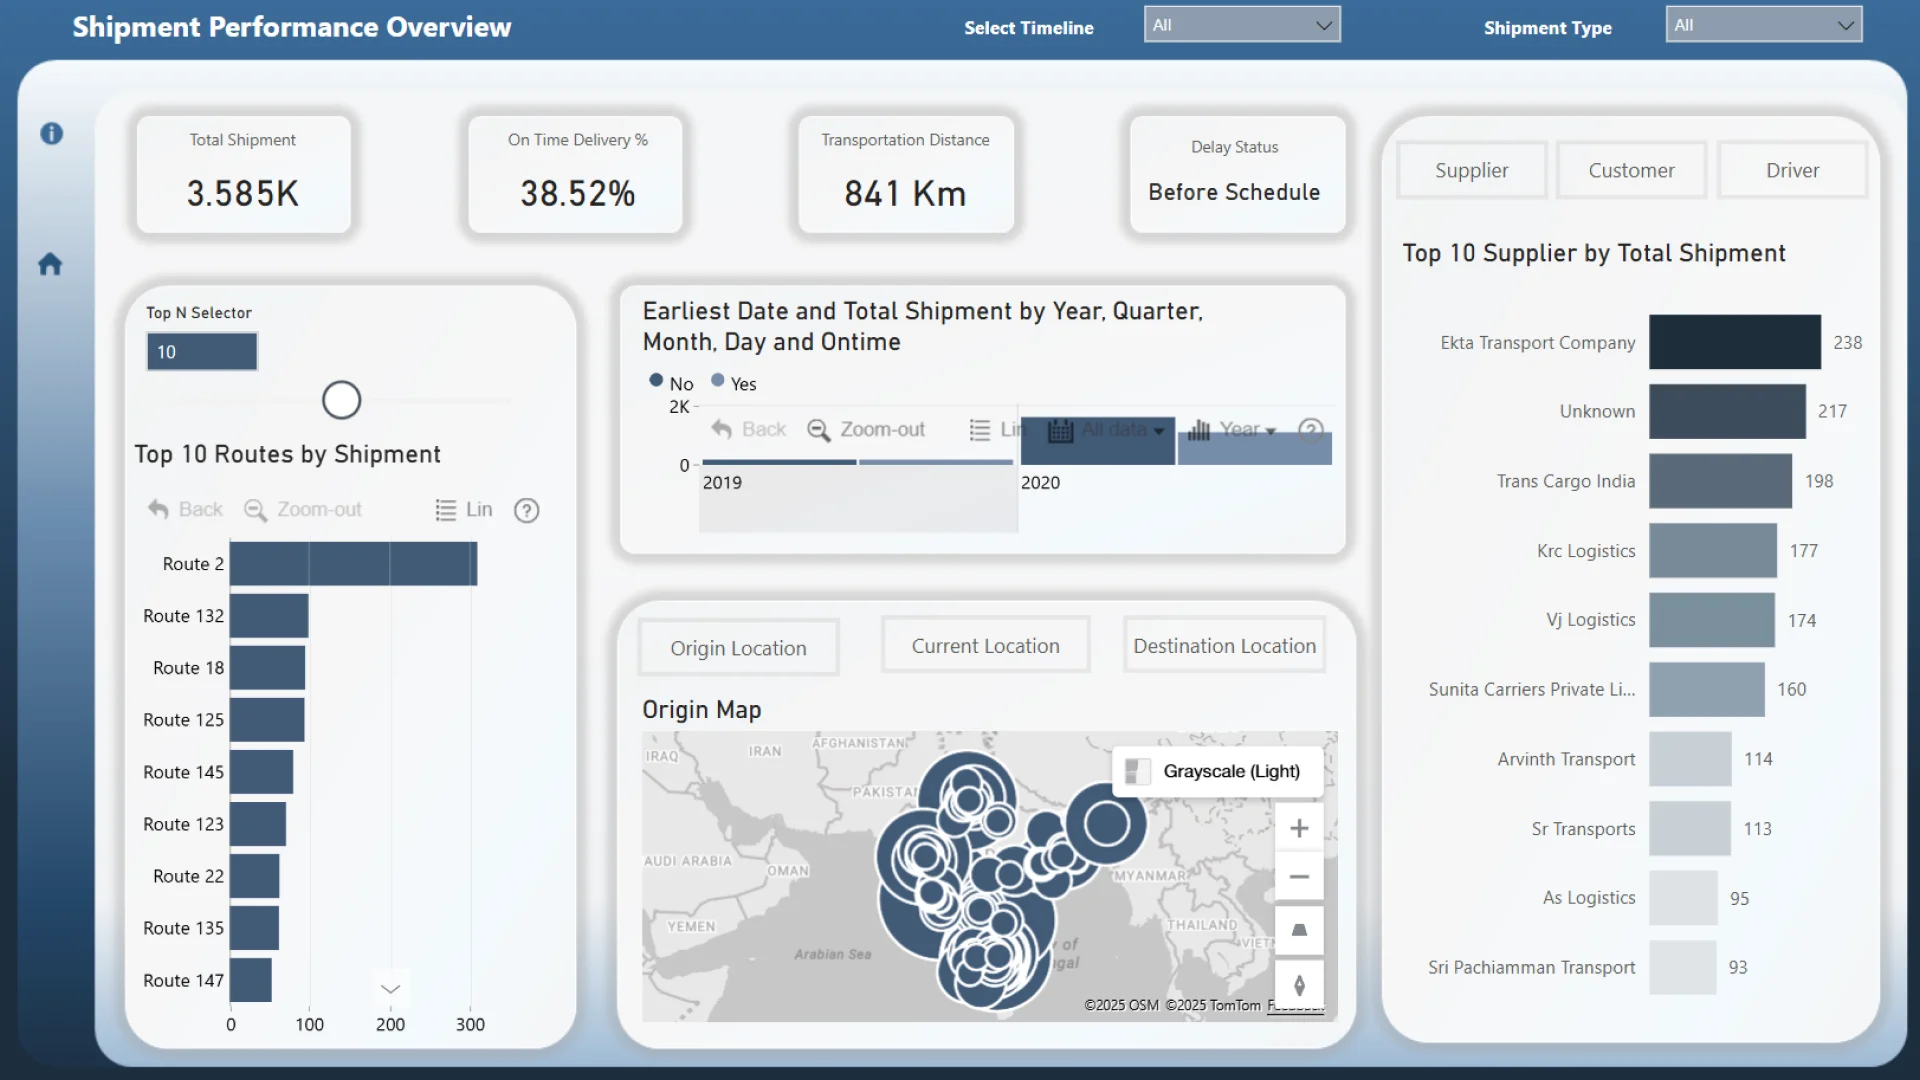
This page provides a high-level snapshot of shipment volumes, on-time delivery rates, and transportation distances. It highlights the top routes, customers, suppliers, and shipment clusters across regions, offering visibility into the overall health of the supply chain. -
Delivery Performance & Delays
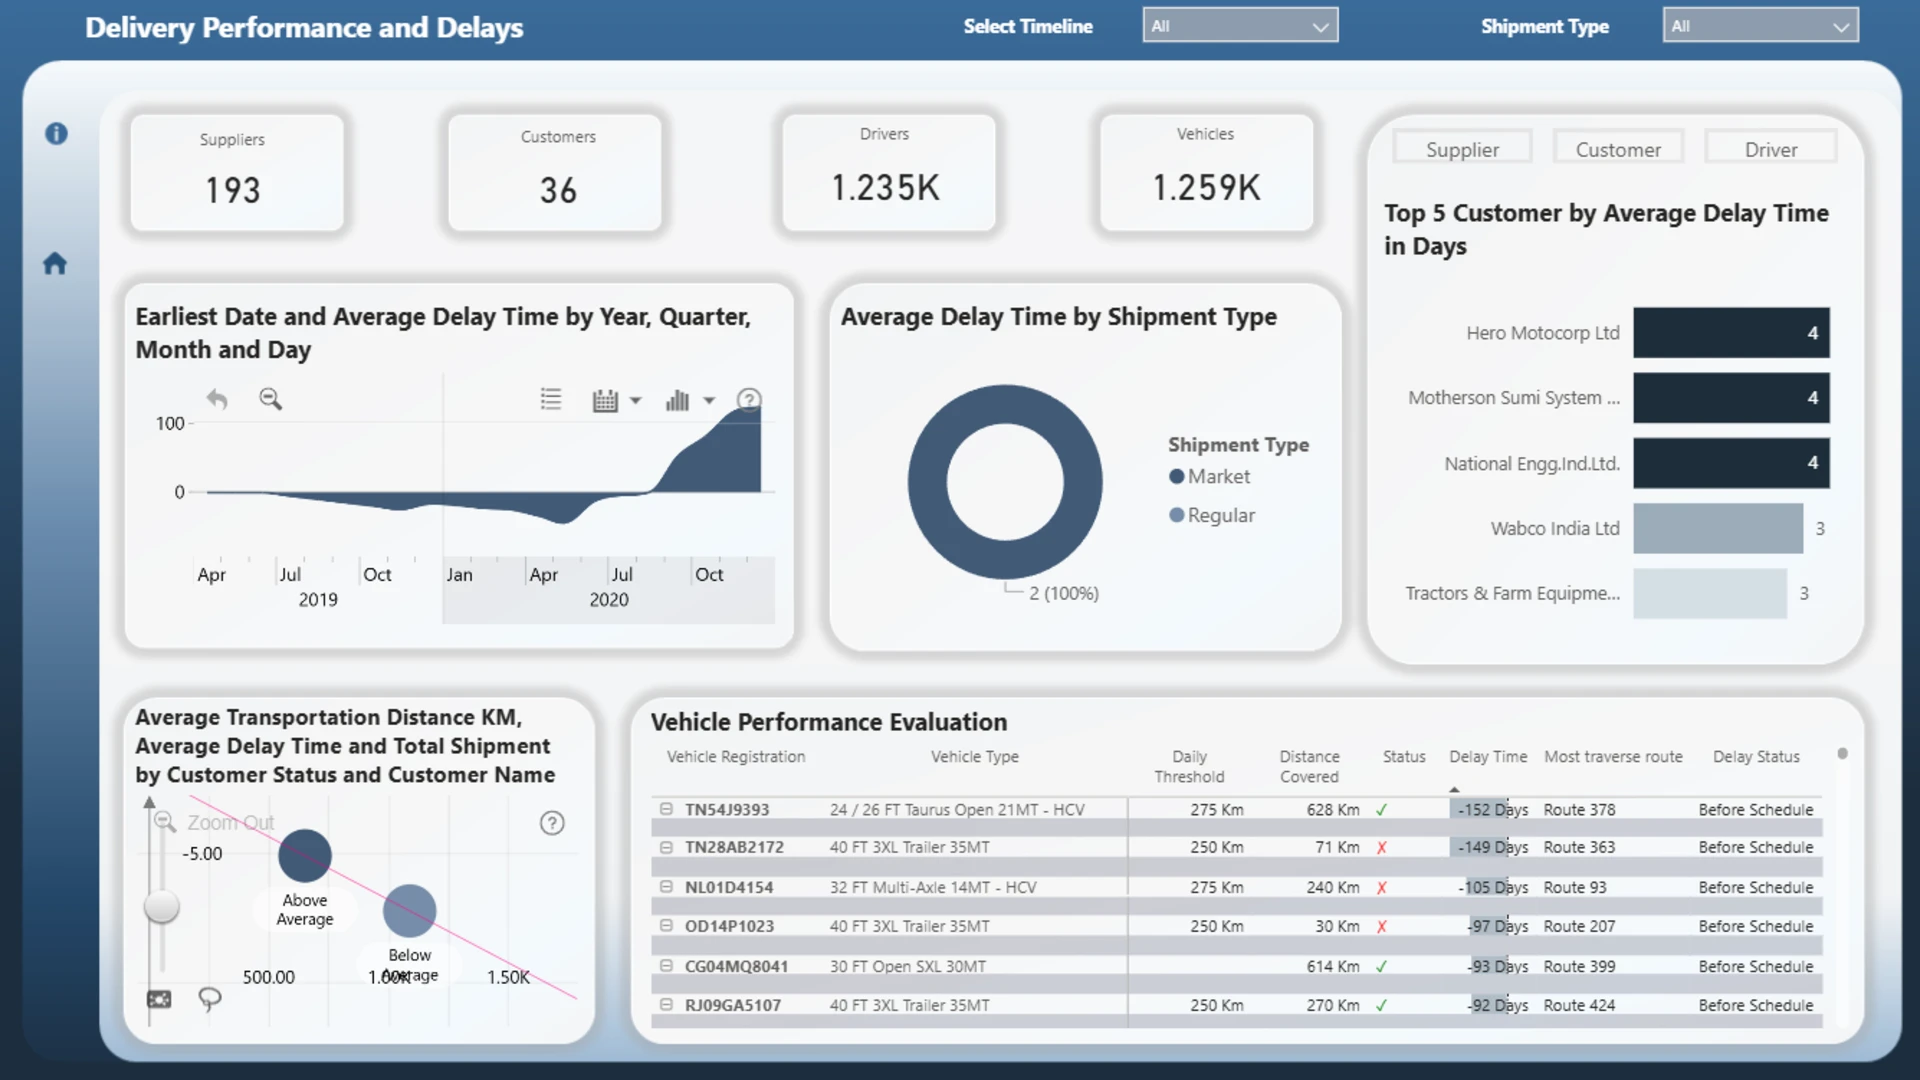
Focusing on delay analysis, this page examines average delay times, key routes, and supplier performance. It also evaluates vehicle performance, identifying which vehicles and drivers contribute to delays. Additionally, it lists the top customers impacted by delays, helping prioritize corrective actions for key accounts. -
Predictive Insights & Optimization
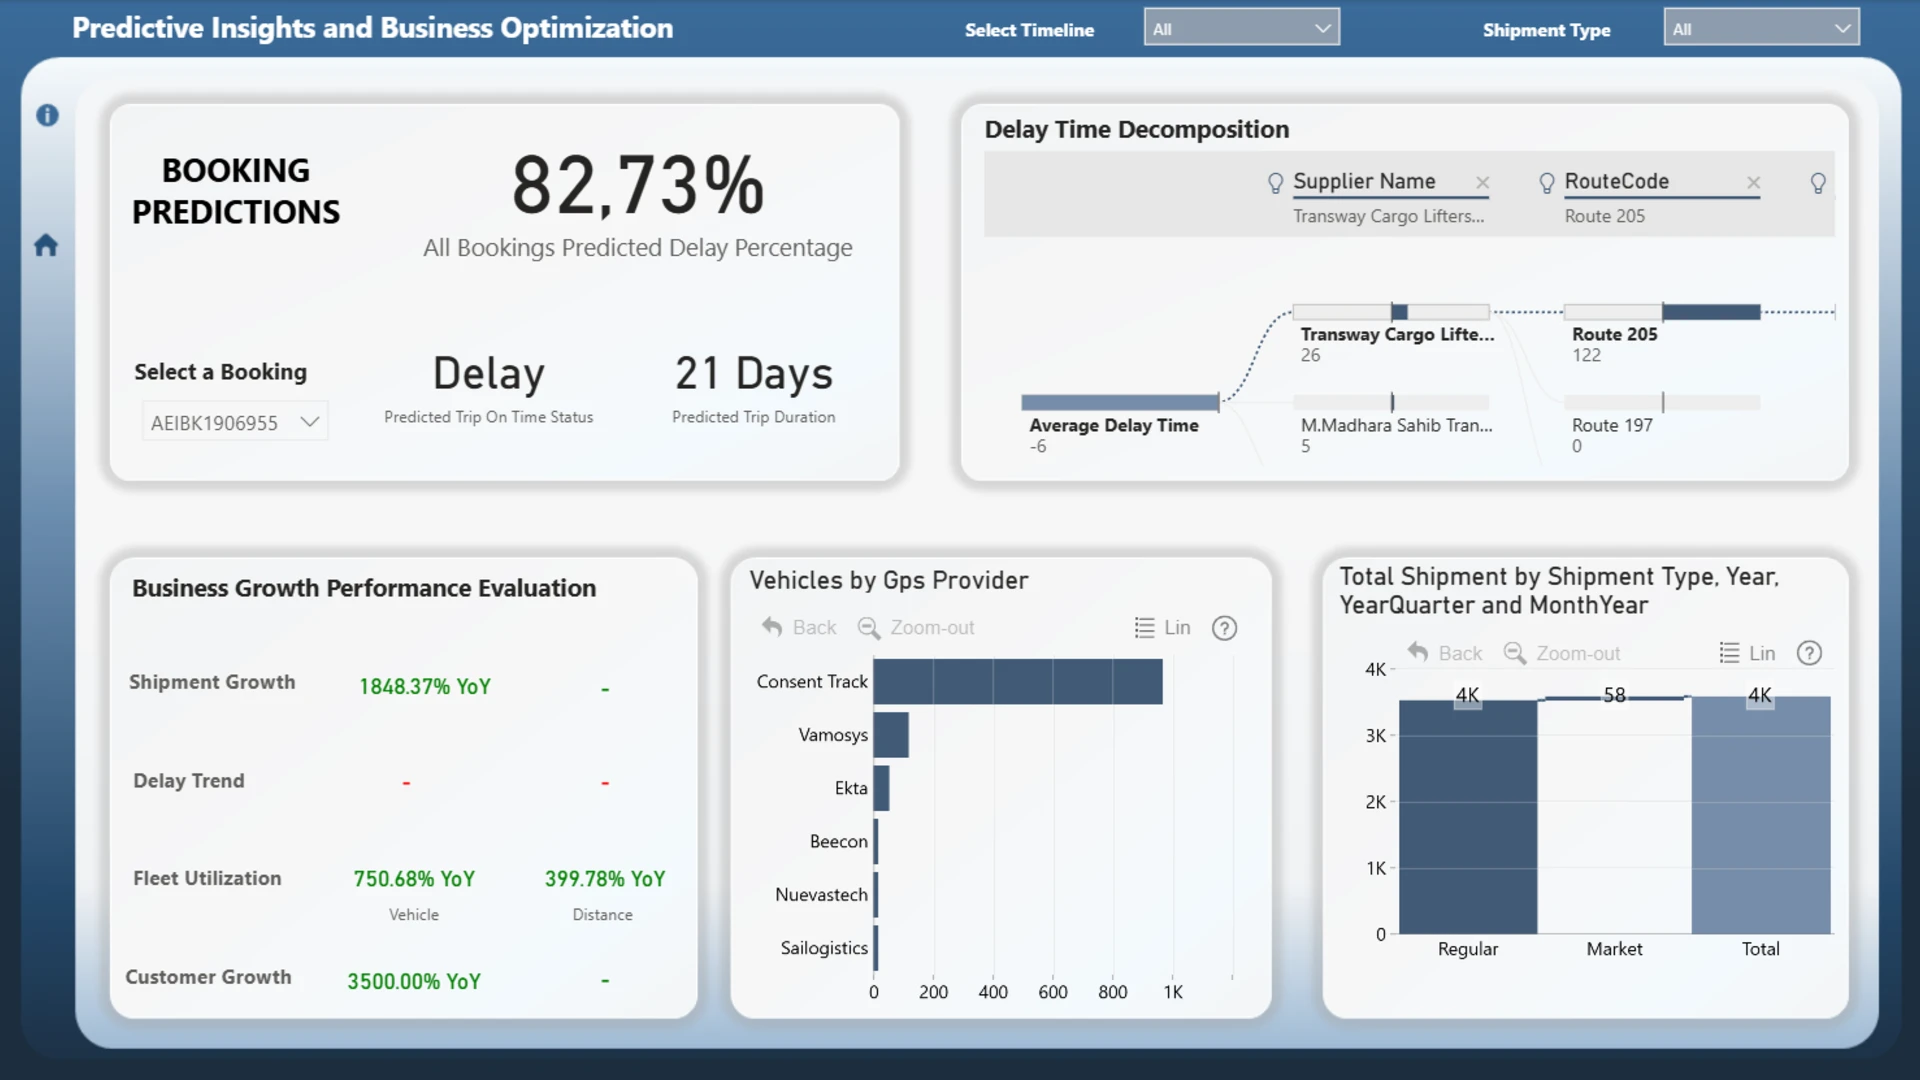
This page leverages predictive analytics using Python in Power Query to build logistic regression and XGBoost models for forecasting shipment delays, trip durations, and future risks. It presents a predicted delay rate of 82.73%, along with estimated trip durations and delay statuses for user-selected bookings. Business growth metrics—such as shipment growth, fleet utilization, and customer acquisition—are also included to help balance growth opportunities with operational risks.
ZoomCharts visuals used




4U Report Challenges
Participate in data challenges, build and submit reports to get free template downloads.
Join CommunityMobile view allows you to interact with the report. To Download the template please switch to desktop view.
How to use a PBIX template
Preview the interactive report, download the PBIX file, open it in Power BI Desktop, and replace the same data connection with your own dataset.
Preview and download
Explore the report online and download the PBIX template file.
Open in Power BI Desktop
Open the downloaded PBIX file in Power BI Desktop.
Connect your data
Replace the sample data source with your own dataset.
Refresh and adjust
Refresh the model and update fields or visual were needed.
Save and share
Save your report and publish it for your audience.


