1113
Power BI Logistics Relationships & Correlation Dashboard
Power BI Logistics Relationships & Correlation Dashboard
More Report pages
Report Author: Kaye Iara Marie Rabang
1113
Share template with others
Summary
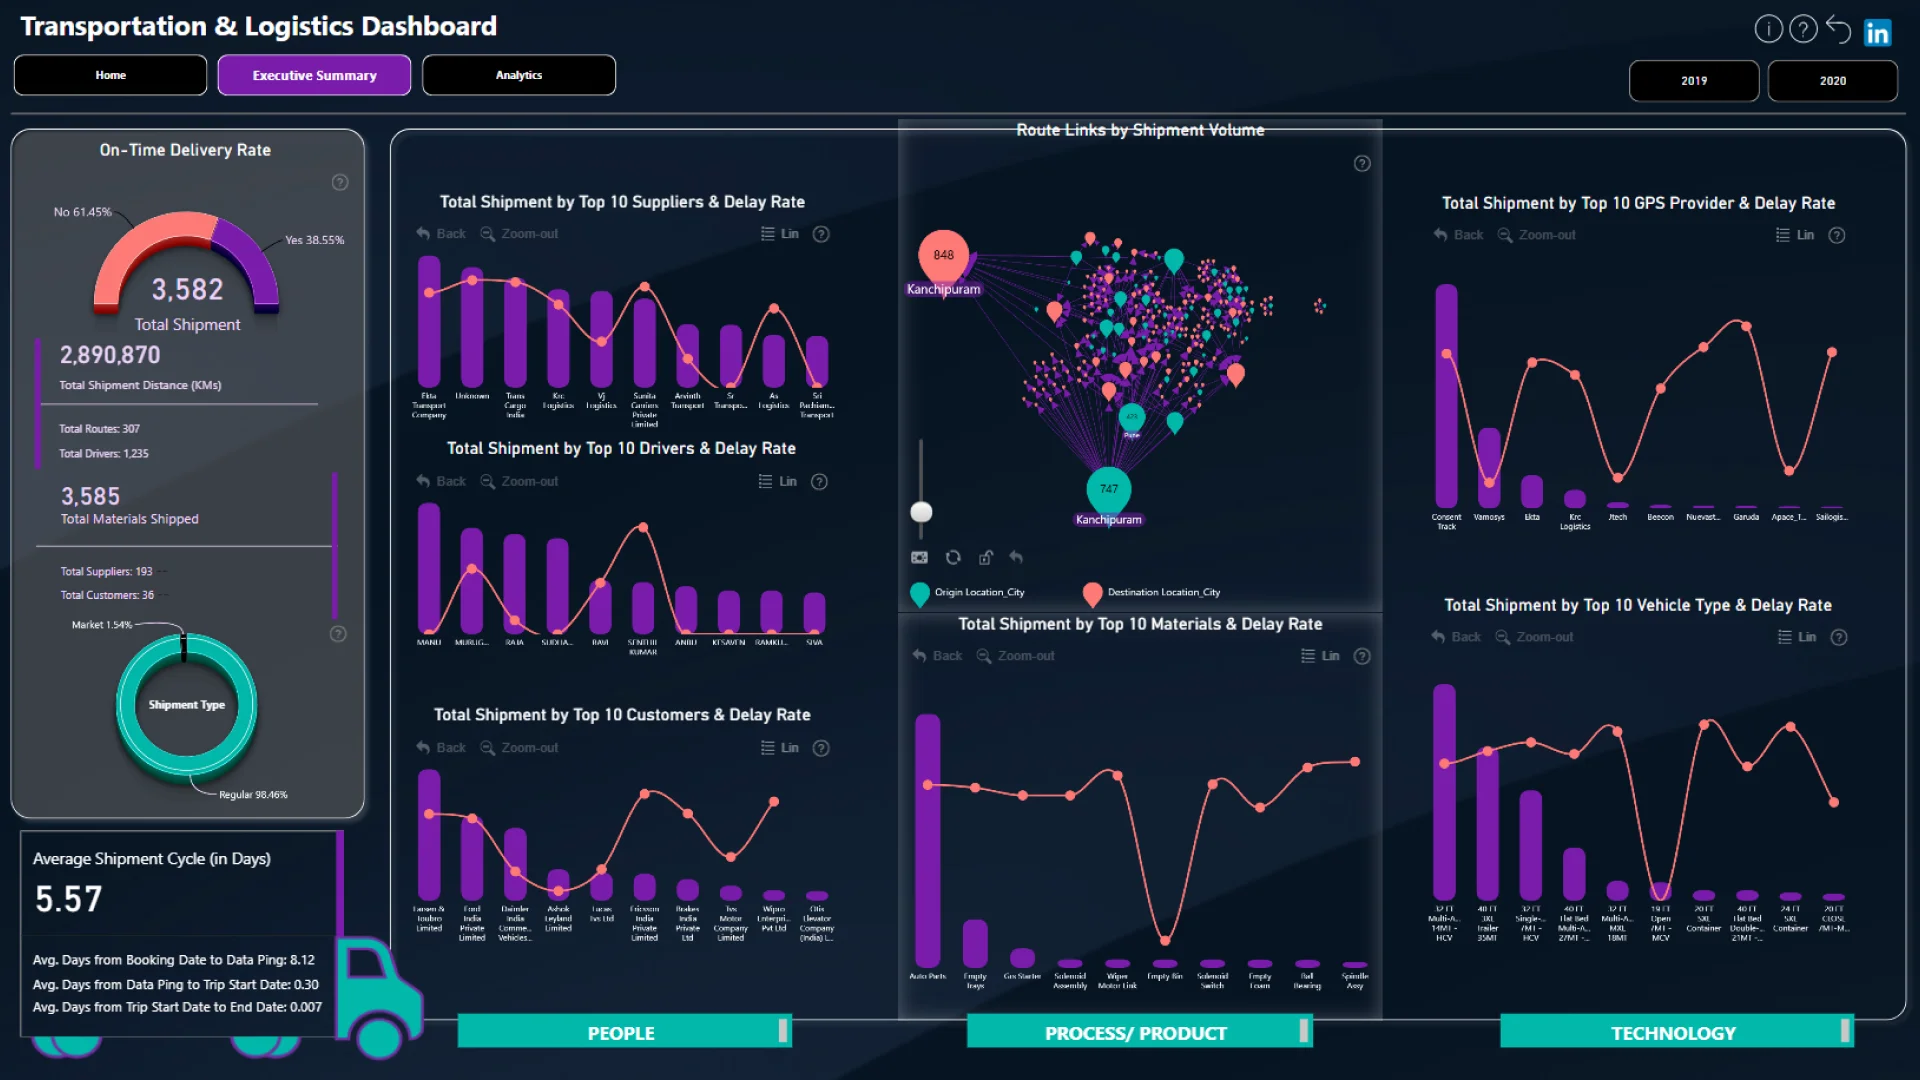
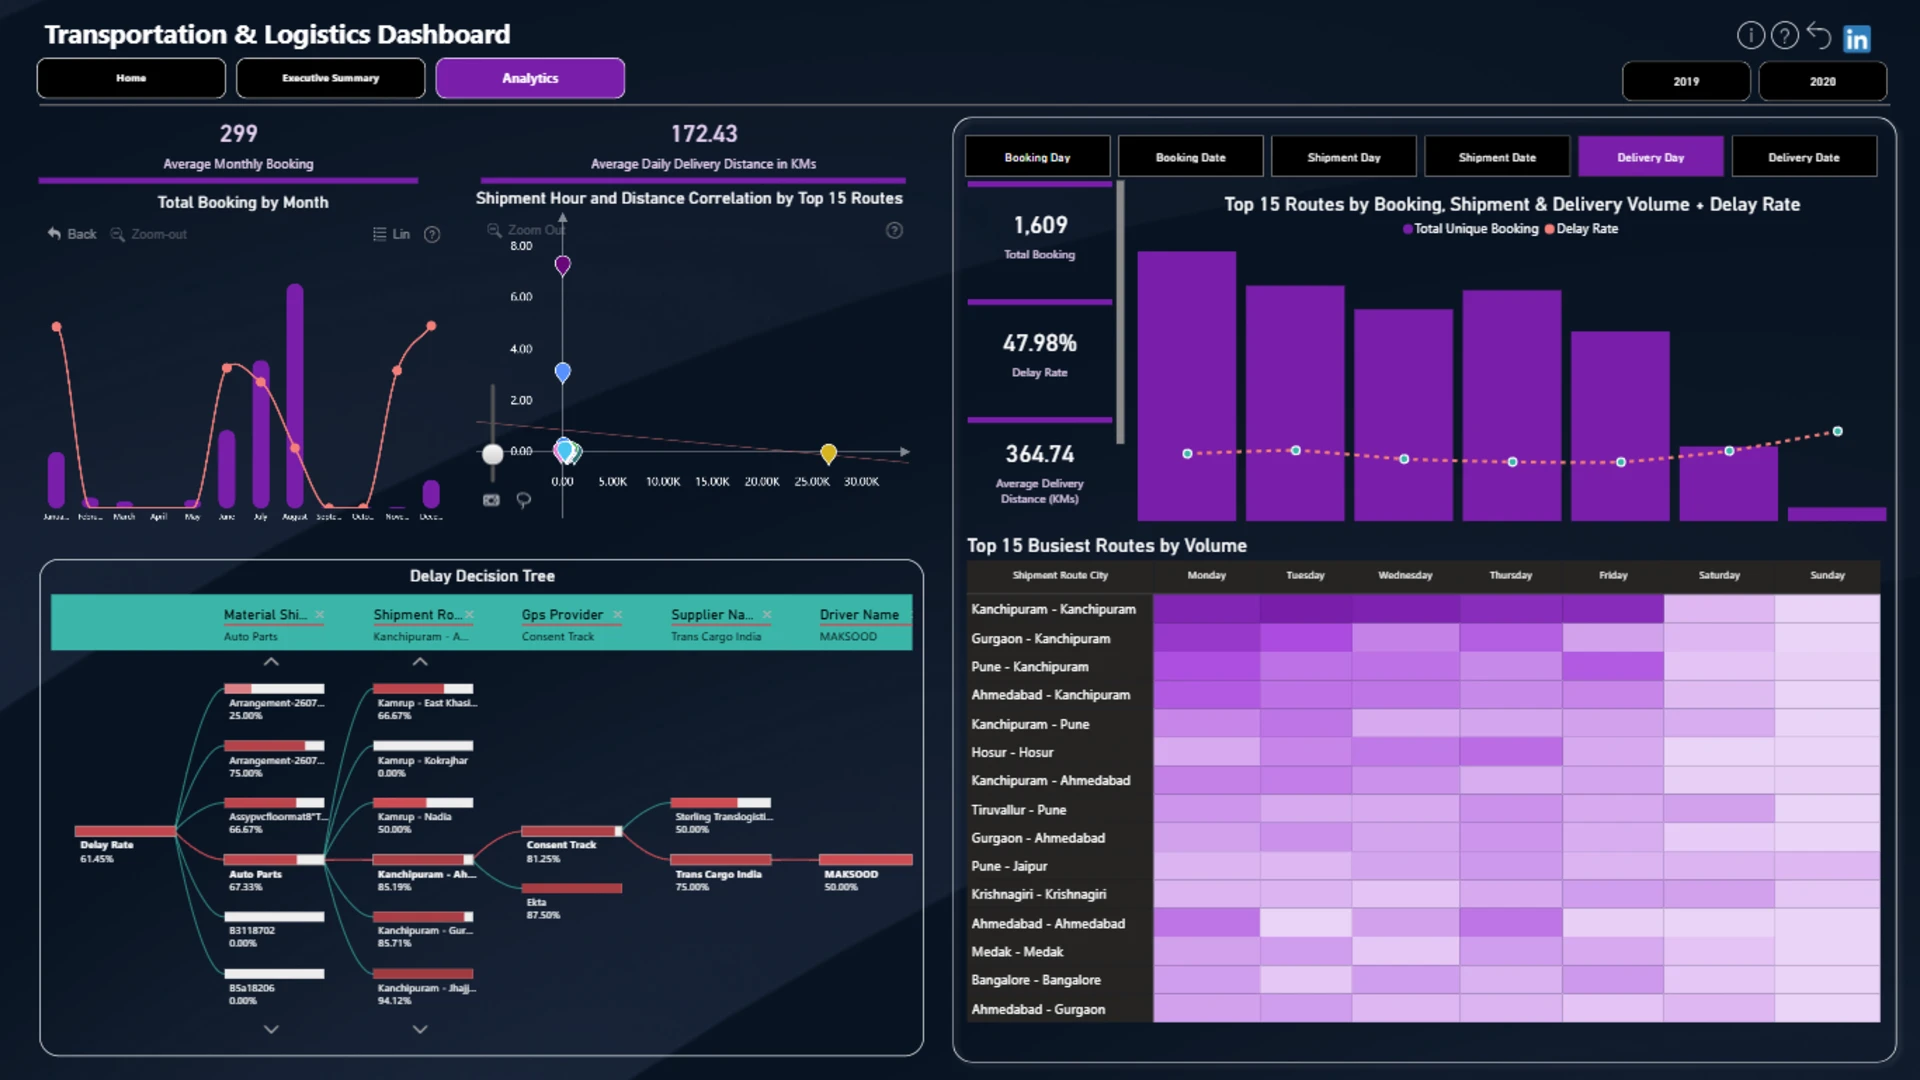
This Power BI logistics dashboard helps users explore relationships, correlations, and multi-metric patterns within transportation data. It combines several interactive analytical views to show how available logistics measures and entities relate to one another.
The report was created by Kaye Iara Marie Rabang for the February–March 2025 FP20 Analytics ZoomCharts Challenge using the Transportation & Logistics Dataset.
Key Insights of the Power BI Logistics Relationships & Correlation Dashboard
The report approaches transportation analysis through connected-data and relationship-based views. Its main analytical capabilities include:
- Correlation analysis: compare two measures and identify possible relationships, clusters, or unusual data points
- Entity relationships: explore connections between the categories and entities available in the logistics dataset
- Multi-metric trends: examine how related transportation measures change and compare within a shared visual
- Focused exploration: select individual points, series, or connected nodes to narrow the analysis
Drill Down Scatter, Combo, and Network visuals provide correlation, trend, and relationship-based perspectives. Used together, they allow users to move from overall patterns to selected data points and connected entities.
How to Use This Power BI Logistics Relationships & Correlation Dashboard
Click a scatter point, chart series, or network node to filter the related logistics data. Expand connected elements or drill into selected categories to investigate relationships and performance patterns in greater detail.
Download the PBIX template to examine the data model, calculations, report structure, and visual configuration in Power BI Desktop. Connect it to your own transportation data and adjust the measures, categories, and relationships to match your analysis requirements.



4U Report Challenges
Participate in data challenges, build and submit reports to get free template downloads.
Join CommunityMobile view allows you to interact with the report. To Download the template please switch to desktop view.



How to use a PBIX template
Preview the interactive report, download the PBIX file, open it in Power BI Desktop, and replace the same data connection with your own dataset.
Preview and download
Explore the report online and download the PBIX template file.
Open in Power BI Desktop
Open the downloaded PBIX file in Power BI Desktop.
Connect your data
Replace the sample data source with your own dataset.
Refresh and adjust
Refresh the model and update fields or visual were needed.
Save and share
Save your report and publish it for your audience.


