662
TMDB Movies Analysis
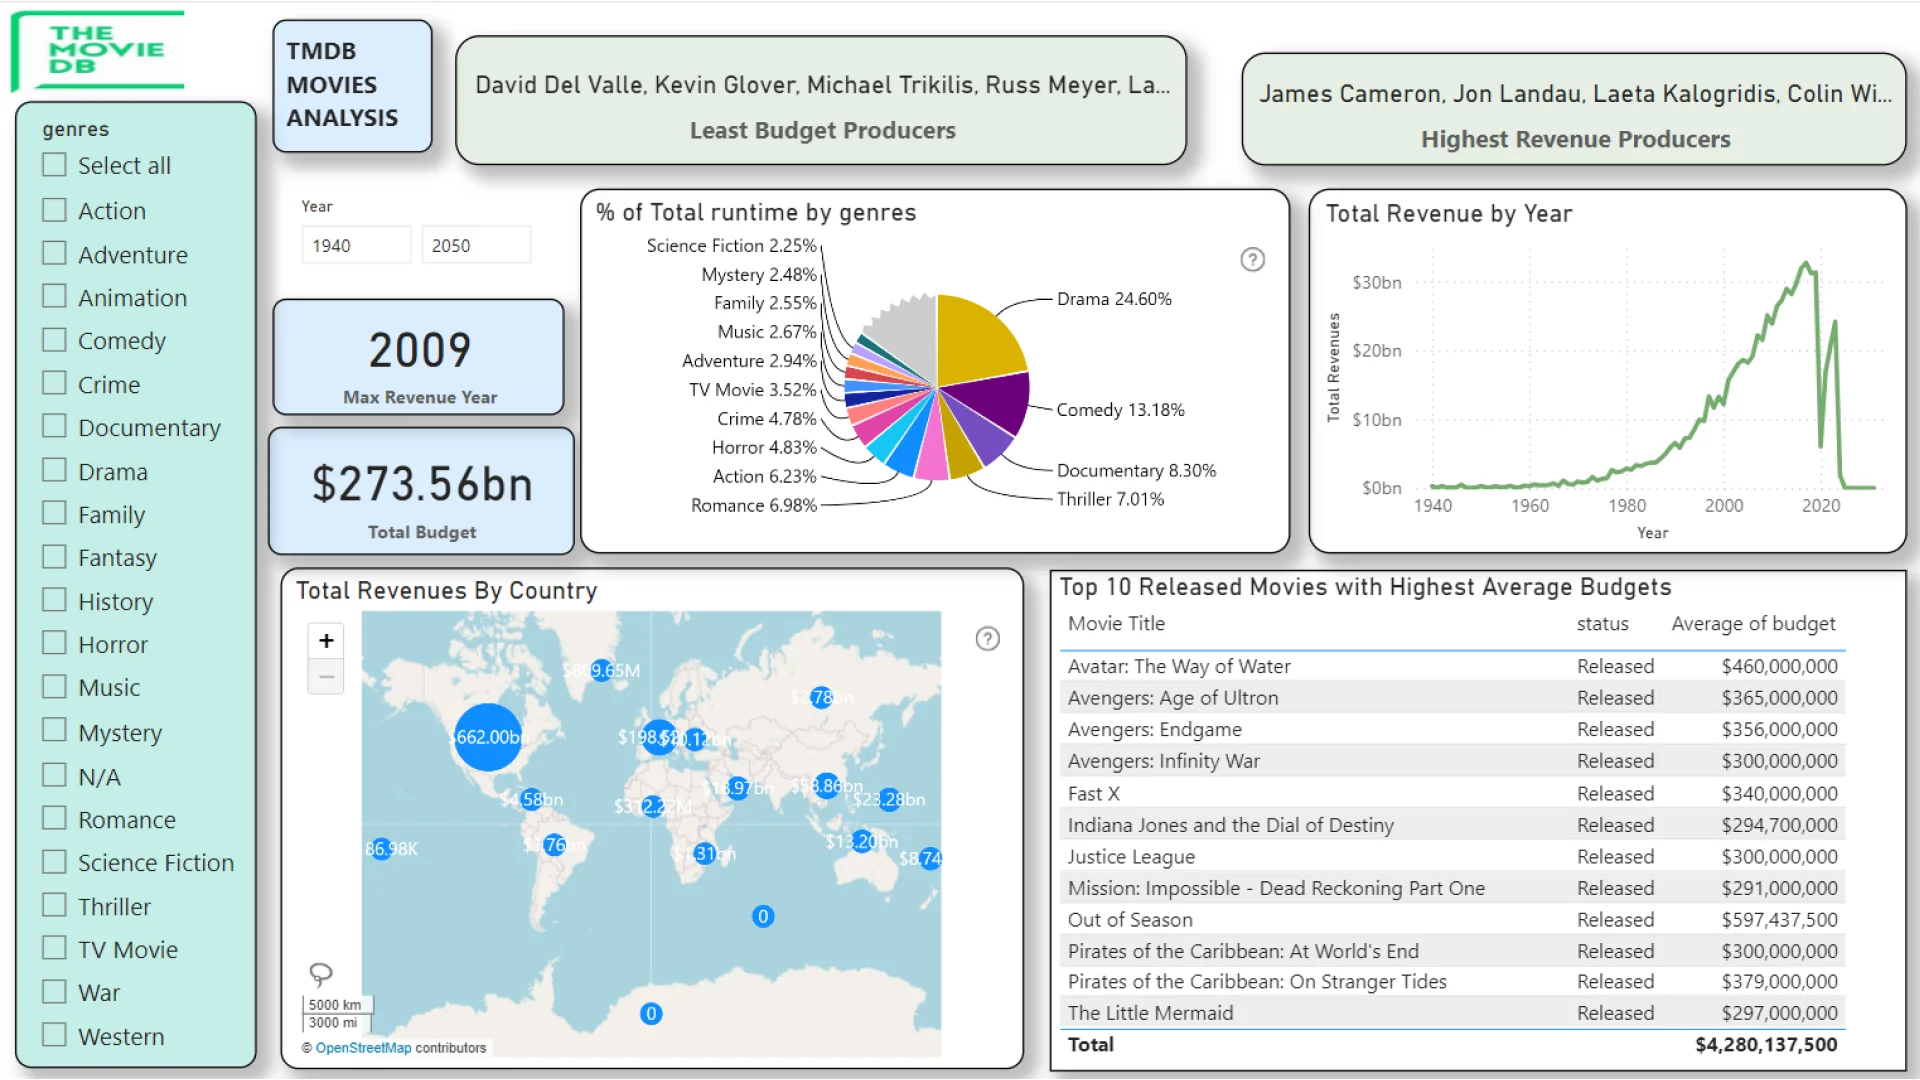
TMDB Movies Analysis
Report Author: Gori Omotola
662
Share template with others
Report submitted for Onyx Data DataDNA ZoomCharts Mini Challenge, April 2024. The report was built based on The Movie Database dataset and includes ZoomCharts custom Drill Down PRO visuals for Power BI.
Author's description:
Interactive Dashboard to determine:
1) Year with the highest revenue
2) Producers achieved the highest revenue with the lowest budget
3) Genres have seen the highest and lowest decline over time
4U Report Challenges
Participate in data challenges, build and submit reports to get free template downloads.
Join CommunityMobile view allows you to interact with the report. To Download the template please switch to desktop view.
Was this helpful? Thank you for your feedback!
Sorry about that.
How can we improve it?