904
The Electronics Scoreboard: Ratings Unleashed
The Electronics Scoreboard: Ratings Unleashed
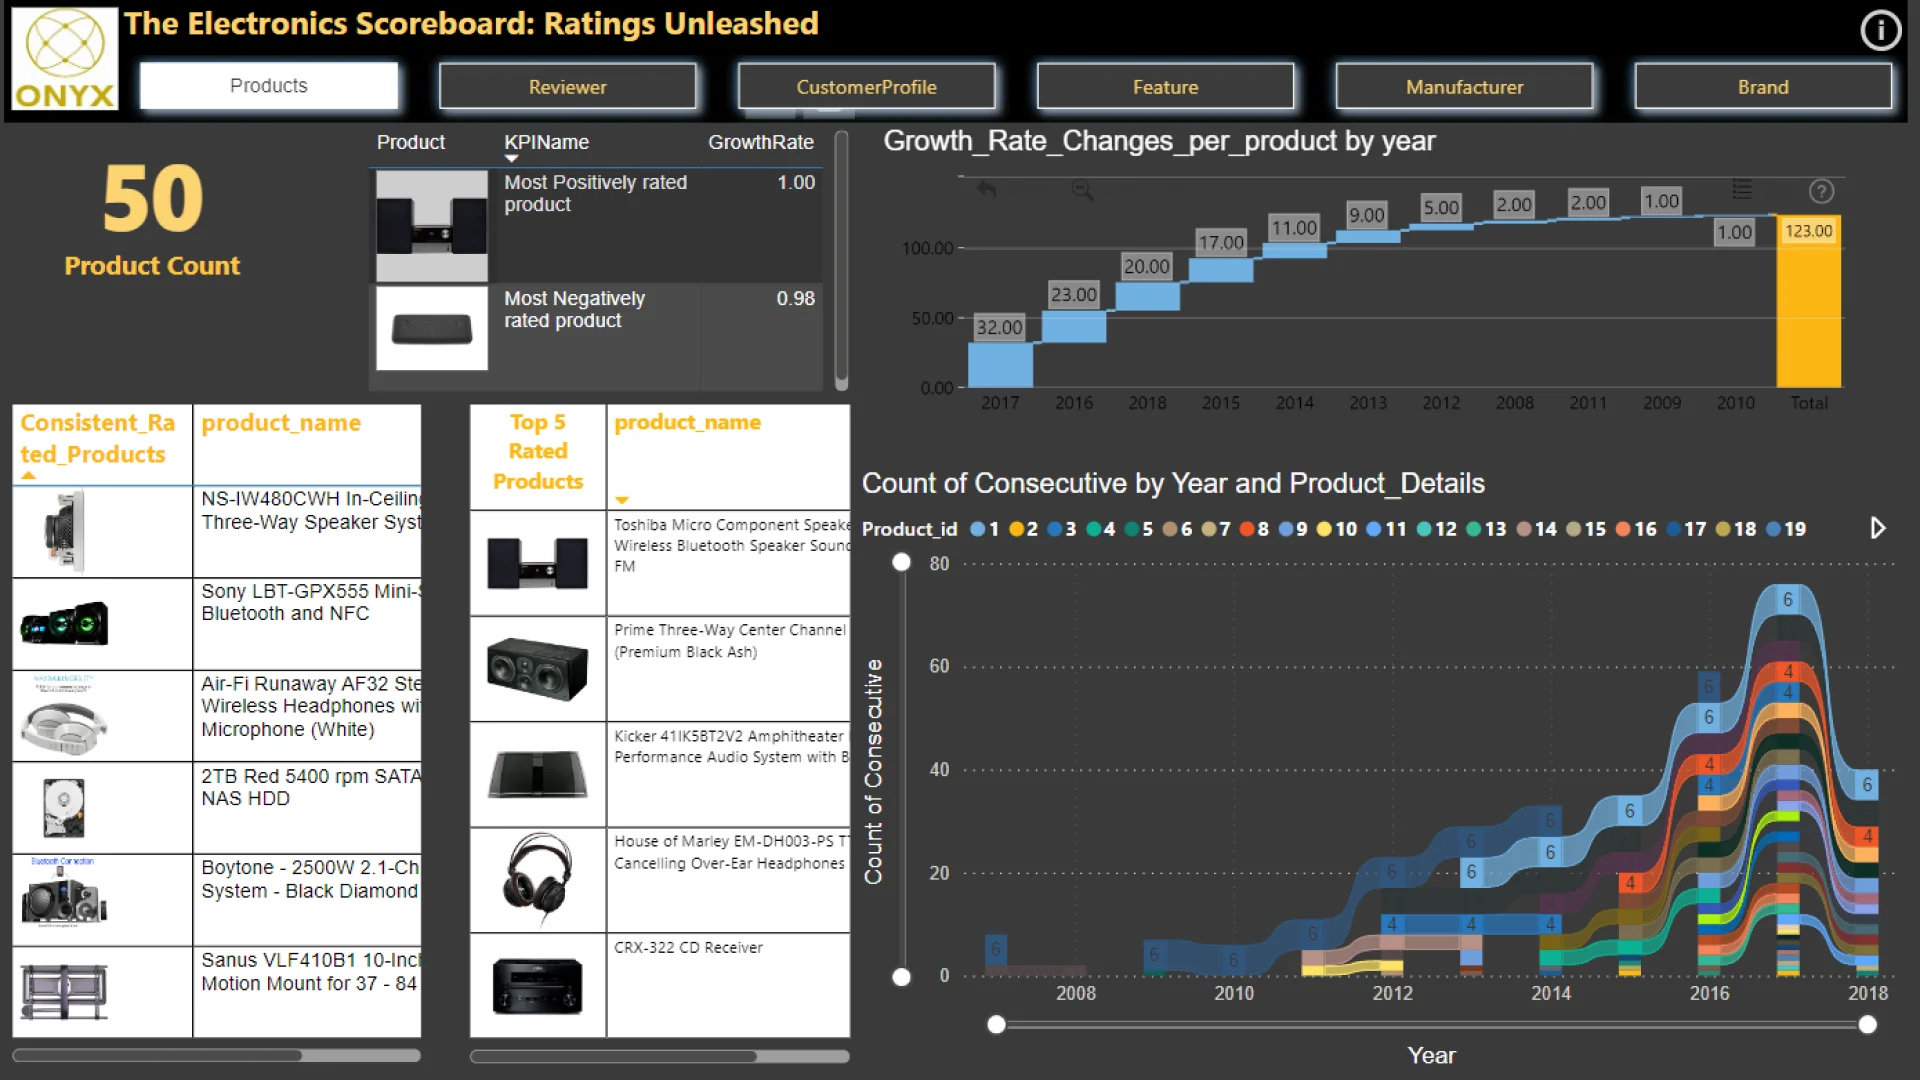
Report Author: Shraddha Shetty
904
Share template with others
Report submitted for Onyx Data DataDNA ZoomCharts Mini Challenge, February 2024. The report was built based on Electronics Product Data Ratings dataset and includes ZoomCharts custom Drill Down PRO visuals for Power BI.
Author's description:
I have successfully developed a comprehensive dashboard aimed at dissecting the intricate trends within the electronic product landscape. By scrutinizing the relationships between various factors such as product size, weight, color, and other features, I gained valuable insights into the nuanced dependencies that influence product ratings. The analysis also delved into customer behaviors, identifying and understanding loyal customers. This not only helps in acknowledging and appreciating customer loyalty but also lays the foundation for personalized marketing strategies. Moreover, the dashboard enabled me to pinpoint products that have consistently maintained high ratings. This insight is instrumental in recognizing the attributes or features that contribute to a positive customer experience and can be replicated in future product development. Additionally, I have formulated customer profiles that offer a deeper understanding of preferences. This information is invaluable for businesses, as it allows for the tailoring of products and services to meet specific customer needs.
ZoomCharts visuals used





4U Report Challenges
Participate in data challenges, build and submit reports to get free template downloads.
Join CommunityMobile view allows you to interact with the report. To Download the template please switch to desktop view.
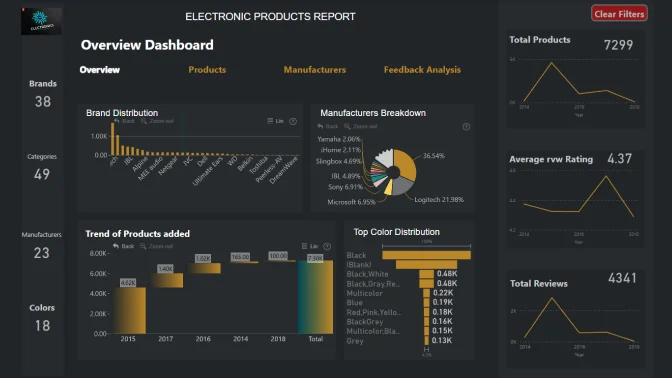
How to use a PBIX template
Preview the interactive report, download the PBIX file, open it in Power BI Desktop, and replace the same data connection with your own dataset.
Preview and download
Explore the report online and download the PBIX template file.
Open in Power BI Desktop
Open the downloaded PBIX file in Power BI Desktop.
Connect your data
Replace the sample data source with your own dataset.
Refresh and adjust
Refresh the model and update fields or visual were needed.
Save and share
Save your report and publish it for your audience.


