logo
For Power BI
  • Products
    • Custom Visuals for Power BI
    • Report Templates
  • Resources

      Resources

    • Documentation
    • Report Examples
    • Blog
    • Webinars
    • Video Tutorials
    • Visuals Gallery

    Support

    • ZoomCharts Assistance
    • Contact Sales
    • Contact Support
    • FAQ

    Challenges

    Challenges

    Improve your report creation skills by participating in free challenges for report creators.

    Learn more
    Get Developer License
  • Services
    • Power BI Report Development
    • Custom Visual Development
  • Challenges
  • Pricing
    • Custom Visuals for Power BI
    • Report Templates
Subscribe
Subscribe
Get it now
Go back

Contents

Contest logo
Contest logo
Contest logo
Contest logo
Try Free Now
Go back

Onyx Data May 2024 Challenge

Report Author: Miikka Karava

80

Technical Support Tickets Analysis

Report
Report Interact

Timeline Map Donut Support Customer experience Project Management

Share template with others

Report submitted for Onyx Data DataDNA ZoomCharts Mini Challenge, May 2024. The report was built based on Tech Support Analysis dataset and includes ZoomCharts custom Drill Down PRO visuals for Power BI. 

Author's description:
Hello! this is my submission to the Onyx Data May 2024 Challenge.
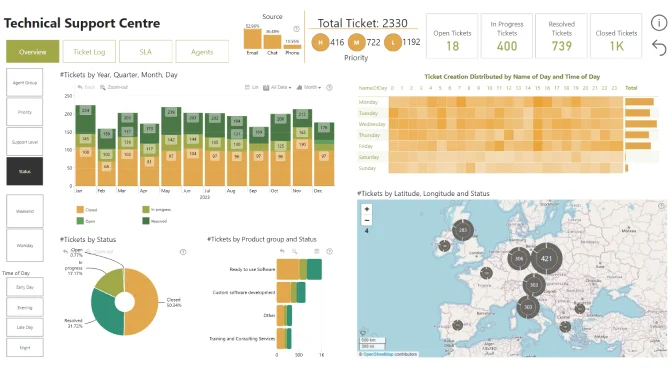
The top left section features dynamic filter panel for broader insights, a MoM and QoQ views for tickets. The bar on right displays cumulative ticket amount on left and on the middle tickets by quarter. Next to it the map acts as a region filter and displays ticket amount by region.
The Report has 4 views for different insight.
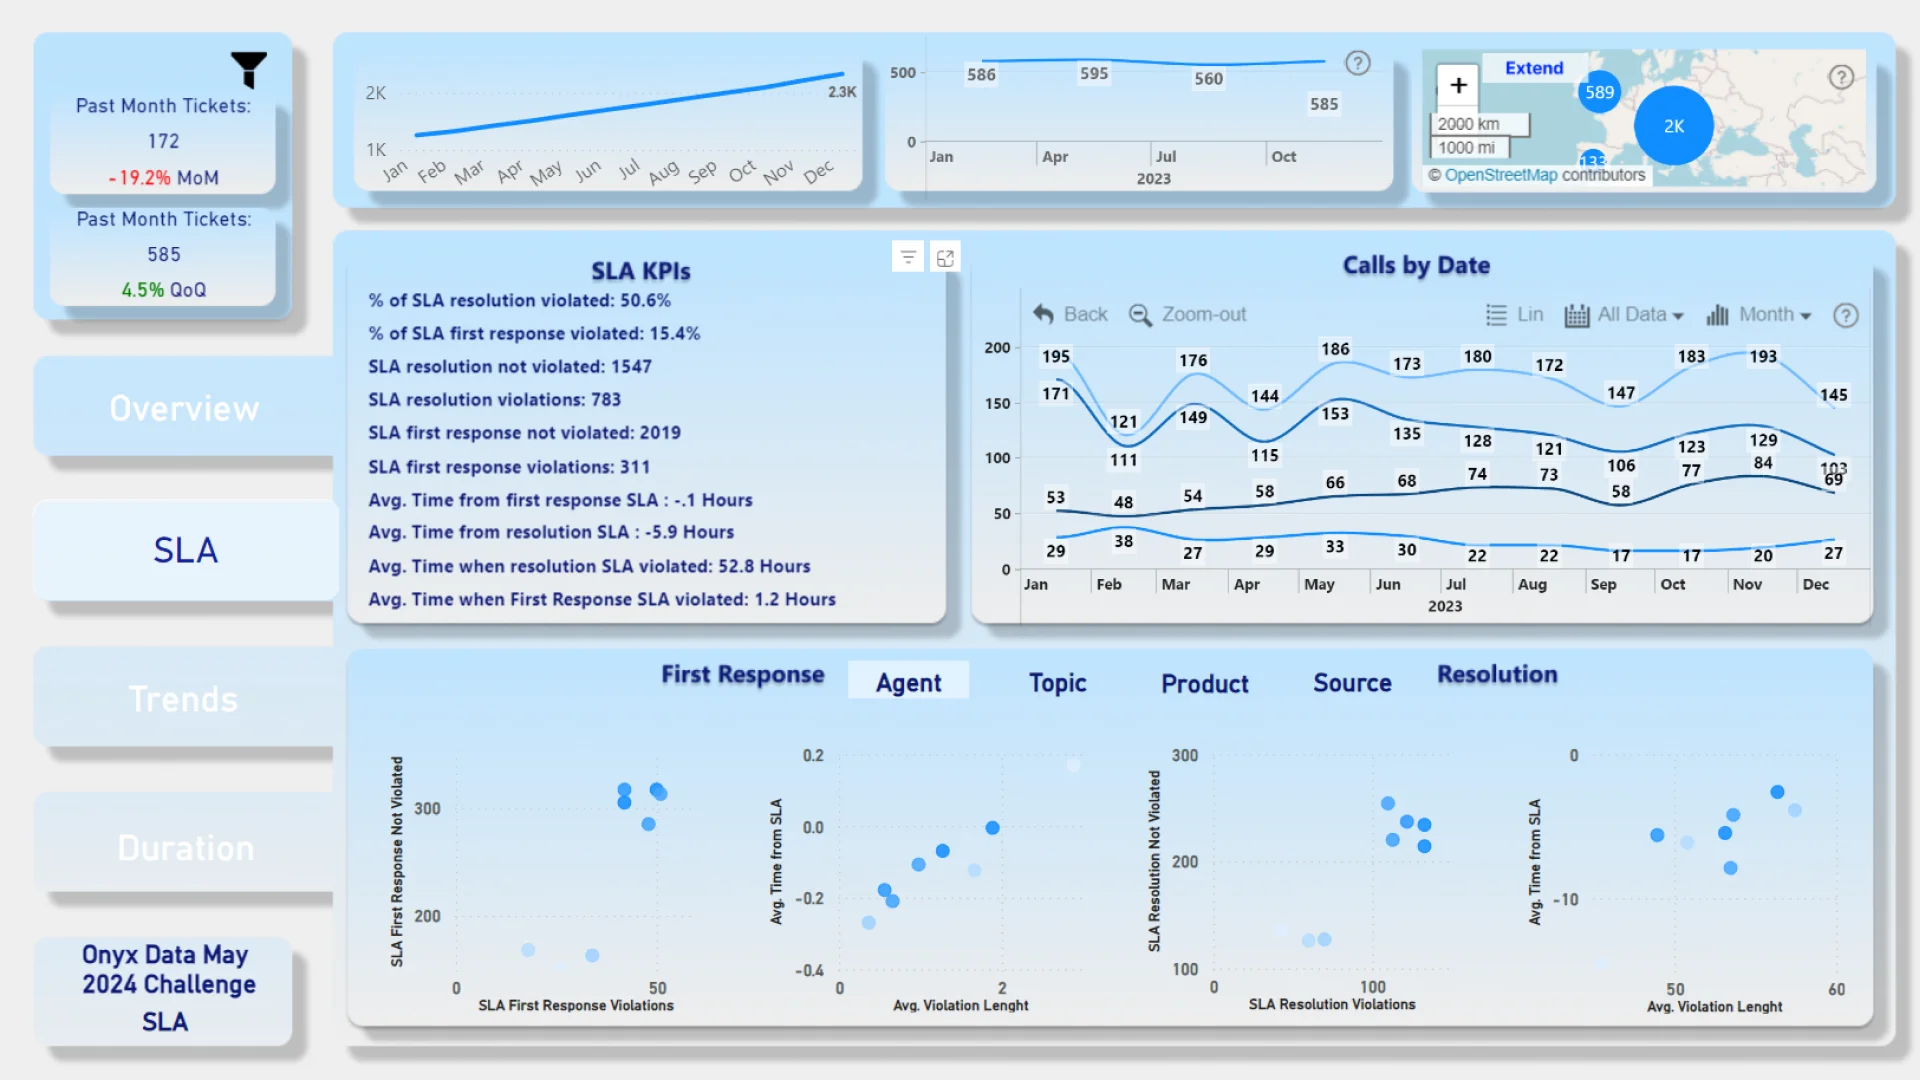
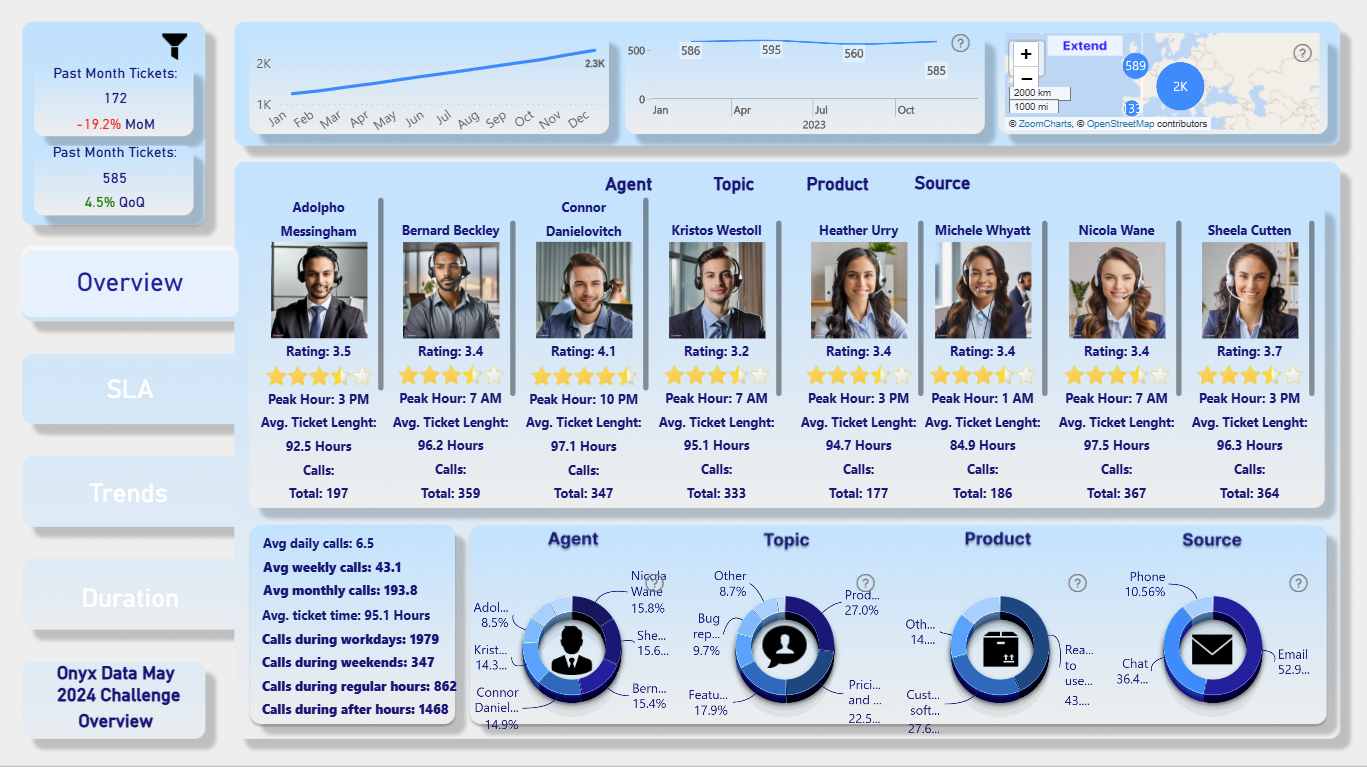
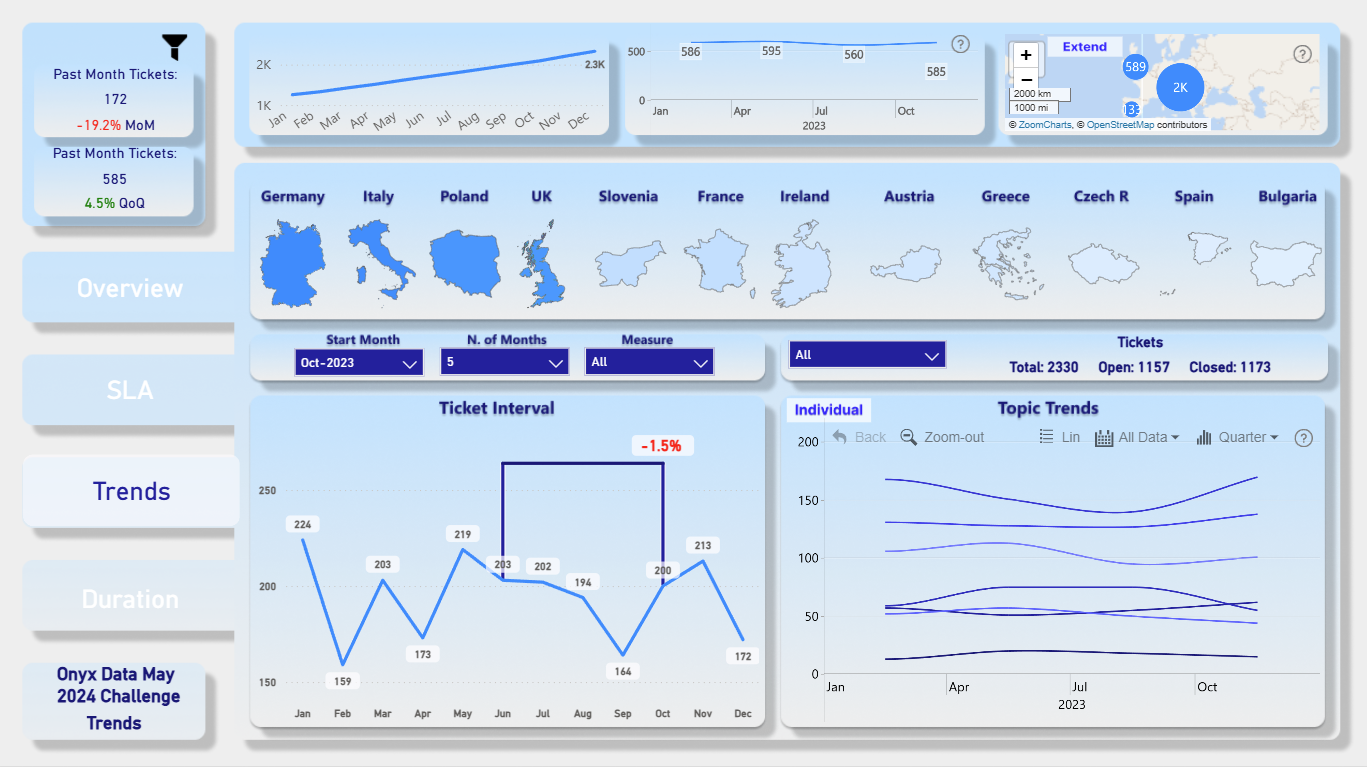
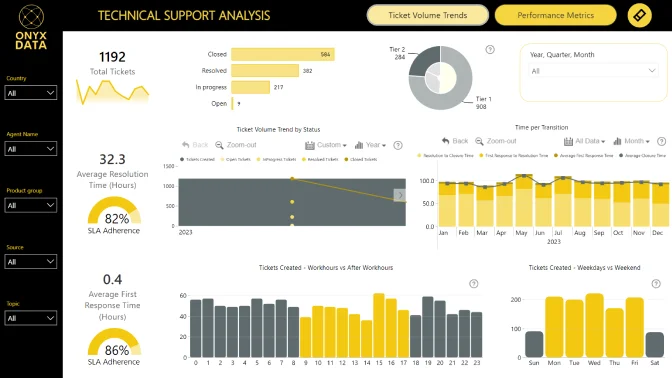
The first view is an overview with insight about agents, ticket topics, product categories and contact source. On bottom left, a KPI panel displays daily, weekly and monthly volumes and average ticket length. The second view displays insights about service level agreements for first response and resolution. The left KPI section shows SLA violation data for number of violations, violation length and % of violations compared to tickets within SLA. The right line visual displays SLA violations in a chosen time interval. The bottom section displays separate views for SLA violations for agent, topic, product, and source. The Third view displays ticket trends. The top section features insight by customer’s country in a given interval. The second line visual below displays ticket trends by chosen interval and measure.
You can choose the measure from different time intelligence such as daily, weekly and monthly averages or view SLA data for resolution and first response. The bottom right visual displays ticket amounts for different topics. You can compare topics one by one or all at once.
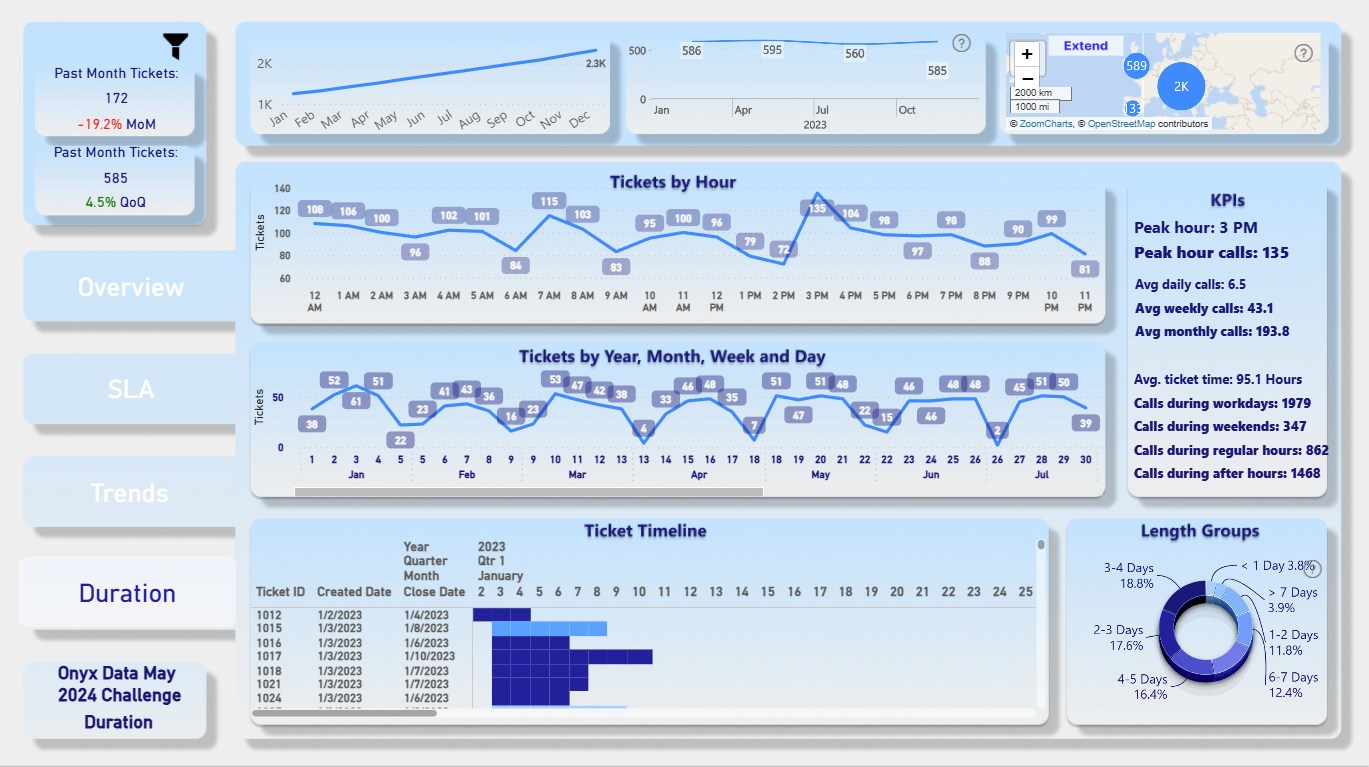
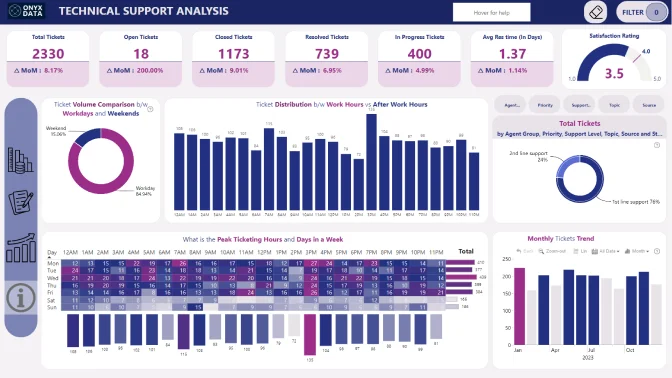
The fourth and final view displays data about ticket duration. The first visual displays tickets by creation hour. The visual below displays tickets by year, month, week and day. The bottom timeline shows individual tickets by their length, creation and close date and if they violated SLA or not. The final gauge groups tickets by their length.

ZoomCharts visuals used

Drill Down Map PRO Drill Down Map PRO
Drill Down Timeline PRO Drill Down Timeline PRO
Drill Down Donut PRO Drill Down Donut PRO

Need help?

Send your question to ZoomCharts assistant, and we will respond to you as soon as possible.

Contact Us

Mobile view allows you to interact with the report. To Download the template please switch to desktop view.

Report Overhaul

ZoomCharts Academy

Learn ZoomCharts with experts and become certified!

Go to Academy!
Report Overhaul

Was this helpful? Thank you for your feedback!

Sorry about that.

How can we improve it?

Technical Support Tickets Analysis

Share

ZoomCharts

Welcome to ZoomCharts

You’re almost there! Create an account to keep your saved reports.

or
Sign up with Microsoft

Verify your email address

We have sent a code to your email address. Please input the code below.

Didn't receive code? Request again (after 30 seconds)

Already have an account? Log in

ZoomCharts

Log in to your ZoomCharts account

Log in with Microsoft
or
Forgot password?

Reset your password

We'll email you instructions on how to reset your password

Don't have an account? Sign up

Please add credits

You have 0 available downloads.
Get more credits or upgrade your plan to continue.

View pricing
logo
[email protected]
+44 204 577 3993
logo

Products

Drill Down Network PRO Drill Down Waterfall PRO Drill Down Graph PRO Drill Down Combo PRO Drill Down Combo Bar PRO Drill Down Donut PRO Drill Down Pie PRO Drill Down TimeSeries PRO Drill Down Timeline PRO Drill Down Map PRO Drill Down Scatter PRO All Visuals

Resources

Report Examples Webinars Blog ZoomCharts Academy Visuals Gallery Documentation Custom Visual Development Subscribe to News

Solutions

Custom Visual Development

Company

Pricing About Us Partners Leave feedback Join PowerGroup EU Funding

Help

ZoomCharts Assistance Contact Sales Contact Support FAQ

Drill Down Network PRO Drill Down Waterfall PRO Drill Down Graph PRO Drill Down Combo PRO Drill Down Combo Bar PRO Drill Down Donut PRO Drill Down Pie PRO Drill Down TimeSeries PRO Drill Down Timeline PRO Drill Down Map PRO Drill Down Scatter PRO All Visuals

Report Examples Webinars Blog ZoomCharts Academy Visuals Gallery Documentation Custom Visual Development Subscribe to News

Custom Visual Development

Pricing About Us Partners Leave feedback Join PowerGroup EU Funding

ZoomCharts Assistance Contact Sales Contact Support FAQ
+44 204 577 3993
[email protected]

Ready to get in touch?

Contact our experts with any question about Power BI and ZoomCharts for Free!

Contact us

© 2025, Data Visualization Software Lab

U.S. Patents No. 11,645,343; 11,921,804; 12,346,389

Cookies
Privacy Policy
Global
Legal
Patent
warning

Error message

success

Success info: Done!

ZoomCharts AI Assistant

We noticed you're using an old OS version.

For the best experience, we recommend upgrading to ensure that all website features display correctly.

Cookie settings

We use necessary cookies for site functionality, as well as statistic, marketing, and preference cookies to enhance your experience. For more information and to manage your preferences, please visit our Cookie policy