1026
Supply chain performance 2
Supply chain performance 2
More Report pages
Report Author: Fagbuaro Blessing
1026
Share template with others
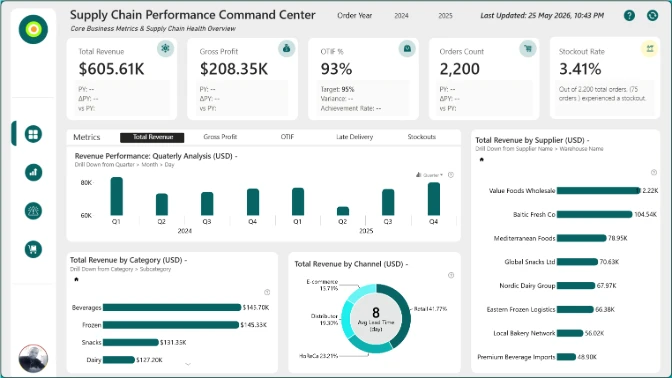
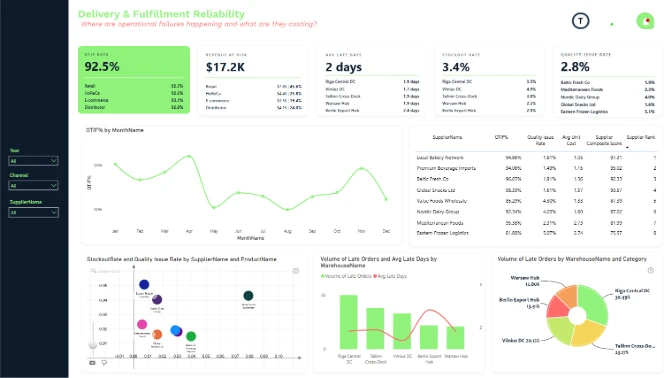
Report submitted for Onyx Data DataDNA ZoomCharts Mini Challenge, November 2024. The report is based on the Supply Chain Analysis dataset and includes ZoomCharts custom Drill Down PRO visuals for Power BI.
Author's description:
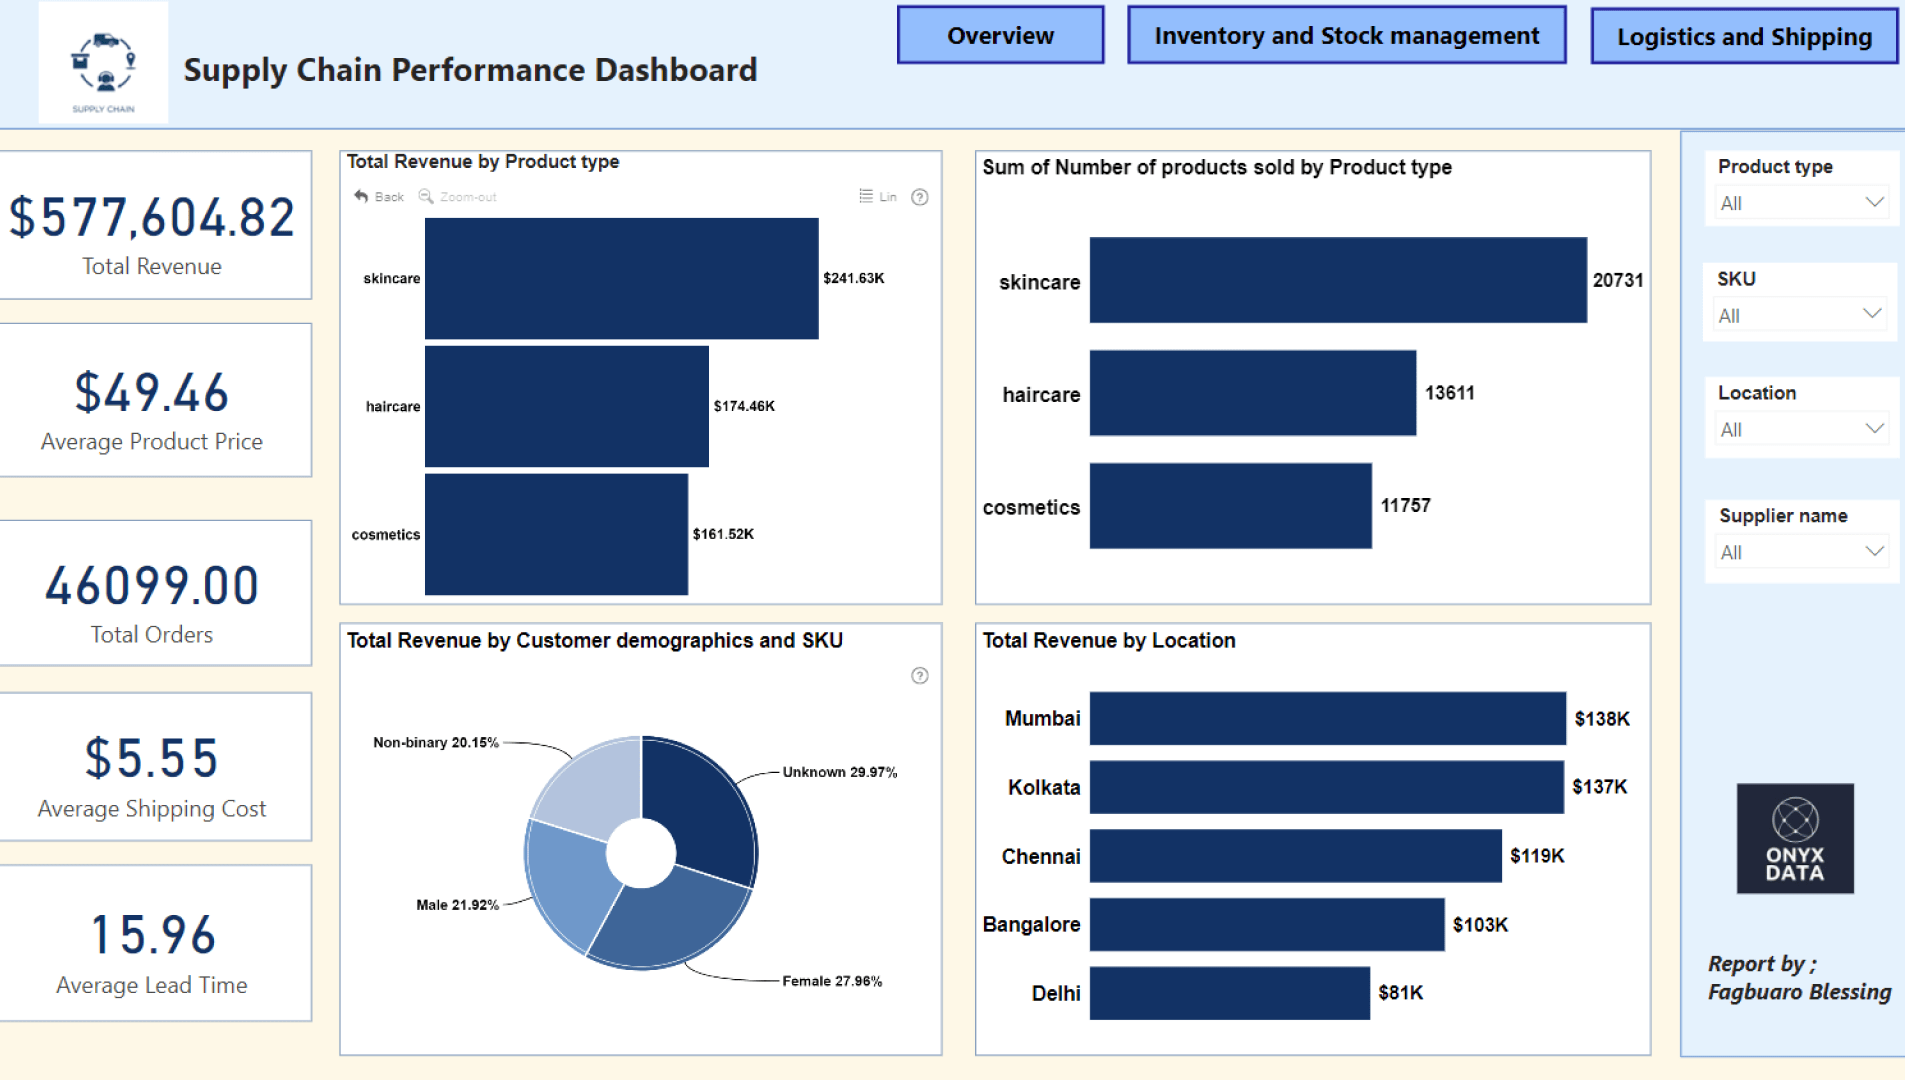
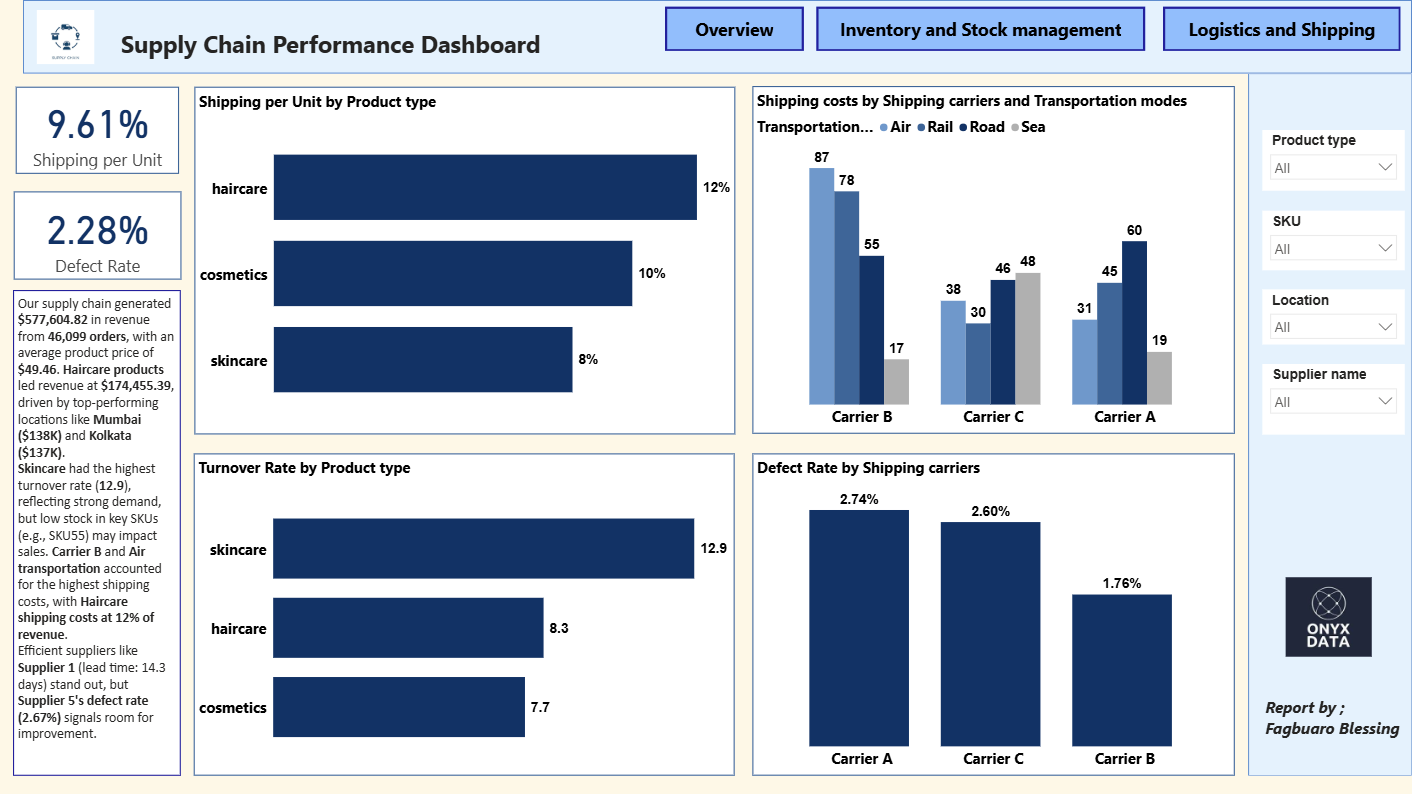
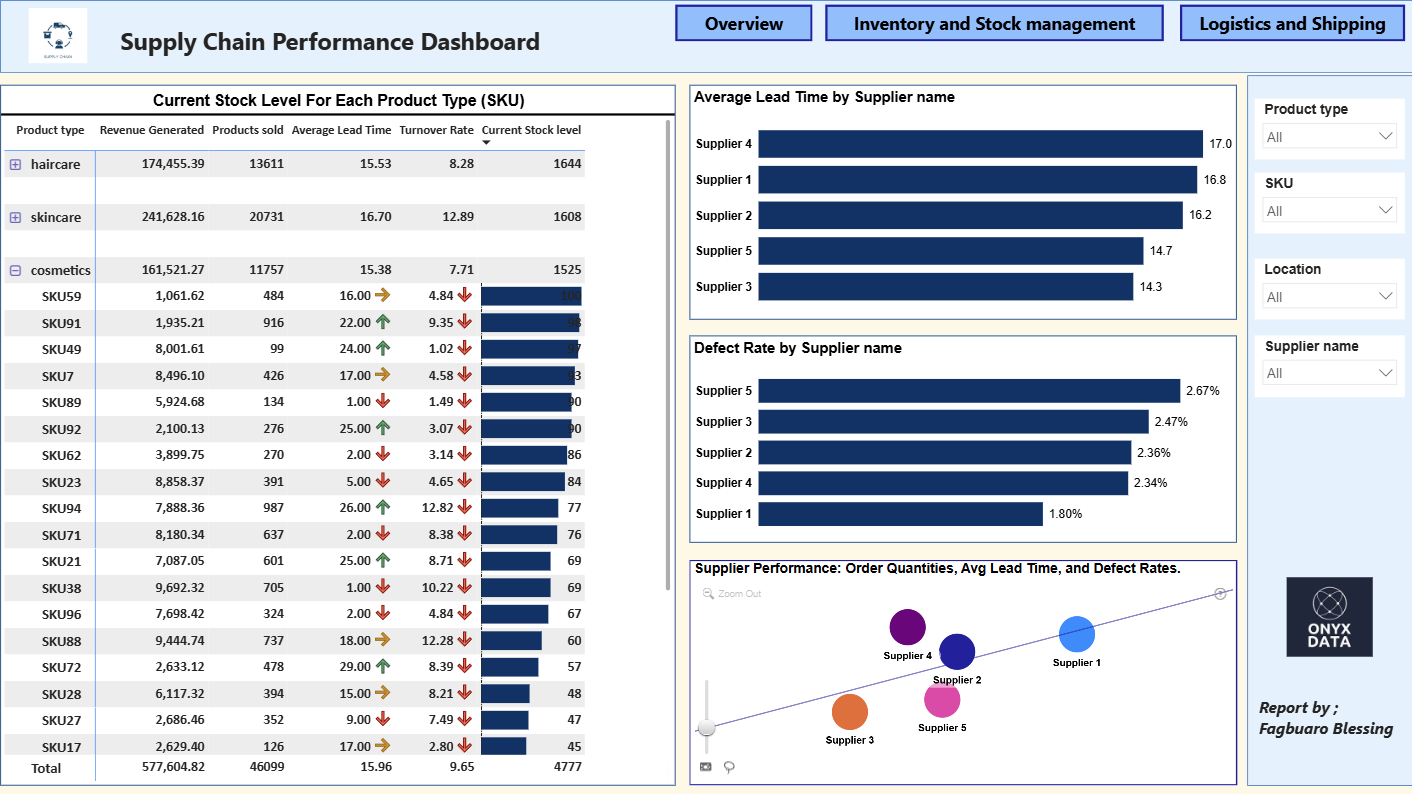
This dashboard tells a comprehensive story about the supply chain, focusing on key metrics such as revenue, inventory, and shipping performance. It’s divided into three sections to highlight actionable insights:
Overview: Provides high-level KPIs like total revenue, average lead time, and product performance.
Inventory and Stock Management: Examines stock levels, turnover rates, and supplier performance.
Logistics and Shipping: Focuses on transportation costs, defect rates, and carrier efficiency.



4U Report Challenges
Participate in data challenges, build and submit reports to get free template downloads.
Join CommunityMobile view allows you to interact with the report. To Download the template please switch to desktop view.
How to use a PBIX template
Preview the interactive report, download the PBIX file, open it in Power BI Desktop, and replace the same data connection with your own dataset.
Preview and download
Explore the report online and download the PBIX template file.
Open in Power BI Desktop
Open the downloaded PBIX file in Power BI Desktop.
Connect your data
Replace the sample data source with your own dataset.
Refresh and adjust
Refresh the model and update fields or visual were needed.
Save and share
Save your report and publish it for your audience.


