908
Supply Chain Performance
Supply Chain Performance
Report Author: Agbata Dickson Ukolojo
908
Share template with others
Report submitted for Onyx Data DataDNA ZoomCharts Mini Challenge, November 2024. The report is based on the Supply Chain Analysis dataset and includes ZoomCharts custom Drill Down PRO visuals for Power BI.
Author's description:
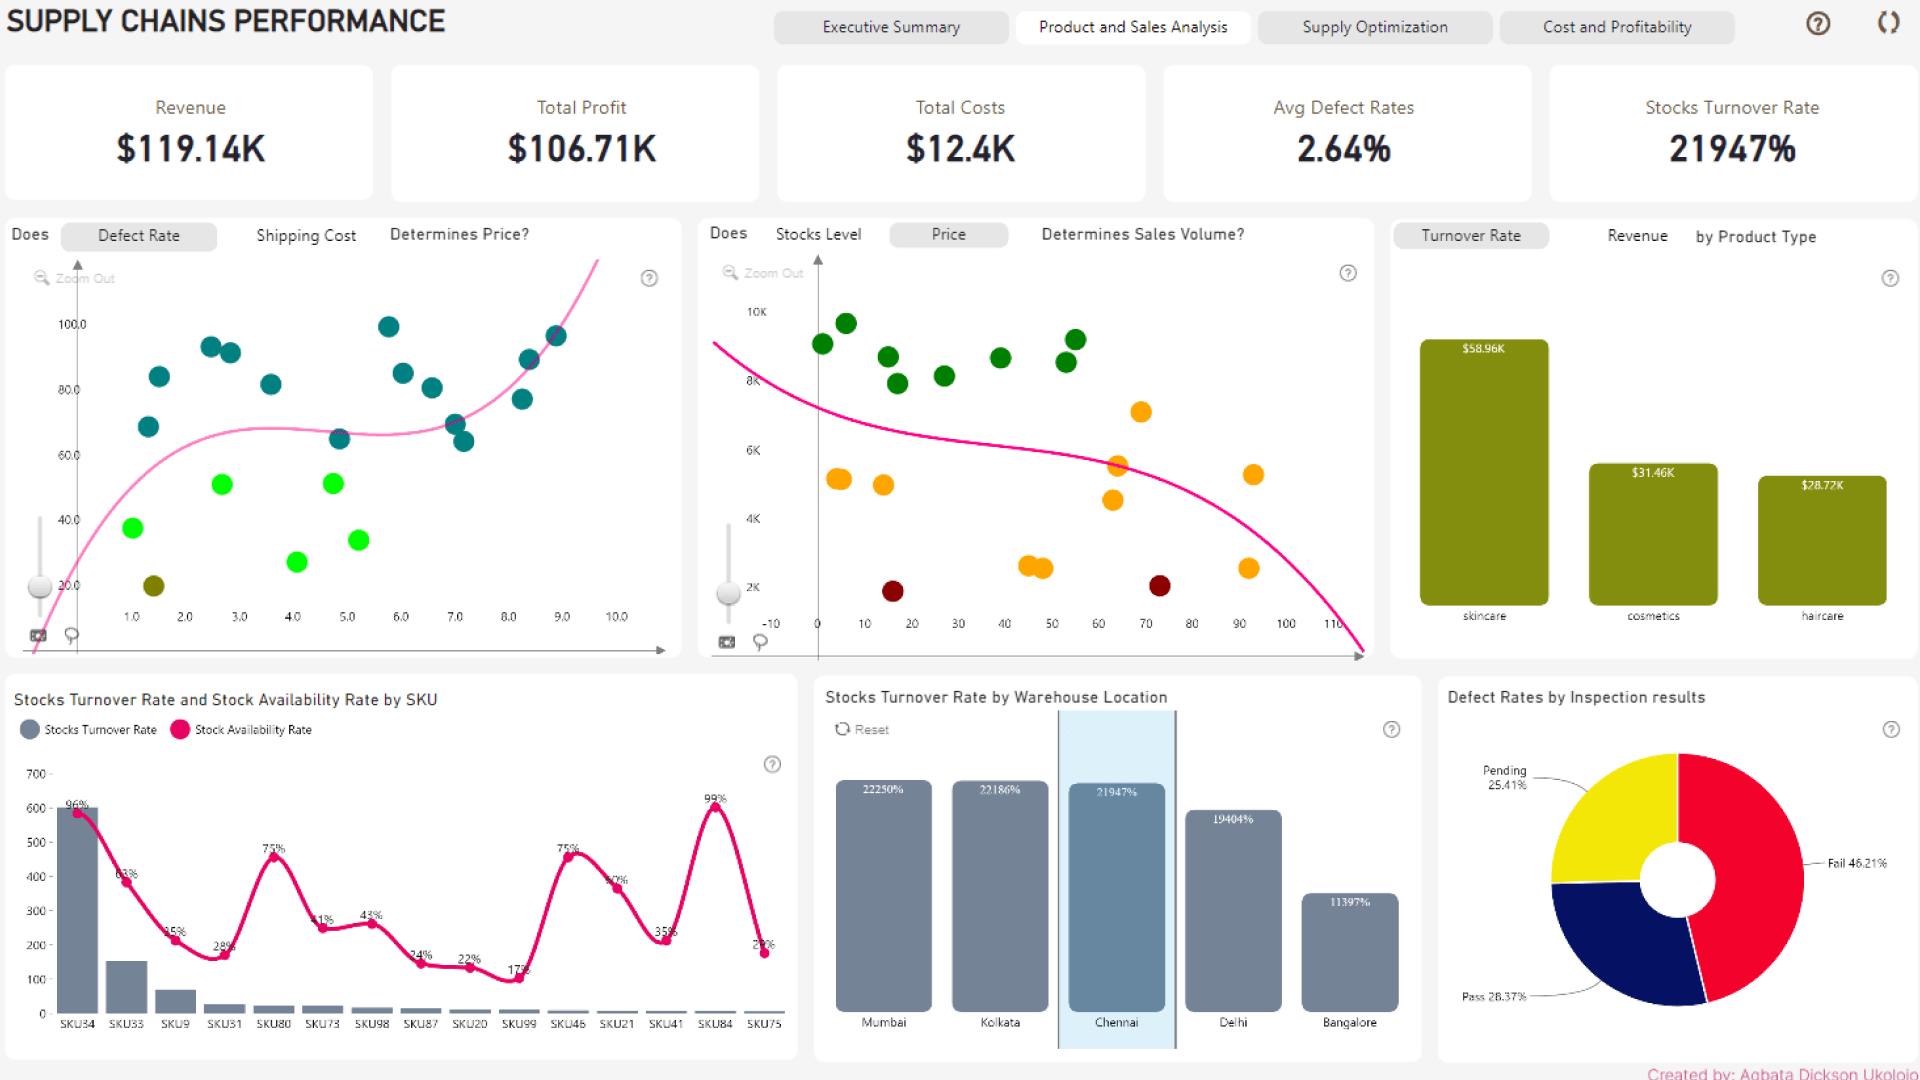
I built a comprehensive analytic report that provides insights into revenue and profit generated from warehouse location, gender, product (SKU), and product type. The report assesses the average lead time by routes and carriers, manufacturing lead time by suppliers, and the factors influencing SKU prices and defect rates. Additionally, I analyzed the costs of shipping, manufacturing, and raw materials.
ZoomCharts visuals used
4U Report Challenges
Participate in data challenges, build and submit reports to get free template downloads.
Join CommunityMobile view allows you to interact with the report. To Download the template please switch to desktop view.
Was this helpful? Thank you for your feedback!
Sorry about that.
How can we improve it?