1030
Supply Chain Operations Dashboard
Supply Chain Operations Dashboard
More Report pages
Report Author: Mohamed Elbushra
1030
Share template with others
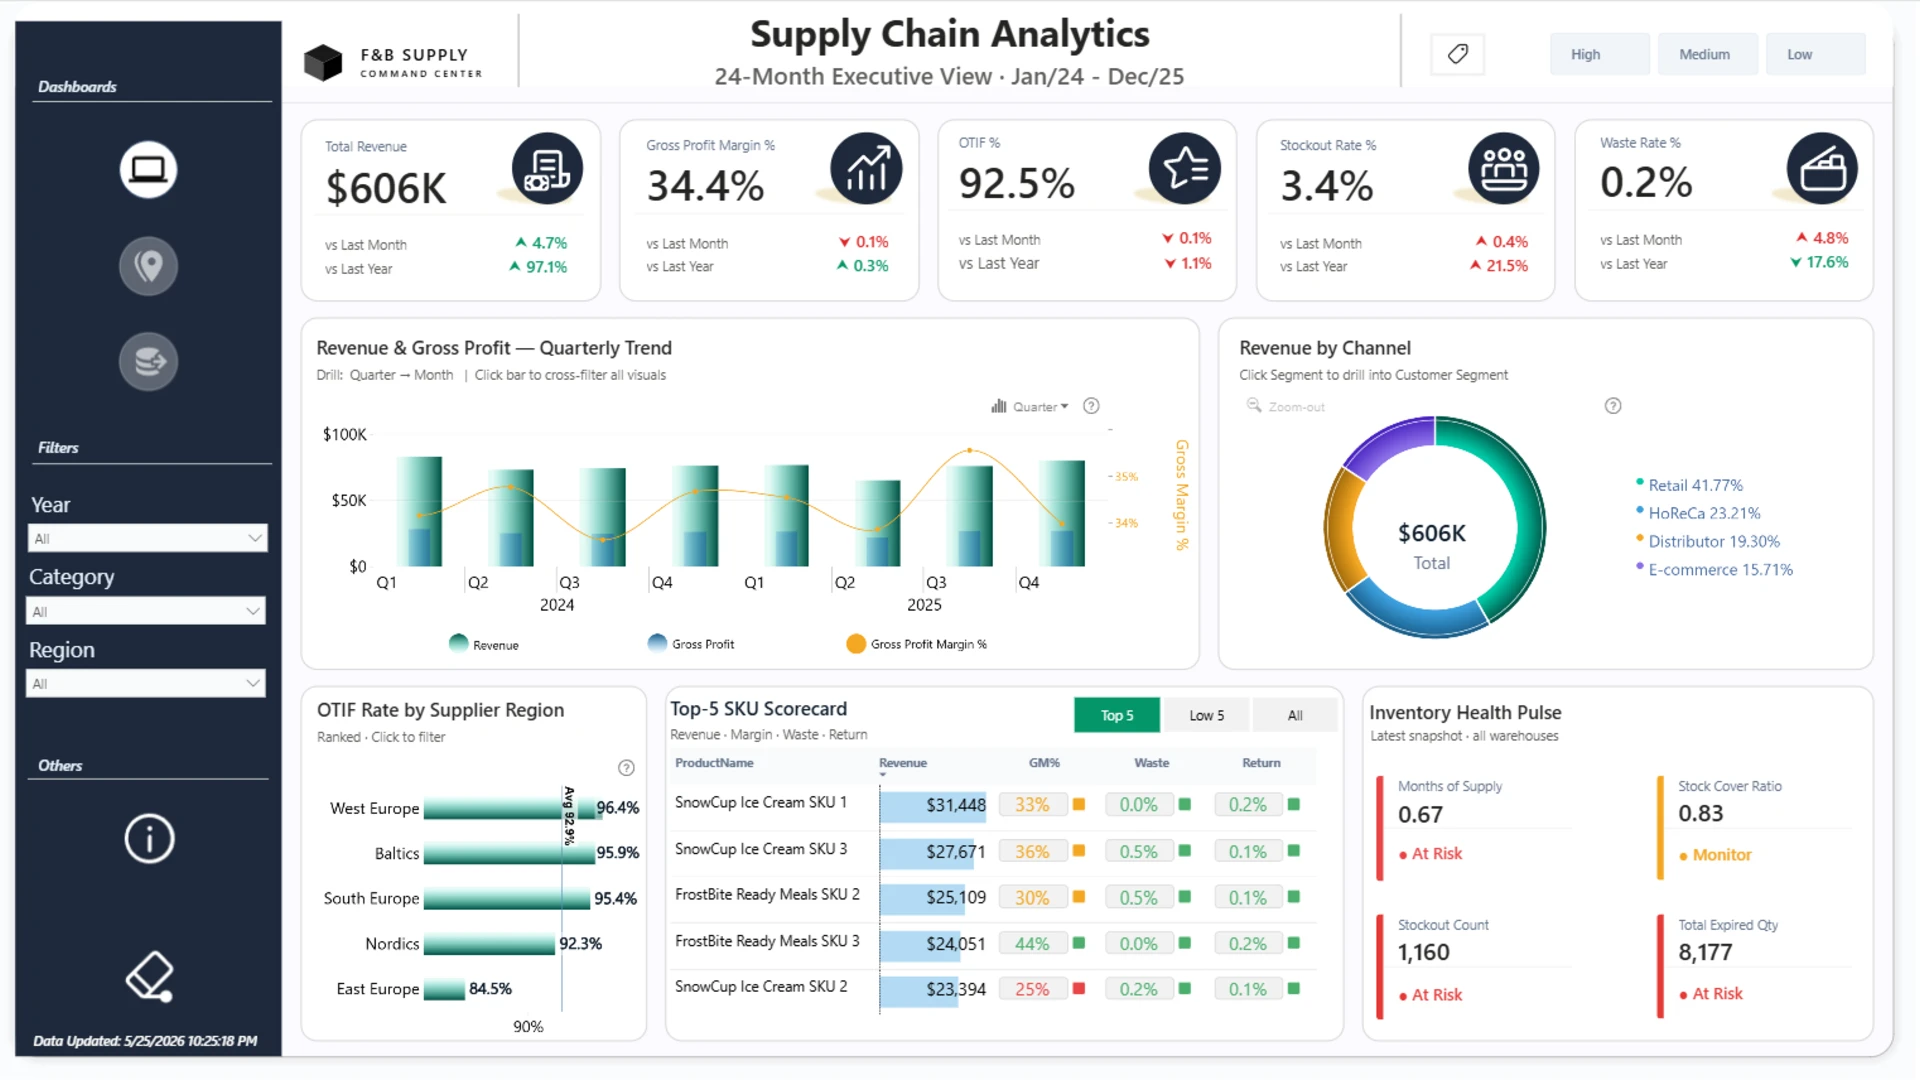
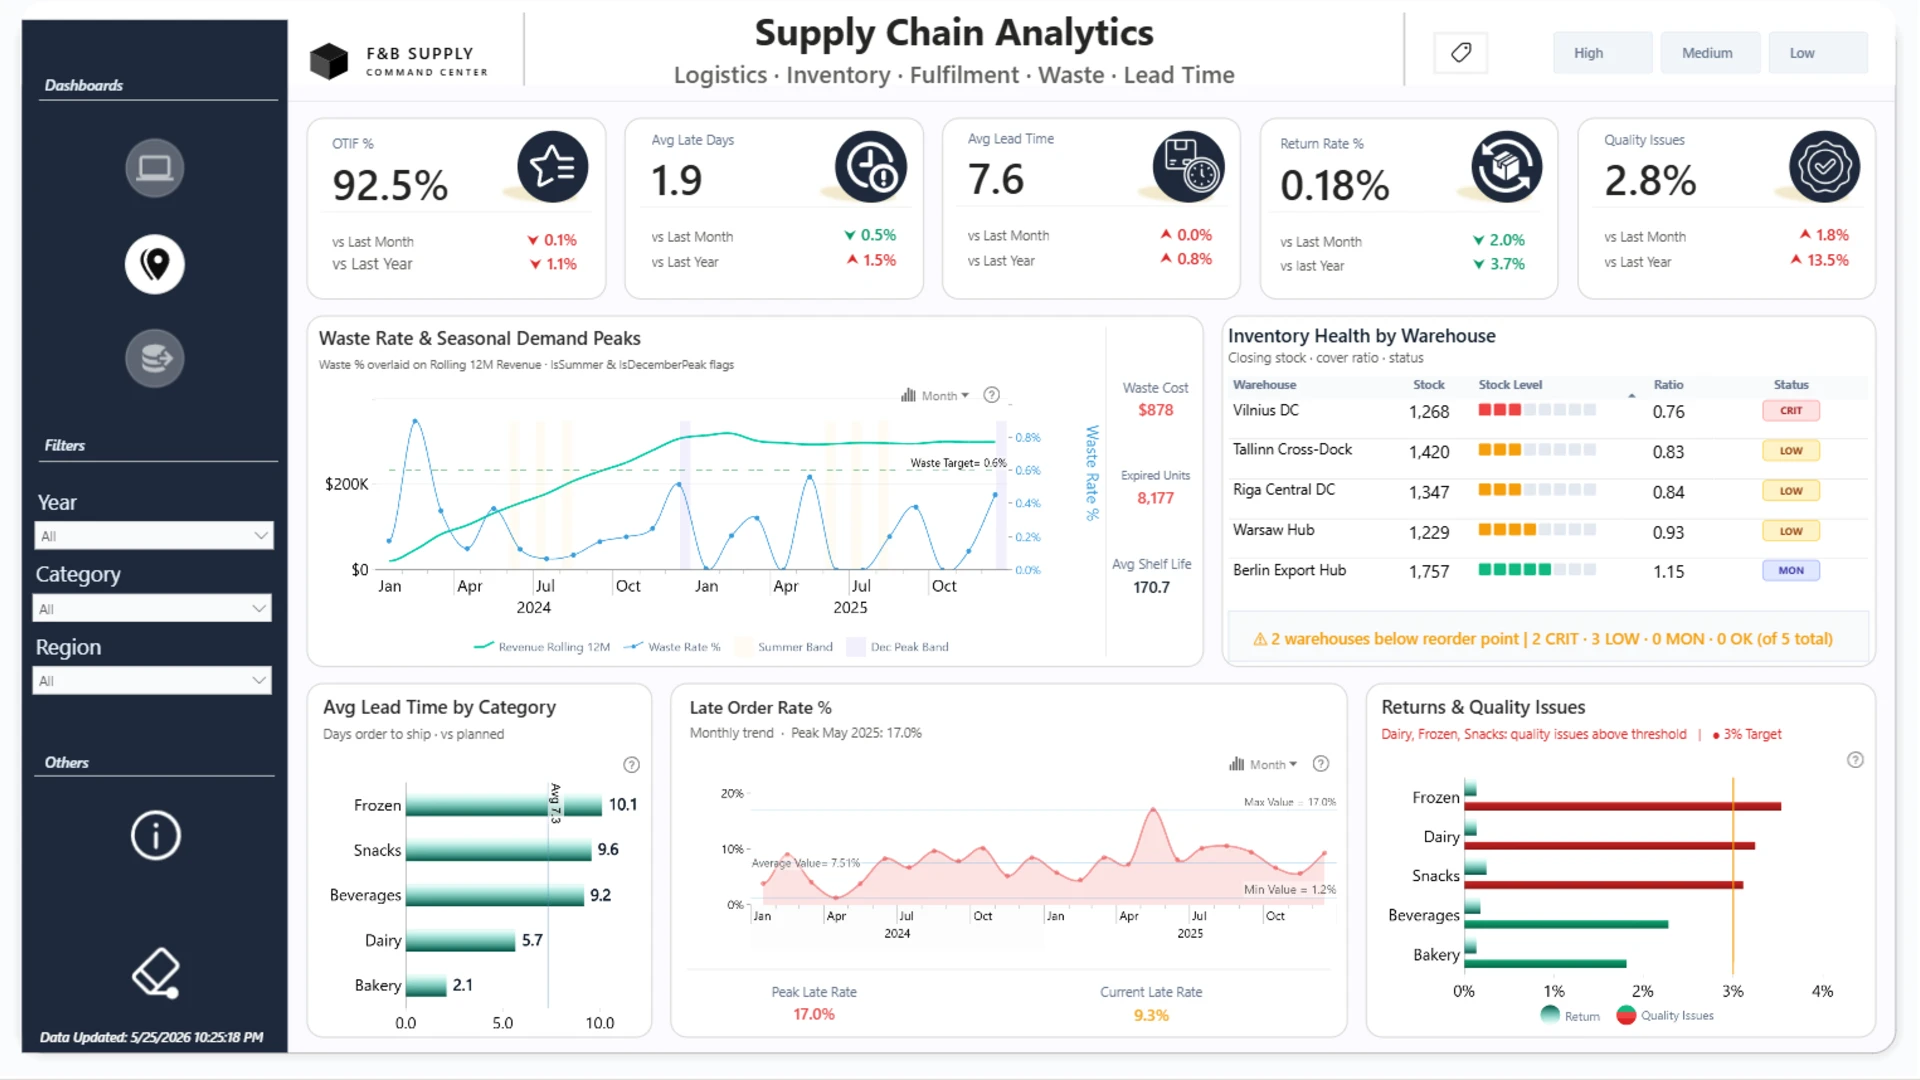
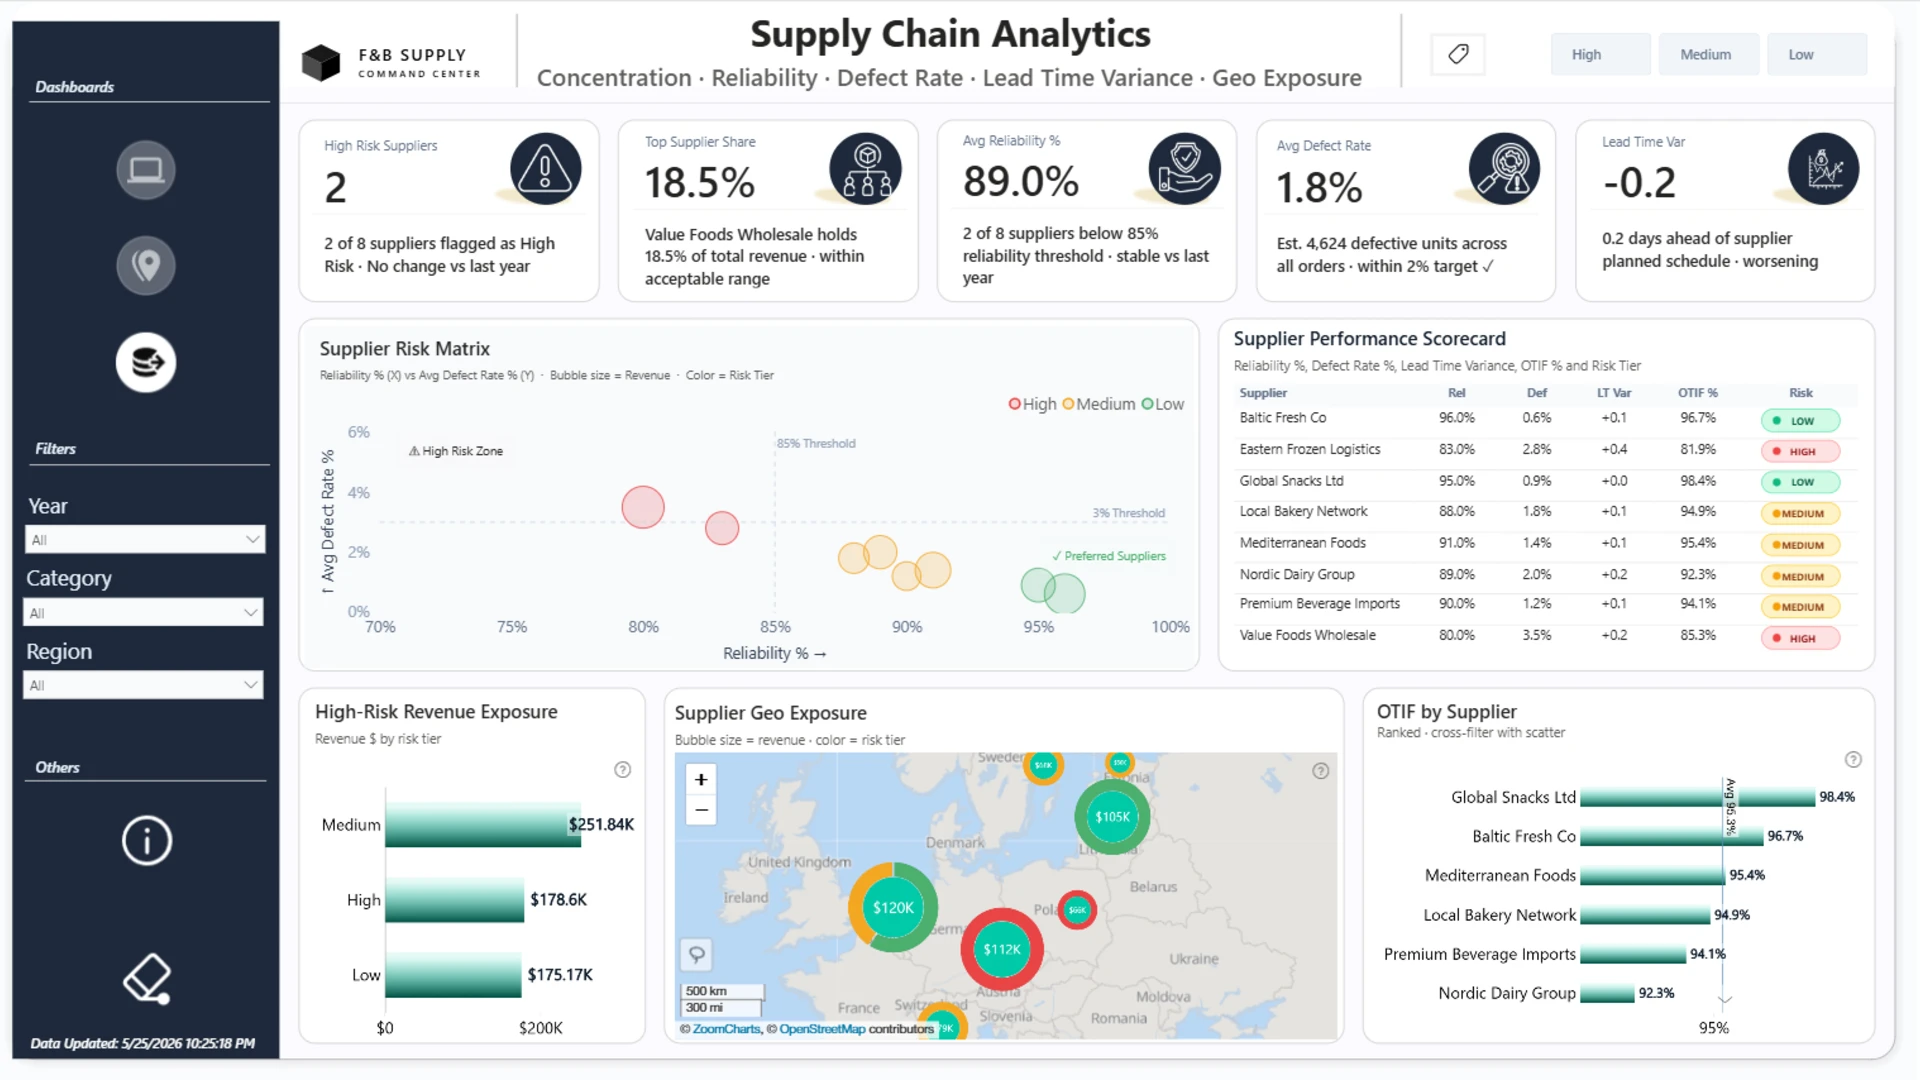
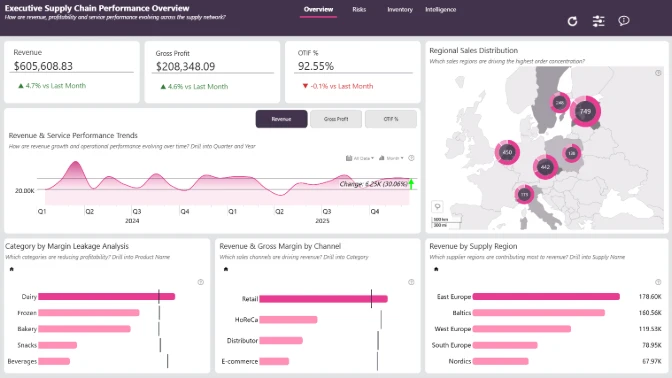
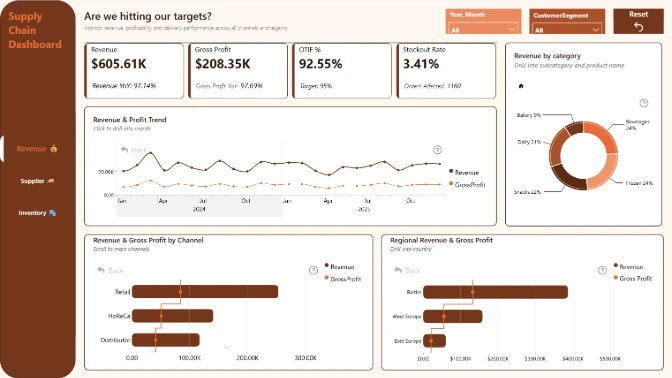
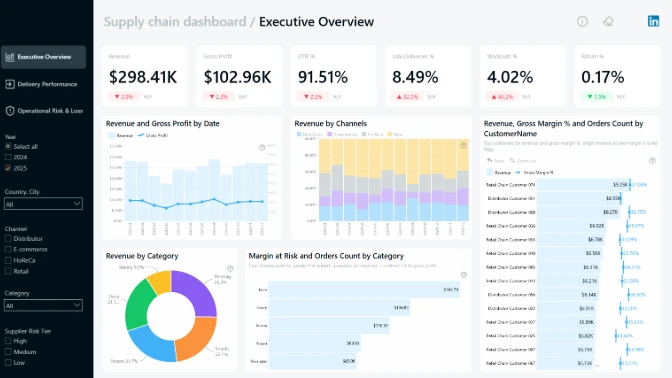
This interactive Power BI report presents a Food & Beverage Supply Chain Dashboard built using a combination of ZoomCharts Drill Down interactive visuals and native Power BI visuals. The report highlights key operational and financial KPIs, including Revenue, Gross Profit, OTIF %, Late Deliveries, Stockouts, Returns, Waste, and Supplier Performance, with interactive drill-down analysis across warehouses, customer channels, and time periods to support data-driven decision-making.
The report was submitted to the monthly ZoomCharts “4U Reports Challenge” data competition (May 2026).
Author’s Description:
The F&B Supply Command Center is a comprehensive three-page Power BI dashboard delivering a 24-month executive view of supply chain financials, logistics performance, inventory stability, and supplier risks. The solution enables stakeholders to monitor revenue, profitability, OTIF performance, stockouts, delivery delays, warehouse efficiency, and supplier reliability through interactive drill-down analysis and ZoomCharts visuals.
The report is structured into three analytical sections: Executive Overview, Logistics & Fulfillment, and Supplier Risk & Geo-Exposure, providing both high-level KPIs and detailed operational insights. Global sidebar navigation, persistent filters, and visual risk indicators improve usability and help decision-makers quickly identify bottlenecks, operational risks, and areas requiring immediate attention.
ZoomCharts visuals used




4U Report Challenges
Participate in data challenges, build and submit reports to get free template downloads.
Join CommunityMobile view allows you to interact with the report. To Download the template please switch to desktop view.
How to use a PBIX template
Preview the interactive report, download the PBIX file, open it in Power BI Desktop, and replace the same data connection with your own dataset.
Preview and download
Explore the report online and download the PBIX template file.
Open in Power BI Desktop
Open the downloaded PBIX file in Power BI Desktop.
Connect your data
Replace the sample data source with your own dataset.
Refresh and adjust
Refresh the model and update fields or visual were needed.
Save and share
Save your report and publish it for your audience.


