987
Supply Chain Insights Dashboard
Supply Chain Insights Dashboard
More Report pages
Report Author: Gideon Oladunjoye
987
Share template with others
Report submitted for Onyx Data DataDNA ZoomCharts Mini Challenge, November 2024. The report is based on the Supply Chain Analysis dataset and includes ZoomCharts custom Drill Down PRO visuals for Power BI.
Author's description:
Executive Summary Velocity Supply Chain currently lacks a central purchasing system to effectively monitor inventory and ensure consistency. Recently, the program management team consolidated data on suppliers, sales, stock levels, logistics and customers including defect rates. Aim of Analysis To provide the management with a comprehensive overview of the Product sales performance, Inventory and stock levels and the Cost analysis of the Logistics to support data driven decision making.
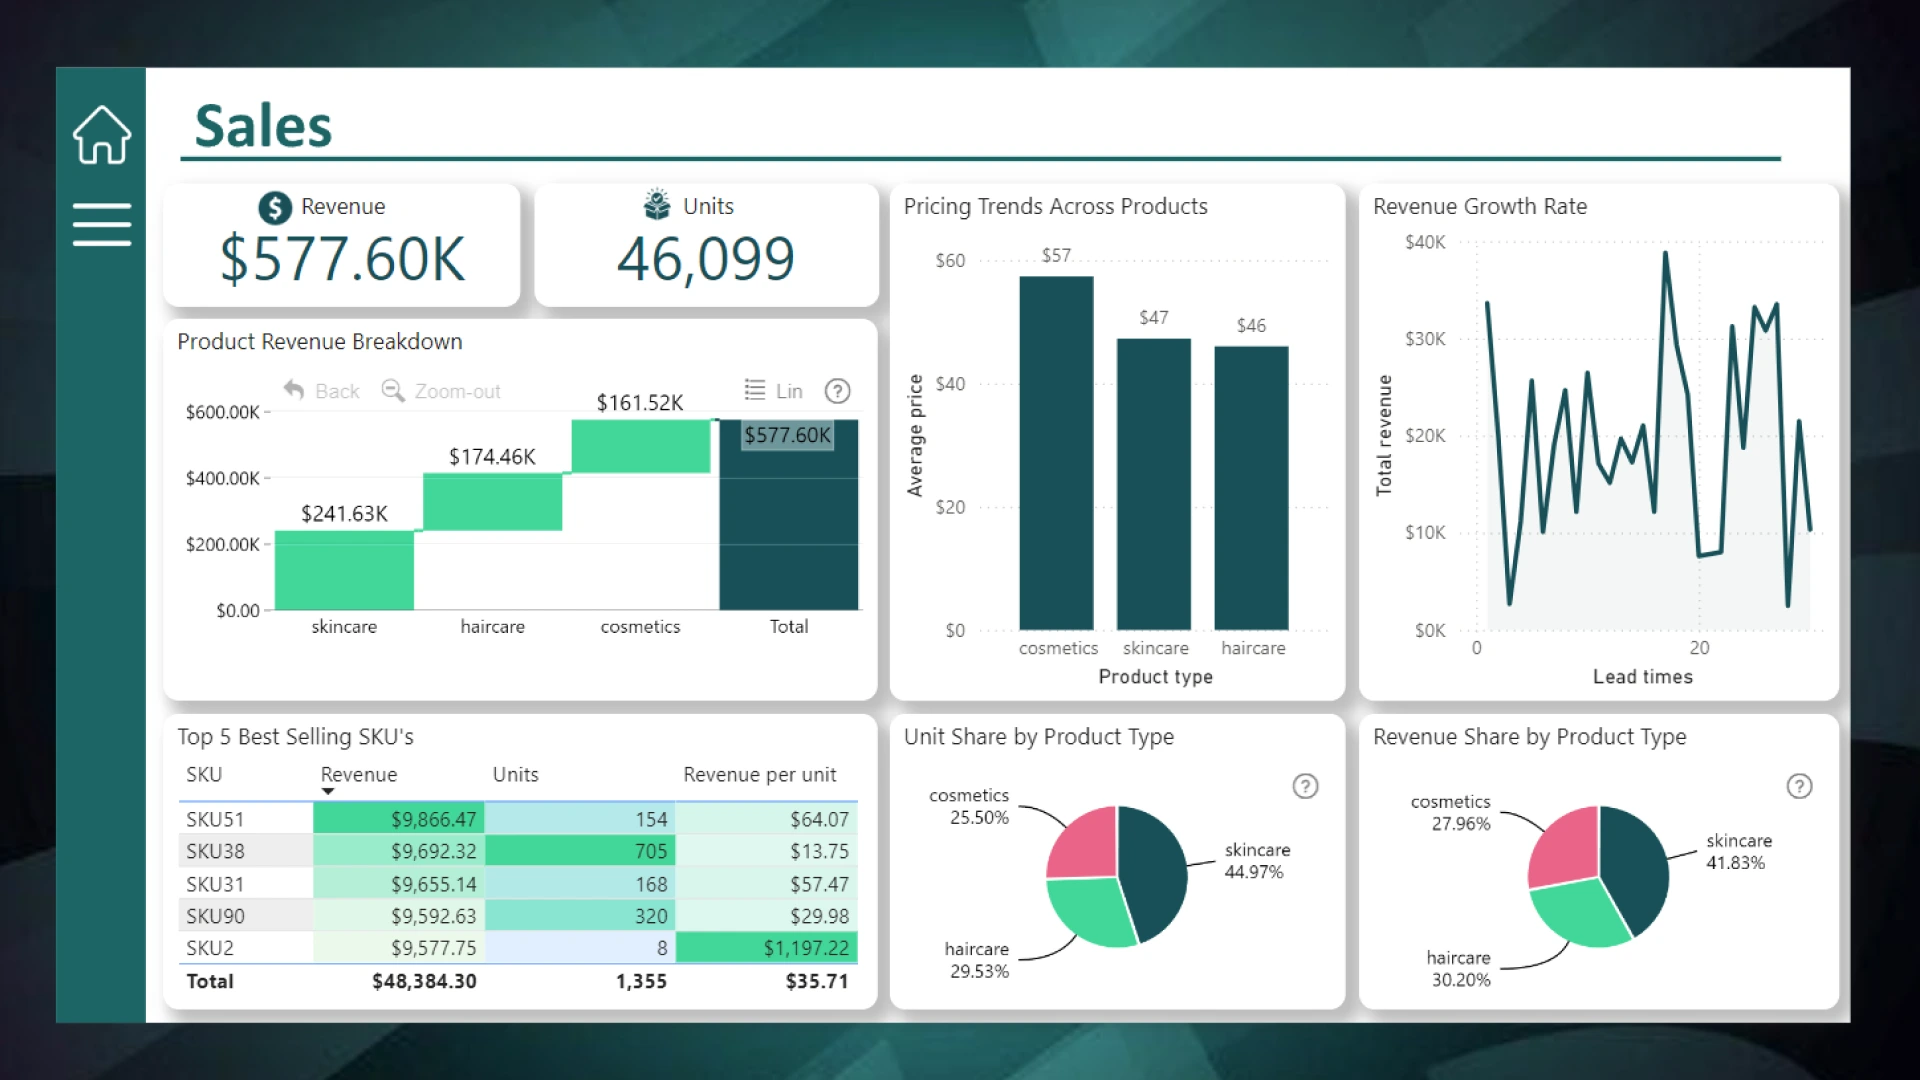
Key findings Sales: The total revenue generated is $578k. Products under Skincare generated 42% of the revenue at $242k. The total units of product the company has sold is 46,099 units. The stock keeping unit(SKU) with the highest Revenue-to-Unit ratio is SKU2 at $1,197.
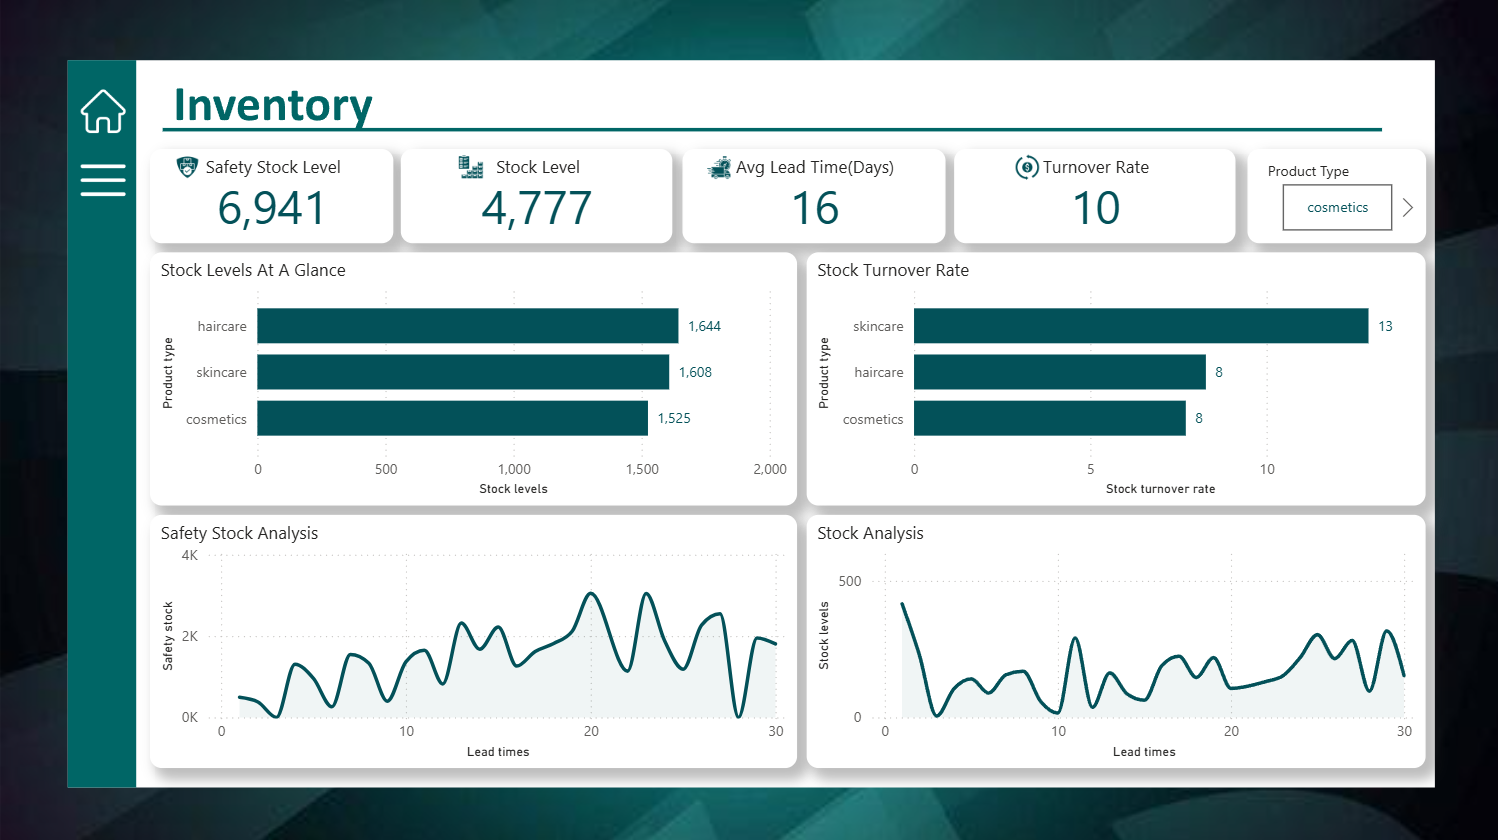
Inventory: The stock level caps at 4,777 units while the safety stock is is 6,941 units which could be due to a surge in demand or a delay in replenishment. The turnover rate which was calculated as a ratio of products sold-to-stock levels is 10. The Average Lead time is 16 Days.
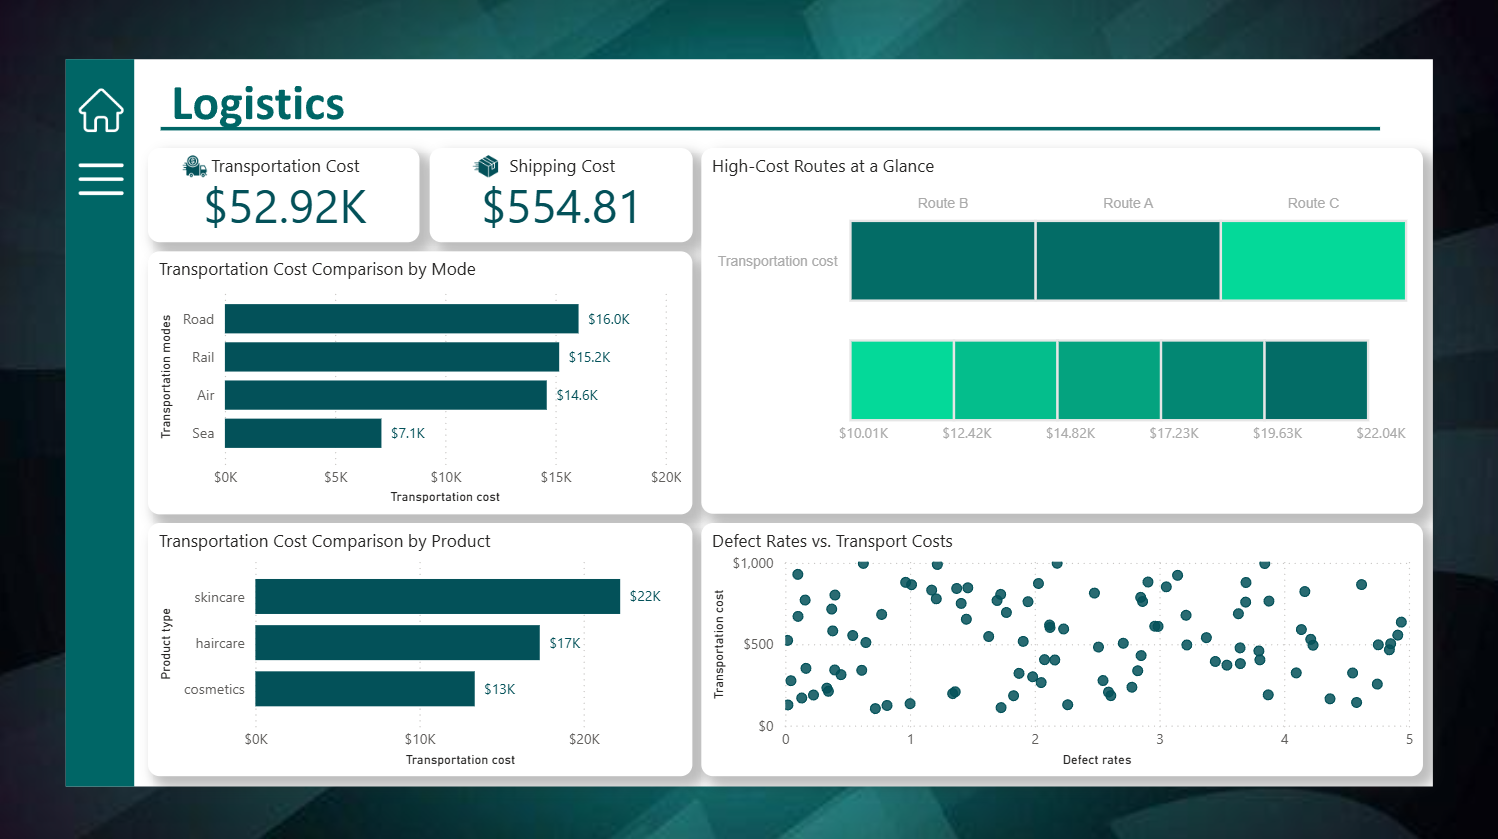
Logistics: The total transportation cost is $53k. Road was the most used means of transportation. The heat map shows the cheapest route which is C. The scatter chart visual was used to show the relationship between defect rates and transportation for the SKU. There is no correlation between defect rates and transport costs which means both of them share no relationship.
Recommendation Sales: Consider allocating more resources to the marketing, inventory management and product expansion to Skincare products to maximize returns. Leverage. SKU2’s high Revenue-to-Unit ratio by analyzing customer preferences and pricing strategies for similar products.
Inventory: The safety stock which is more than the current stock shows a potential supply chain bottleneck which should be addressed with immediate effect. With an average lead time of 16 days and a turnover rate of 10, adjust reorder points to ensure smooth operations and match demand patterns.
Logistics: Prioritize Route C for transportation to reduce costs. Since there is no correlation between defect rates and transport costs, focus on other factors like handling and packaging quality to sustain low defect rates.


4U Report Challenges
Participate in data challenges, build and submit reports to get free template downloads.
Join CommunityMobile view allows you to interact with the report. To Download the template please switch to desktop view.



How to use a PBIX template
Preview the interactive report, download the PBIX file, open it in Power BI Desktop, and replace the same data connection with your own dataset.
Preview and download
Explore the report online and download the PBIX template file.
Open in Power BI Desktop
Open the downloaded PBIX file in Power BI Desktop.
Connect your data
Replace the sample data source with your own dataset.
Refresh and adjust
Refresh the model and update fields or visual were needed.
Save and share
Save your report and publish it for your audience.


