2611
Supply Chain
Supply Chain
More Report pages
Report Author: Misha Riaz
2611
Share template with others
Report submitted for Onyx Data DataDNA ZoomCharts Mini Challenge, November 2024. The report is based on the Supply Chain Analysis dataset and includes ZoomCharts custom Drill Down PRO visuals for Power BI.
Author's description:
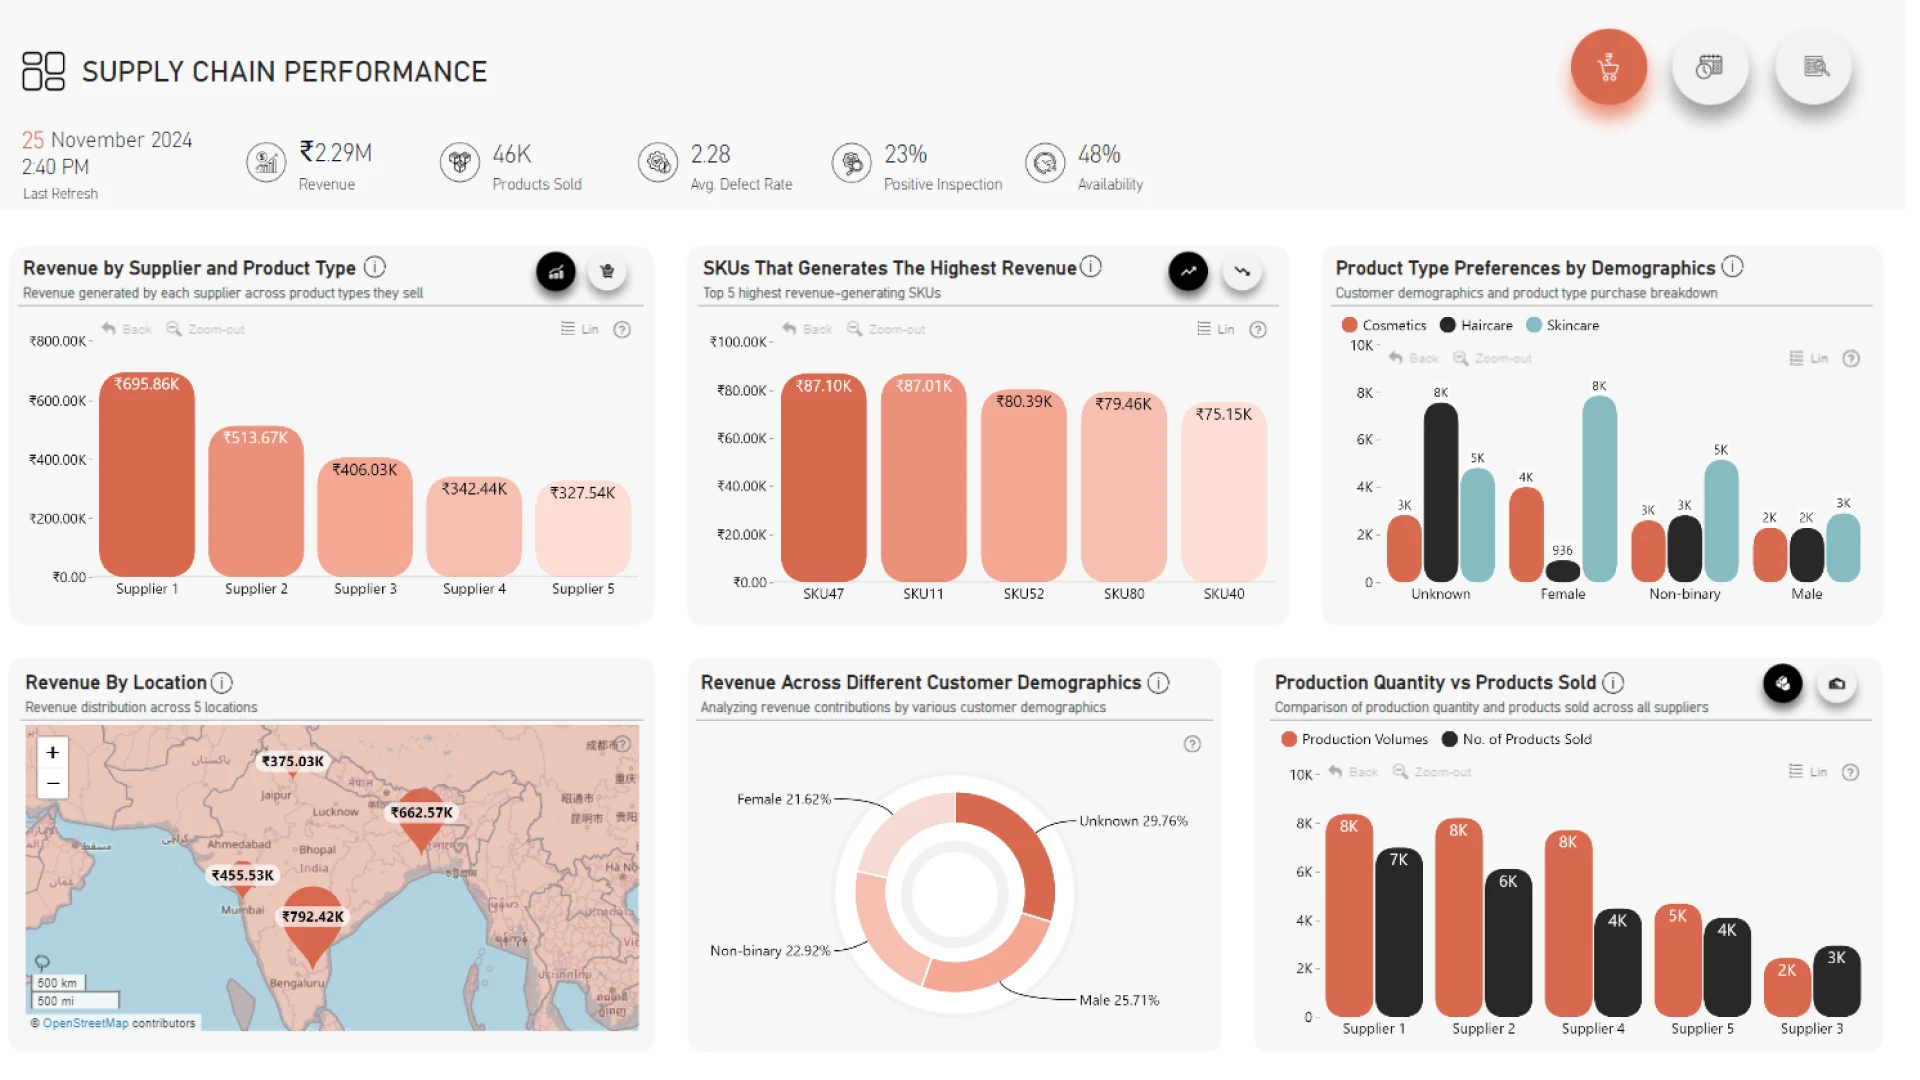
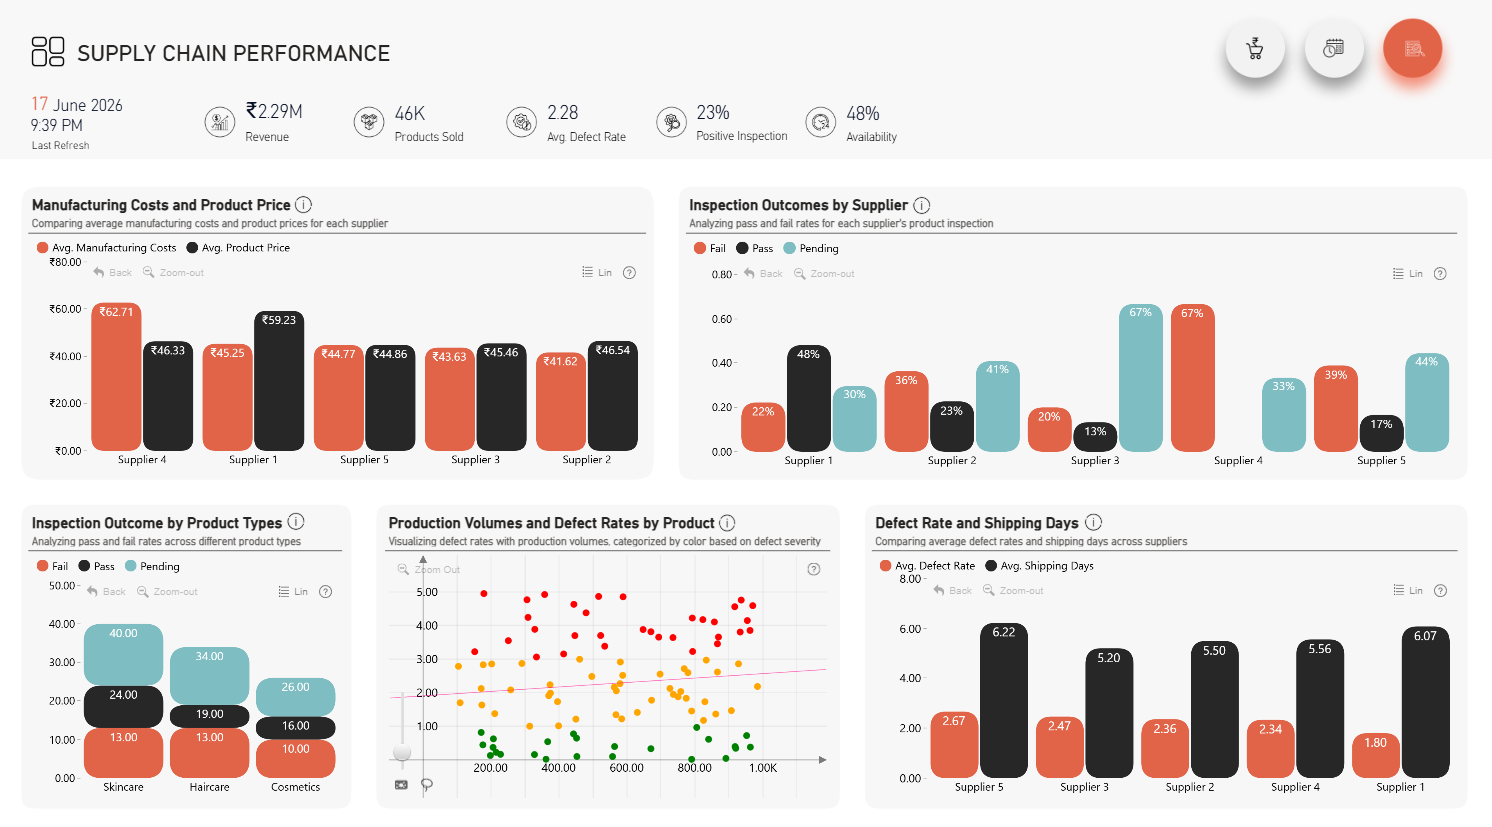
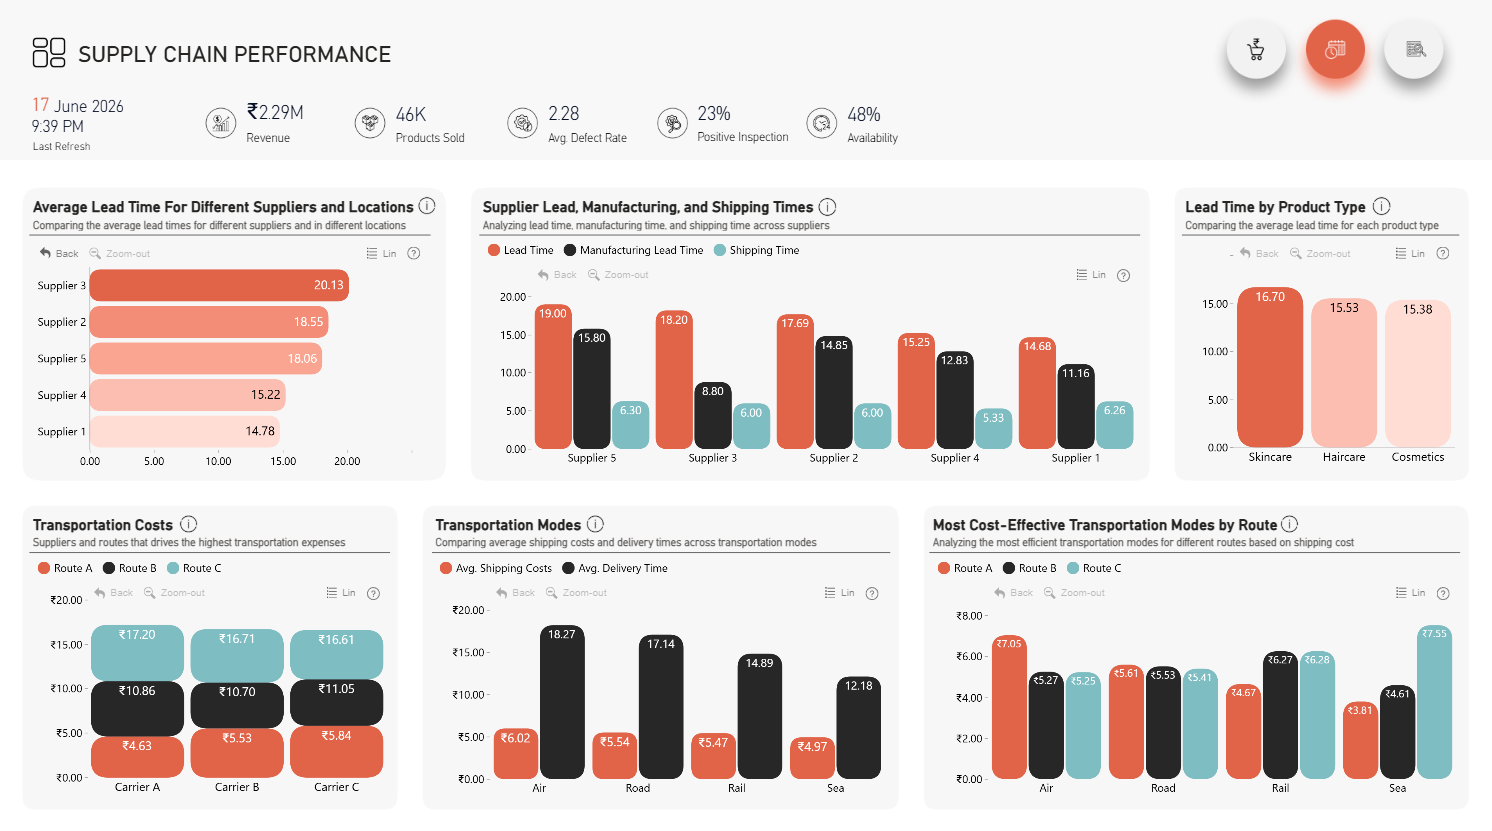
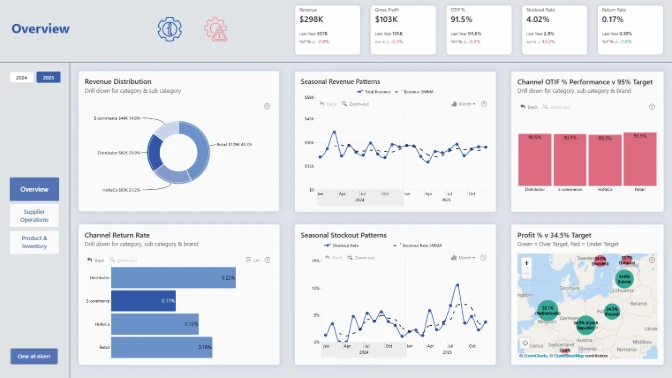
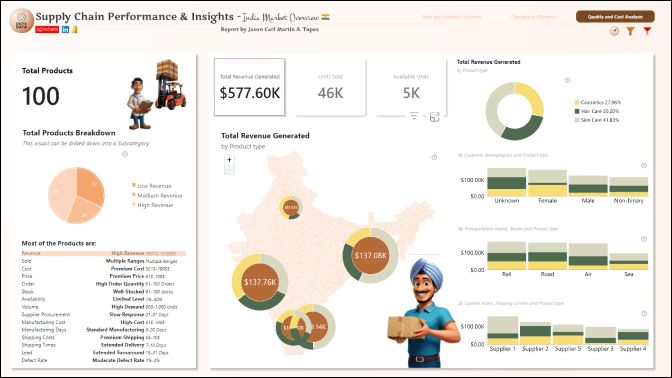
This dashboard provides a comprehensive overview of supply chain performance, highlighting key metrics such as revenue, production volumes, defect rates, and inspection outcomes. It analyzes supplier efficiency, product quality, and transportation costs while identifying trends in manufacturing lead times, shipping durations, and product preferences across customer demographics. The insights enable data-driven decisions to optimize quality control, improve efficiency, and enhance overall supply chain operations.
ZoomCharts visuals used
4U Report Challenges
Participate in data challenges, build and submit reports to get free template downloads.
Join CommunityMobile view allows you to interact with the report. To Download the template please switch to desktop view.
Was this helpful? Thank you for your feedback!
Sorry about that.
How can we improve it?