384
Supplier Performance Dashboard in Power BI
Supplier Performance Dashboard in Power BI
More Report pages
Report Author: Gbenga Emmanuel Popoola
384
Share template with others
This interactive Power BI report explores the Procurement dataset using ZoomCharts Drill Down custom visuals and native Power BI visuals. It analyzes purchase order activity from 2022 to 2024, highlighting procurement spend, supplier performance, budget versus actuals, savings, delivery timelines, supplier risk, and maverick spend across categories, departments, regions, and suppliers.
The report helps users identify spending trends, compare supplier performance, monitor compliance, evaluate budget pressure, and uncover opportunities to improve procurement efficiency, reduce risk, and support better purchasing decisions.
The report was submitted to the FP20 Analytics ZoomCharts Data Challenge 37 (April-May 2026).
Author’s Description:
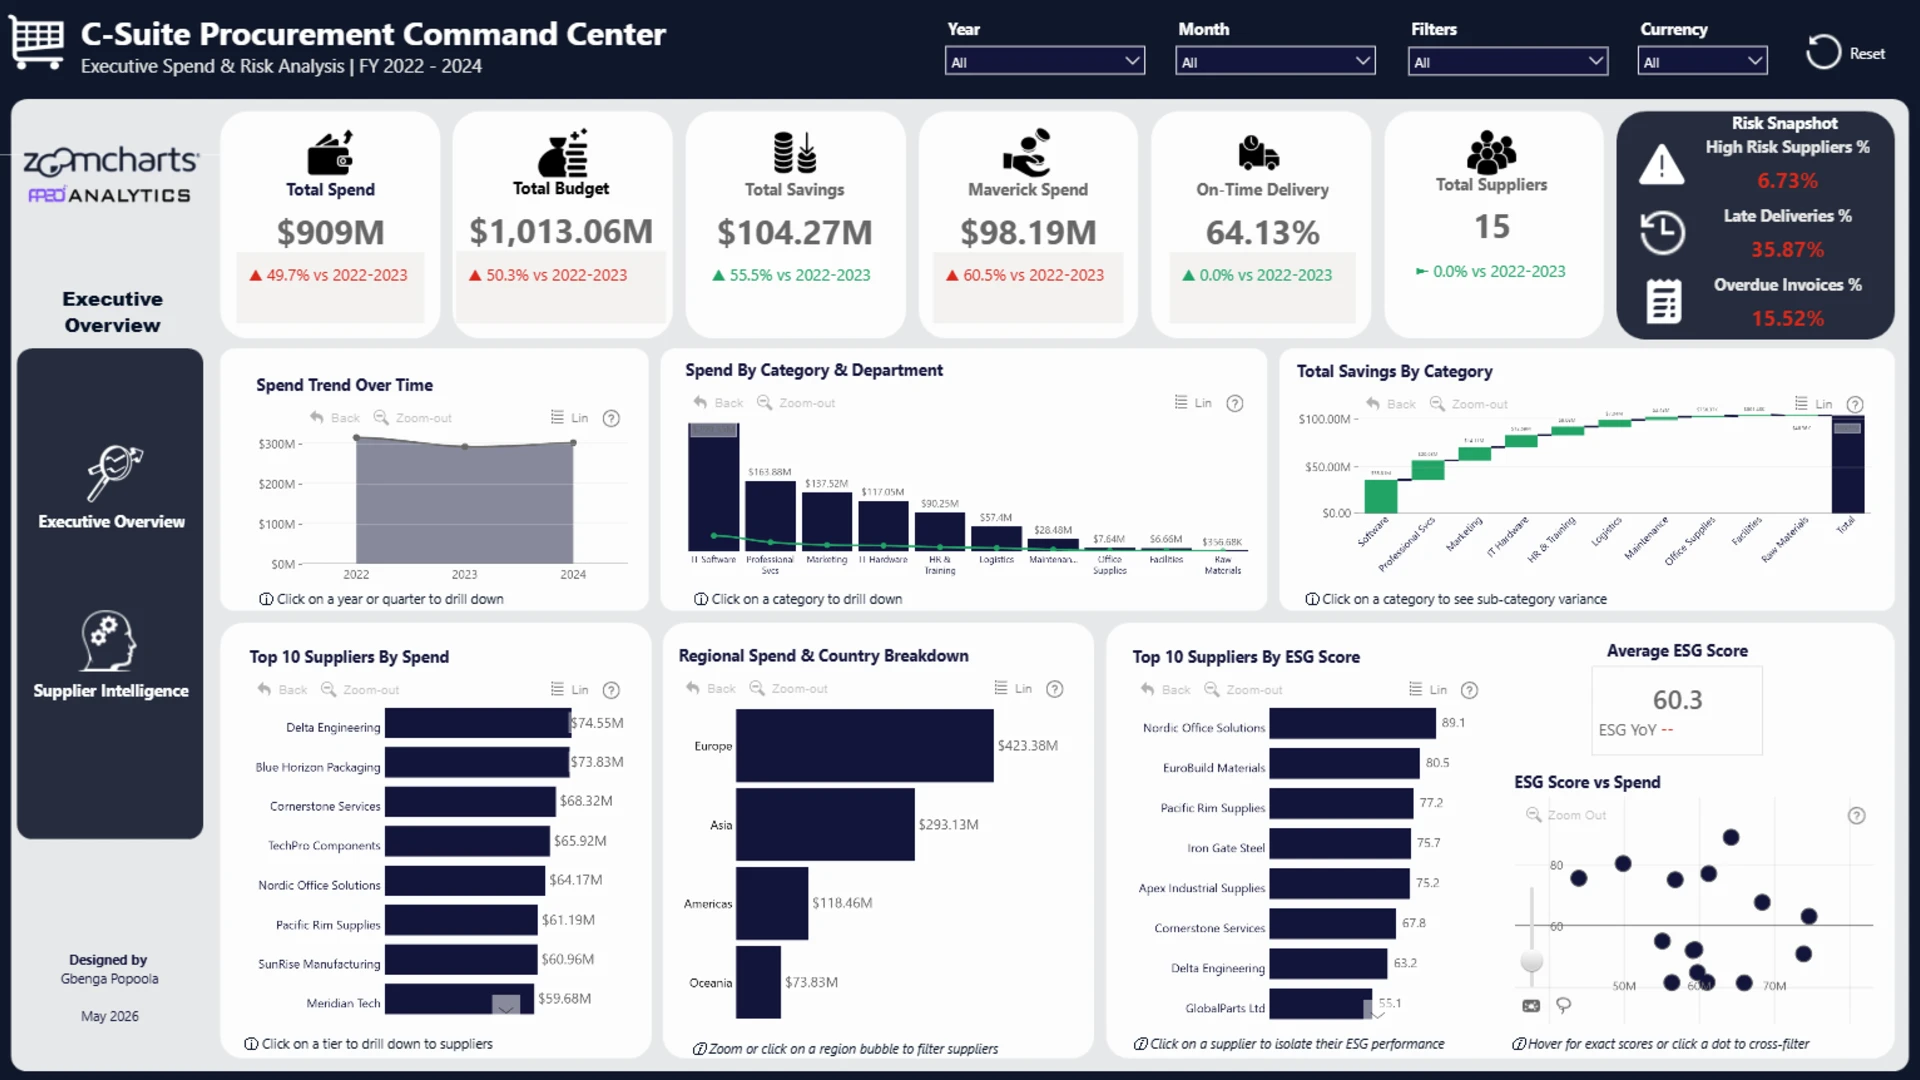
This two-page command center bridges the gap between high-level executive strategy and ground-level operational reality. Designed with a custom app-like UI, it leverages ZoomCharts Drill Down PRO Visuals to enable intuitive exploration of complex supply chain hierarchies.
Page 1 provides a C-Suite Executive Overview, tracking macro-level financial KPIs, cumulative savings, and highlighting corporate risk through an ESG-to-Spend scatter matrix.
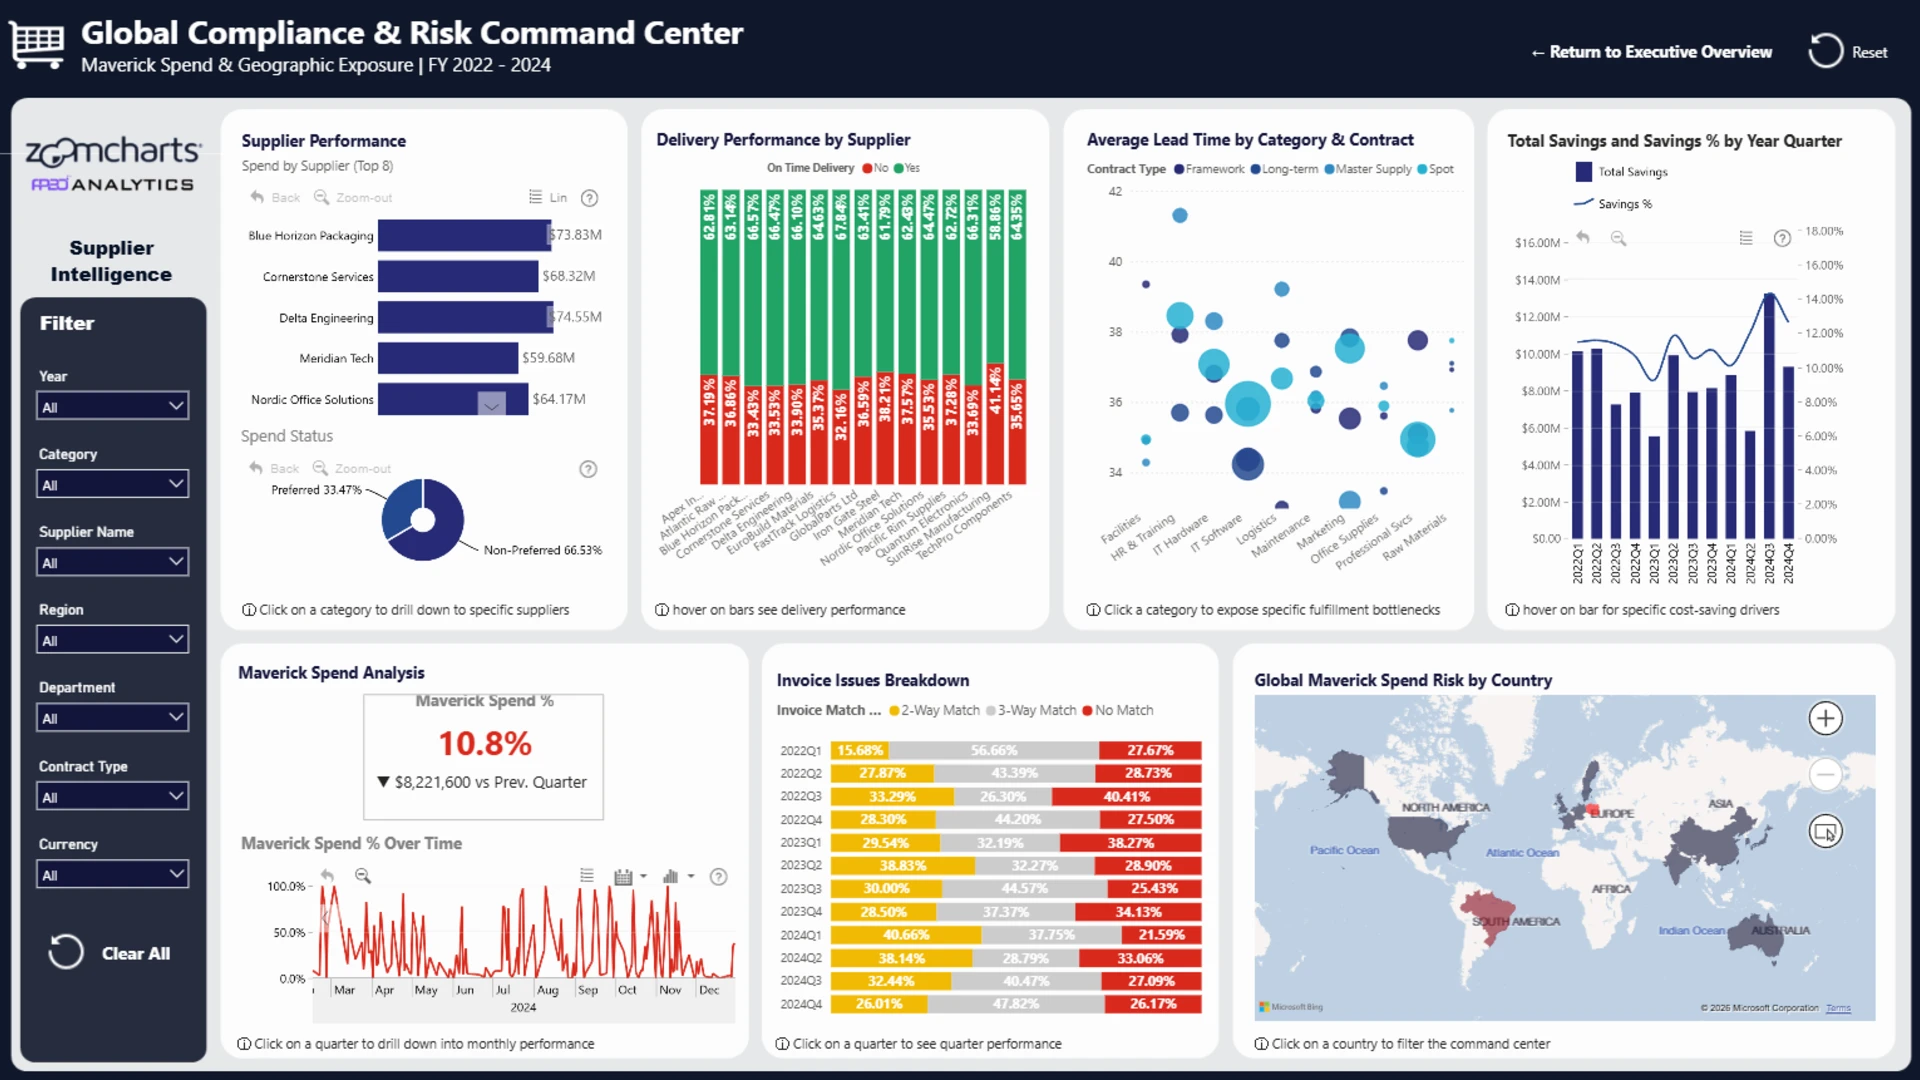
Page 2 acts as an operational diagnostic engine for Procurement Managers, isolating bottlenecks such as Maverick Spend, invoice matching failures (2-way vs. 3-way), and On-Time Delivery delays.
The layout features embedded native help tooltips and optimized visual headers to ensure a seamless, guided user experience.
ZoomCharts visuals used
4U Report Challenges
Participate in data challenges, build and submit reports to get free template downloads.
Join CommunityMobile view allows you to interact with the report. To Download the template please switch to desktop view.


Was this helpful? Thank you for your feedback!
Sorry about that.
How can we improve it?