662
Student Performance Power BI Report 7
Student Performance Power BI Report 7
More Report pages
Report Author: Victor Ademola
662
Share template with others
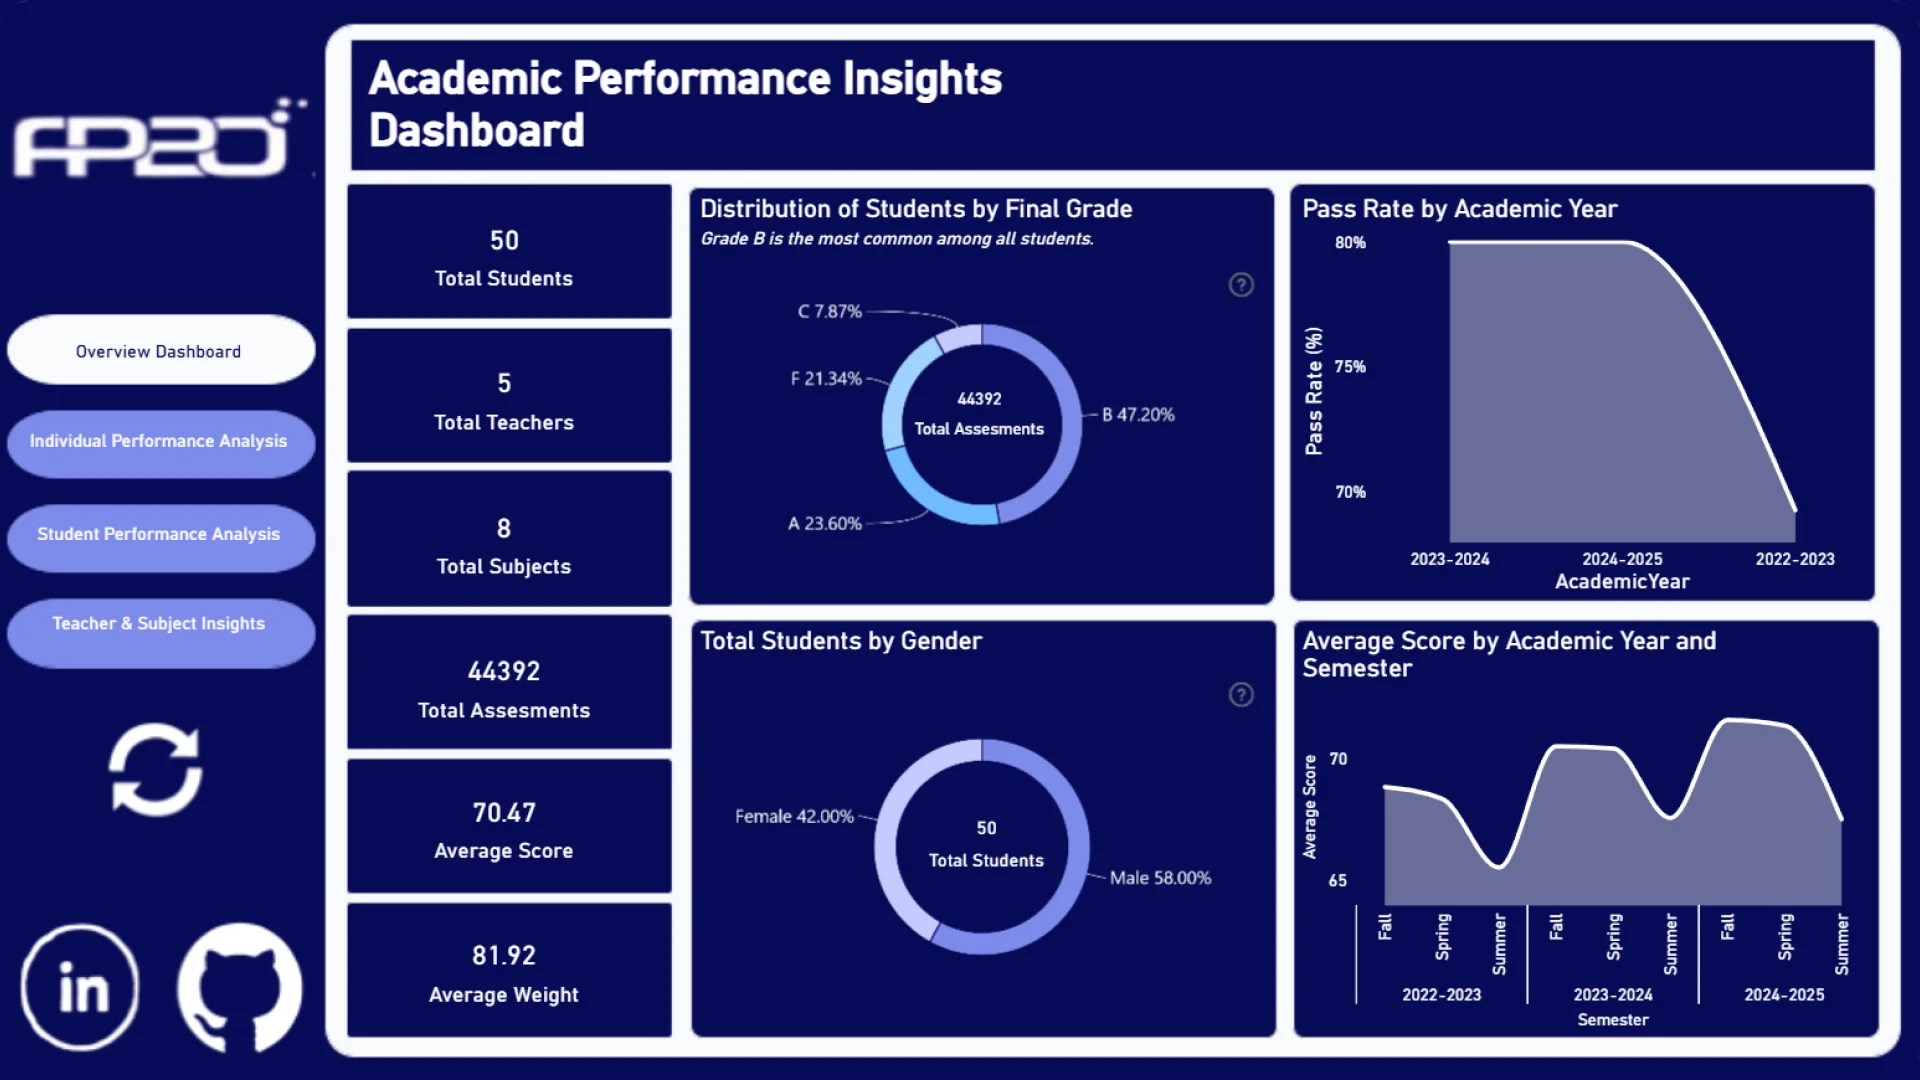
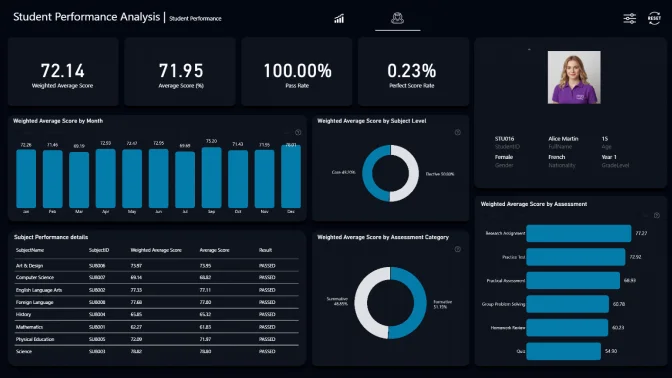
This Power BI report uses the Education/Student Performance dataset and features ZoomCharts Drill Down PRO custom visuals for Power BI. It was submitted to the FP20 Analytics ZoomCharts Data Challenge 31 in October 2025.
Author Description:
Built for FP20 Analytics Challenge 31 powered by ZoomCharts Education performance data provides a powerful lens into student achievement, teaching effectiveness, and curriculum impact. This report explores key questions that help uncover learning trends, highlight excellence, and identify areas for improvement.
4U Report Challenges
Participate in data challenges, build and submit reports to get free template downloads.
Join CommunityMobile view allows you to interact with the report. To Download the template please switch to desktop view.
Was this helpful? Thank you for your feedback!
Sorry about that.
How can we improve it?