1240
Student Performance Power BI Report 4
Student Performance Power BI Report 4
More Report pages
Report Author: Poojitha Kolli
1240
Share template with others
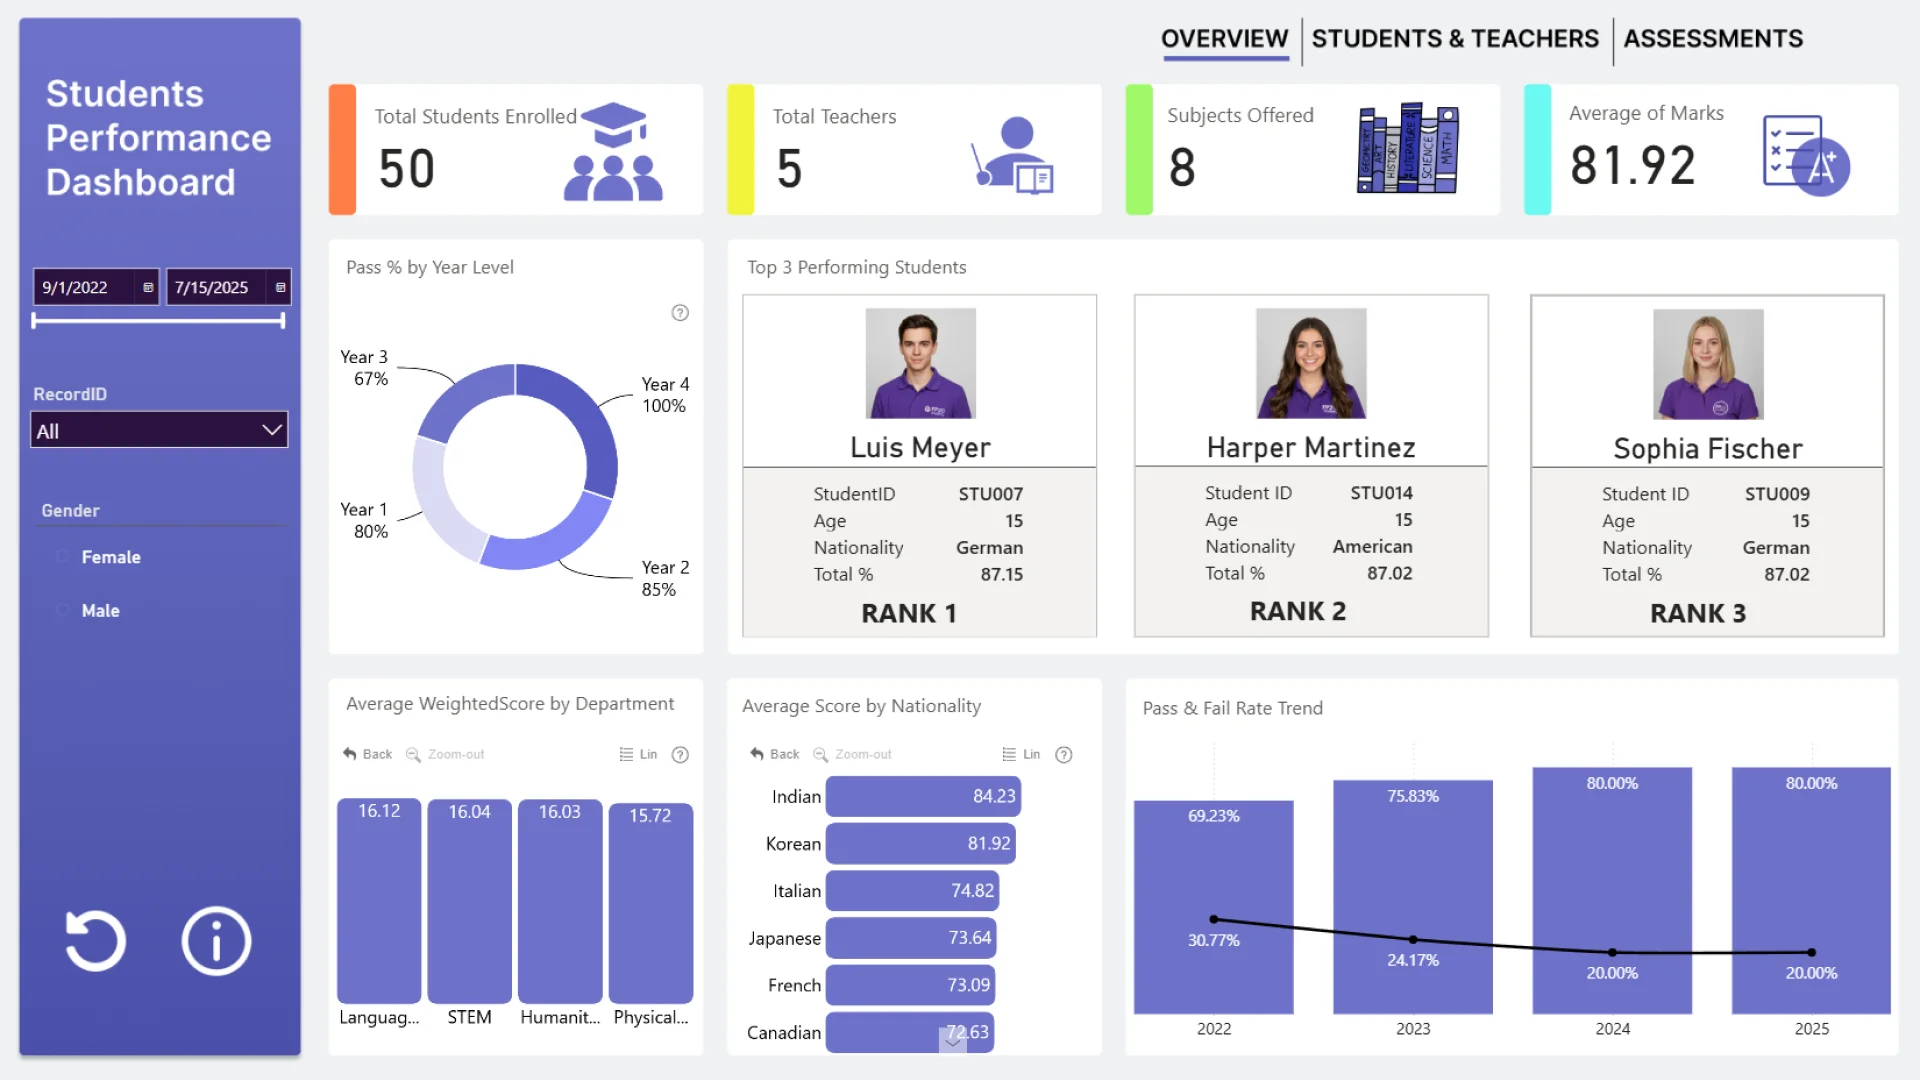
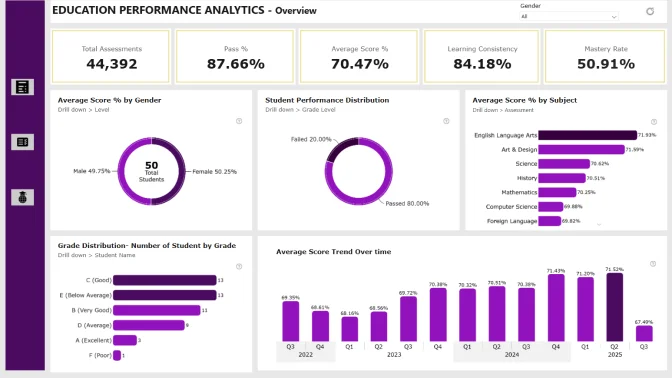
This Power BI report uses the Education/Student Performance dataset and features ZoomCharts Drill Down PRO custom visuals for Power BI. It was submitted to the FP20 Analytics ZoomCharts Data Challenge 31 in October 2025.
Author Description:
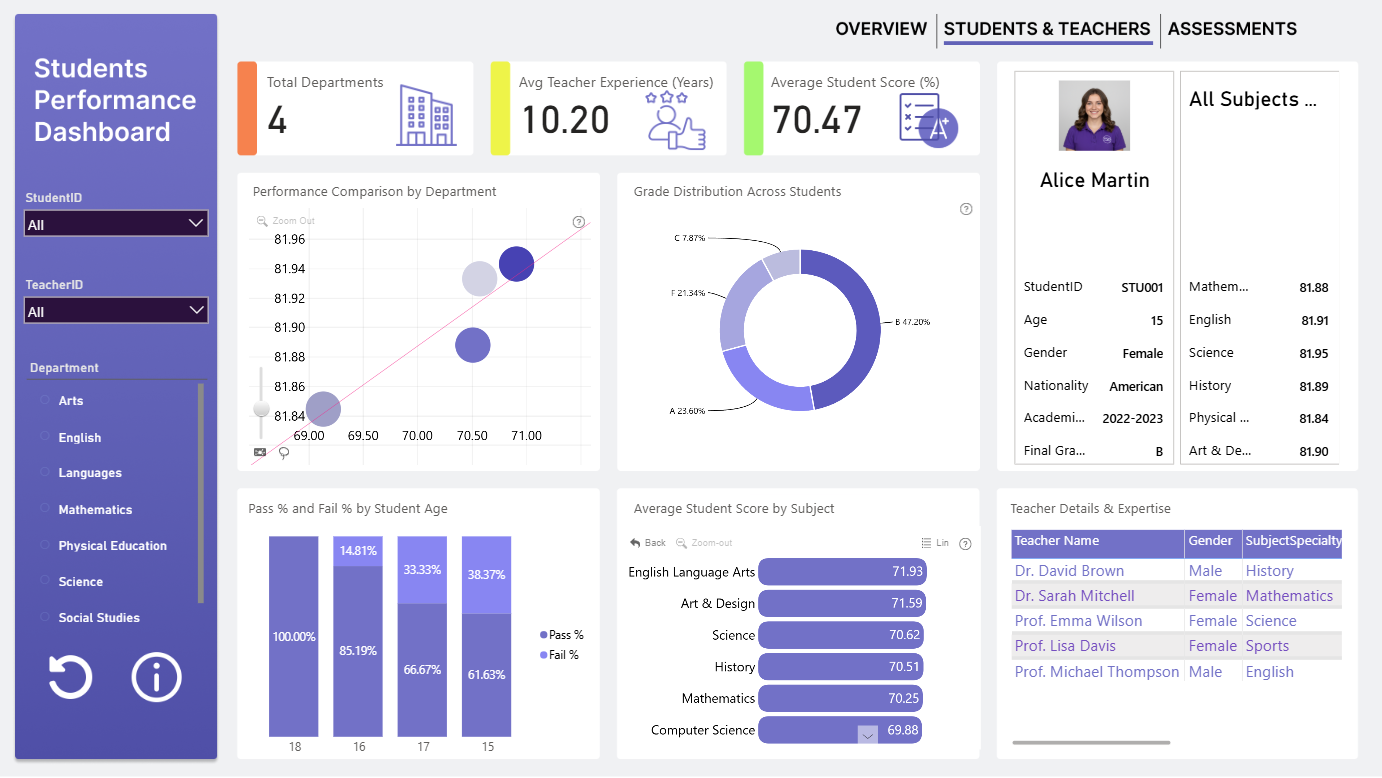
This dashboard provides a comprehensive view of student academic performance, teacher experience, and departmental insights. It helps stakeholders track key metrics such as average student scores, teacher expertise, and grade distribution. Interactive visuals allow filtering by student, teacher, and department, enabling quick comparisons and deeper analysis. The dashboard supports data-driven decisions to improve learning outcomes, teaching efficiency, and academic progress across departments.
ZoomCharts visuals used
4U Report Challenges
Participate in data challenges, build and submit reports to get free template downloads.
Join CommunityMobile view allows you to interact with the report. To Download the template please switch to desktop view.
Was this helpful? Thank you for your feedback!
Sorry about that.
How can we improve it?