861
Student Performance Power BI Report 21
Student Performance Power BI Report 21
Report Author: Ana Di Nezio
861
Share template with others
This Power BI report uses the Education/Student Performance dataset and features ZoomCharts Drill Down PRO custom visuals for Power BI. It was submitted to the FP20 Analytics ZoomCharts Data Challenge 31 in October 2025.
Author Description:
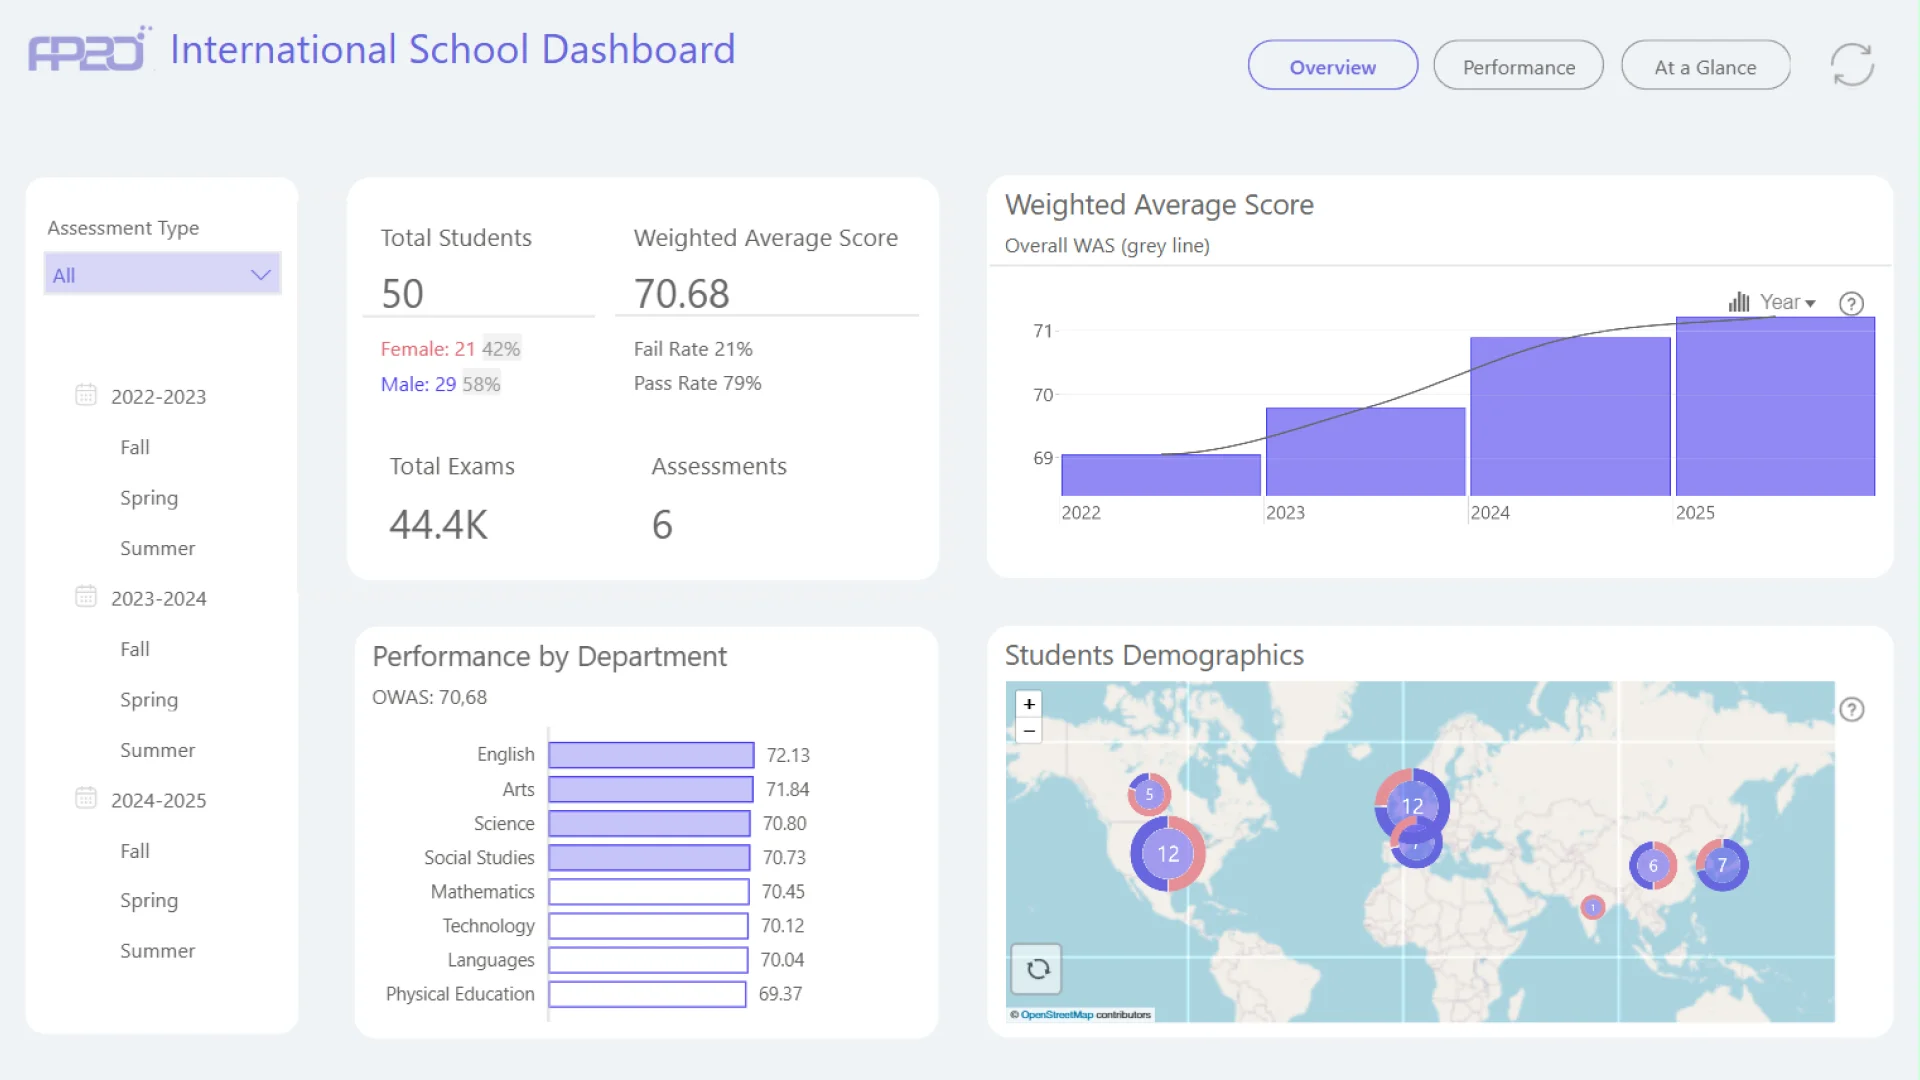
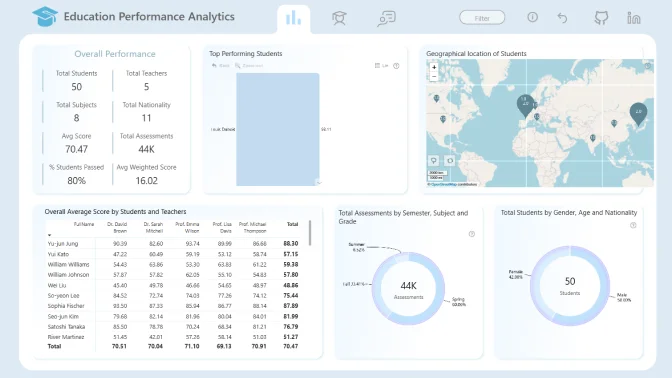
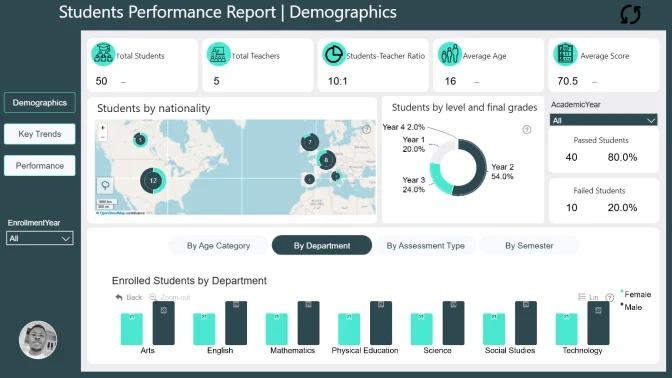
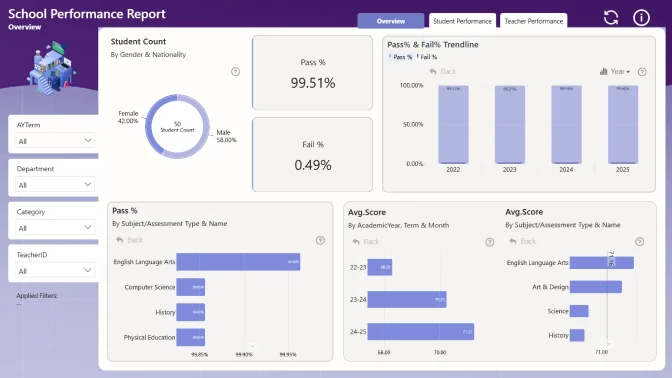
The International School Performance Dashboard is a Power BI solution developed for the FP20 Analytics Challenge 31, analyzing 50 students across 8 departments over 3 academic years. It features key metrics such as a Weighted Average Score of 70.68, a 79% pass rate, and insights from 44,392 assessments. The dashboard includes pages for overall institutional performance, individual student and teacher analysis, and a card-style summary view comparing demographics and performance across cohorts. Built with a star schema model and over 30 DAX measures, it offers dynamic rankings, year-over-year comparisons, and interactive filtering for deeper insights.
4U Report Challenges
Participate in data challenges, build and submit reports to get free template downloads.
Join CommunityMobile view allows you to interact with the report. To Download the template please switch to desktop view.
Was this helpful? Thank you for your feedback!
Sorry about that.
How can we improve it?