1470
Sports Financial Analysis Dashboard
Sports Financial Analysis Dashboard
More Report pages
Report Author: Md. Ashek Rahman Anik
1470
Share template with others
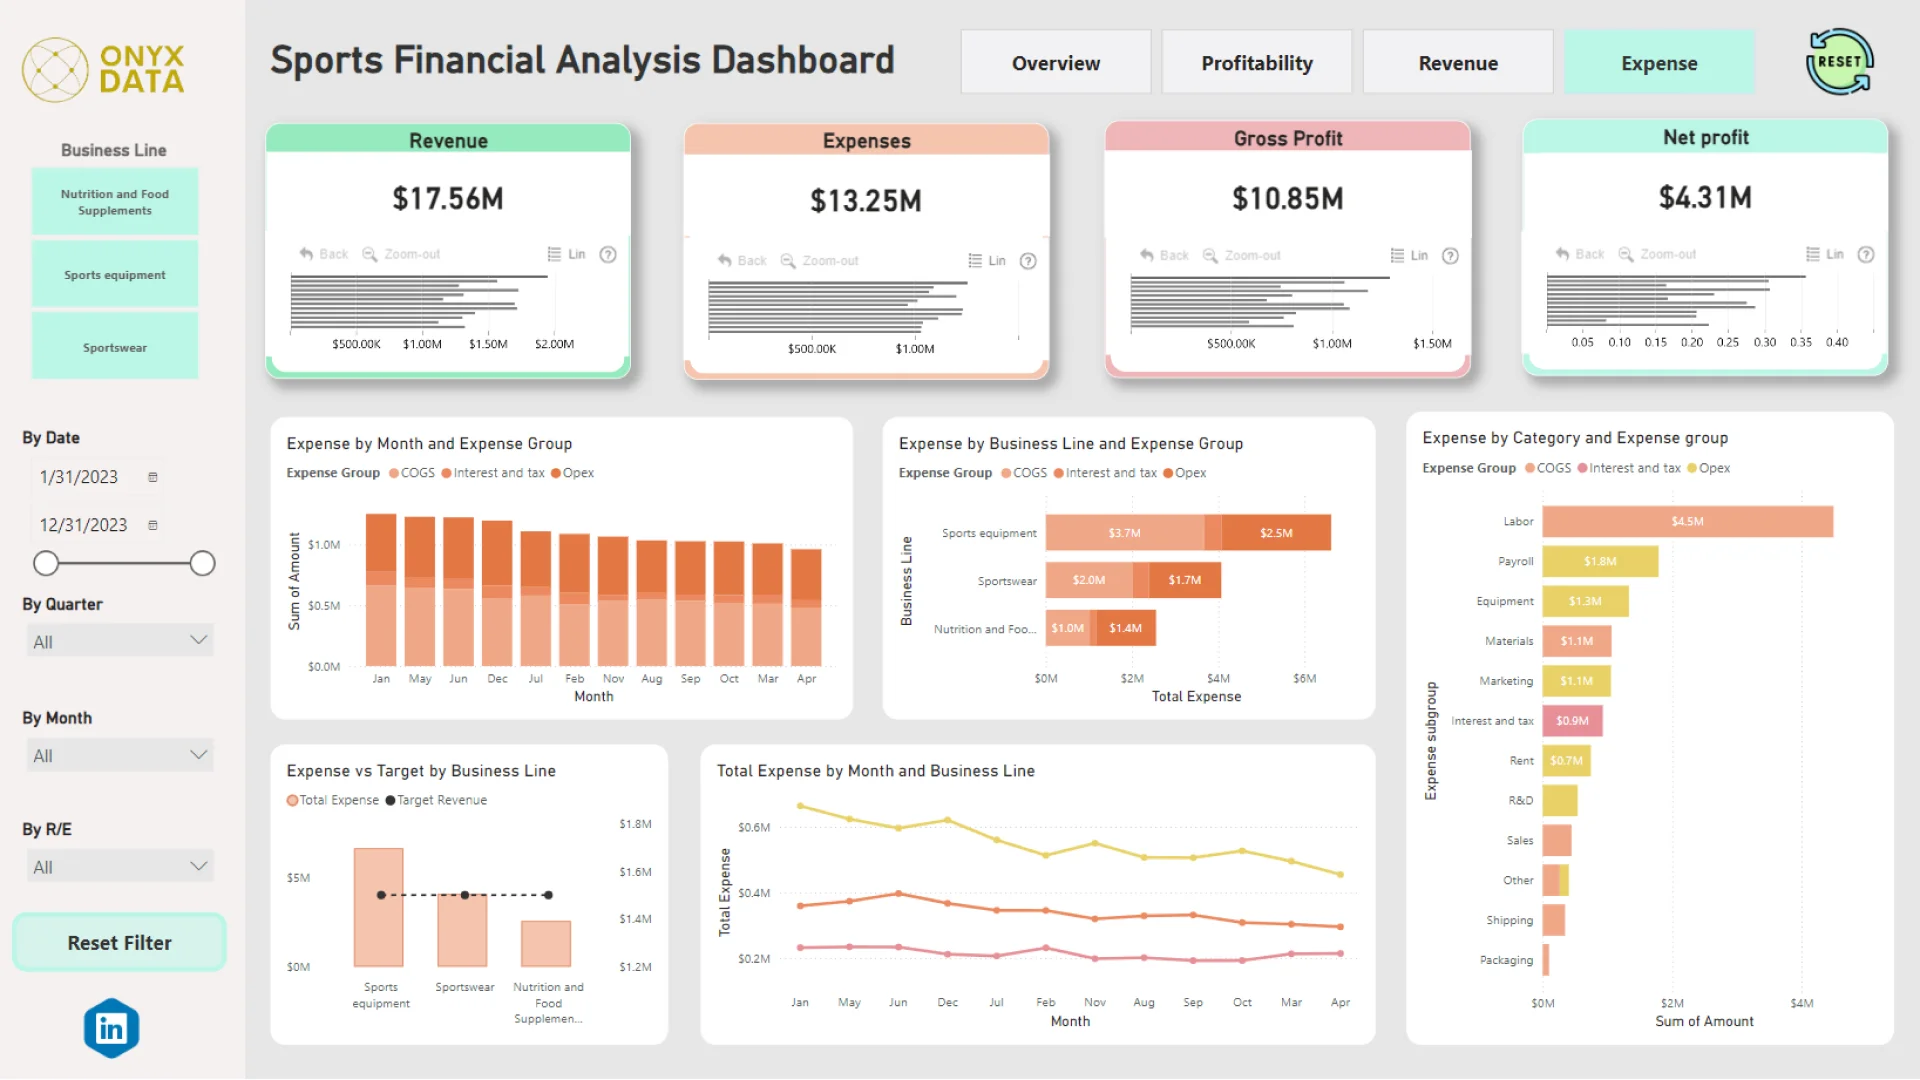
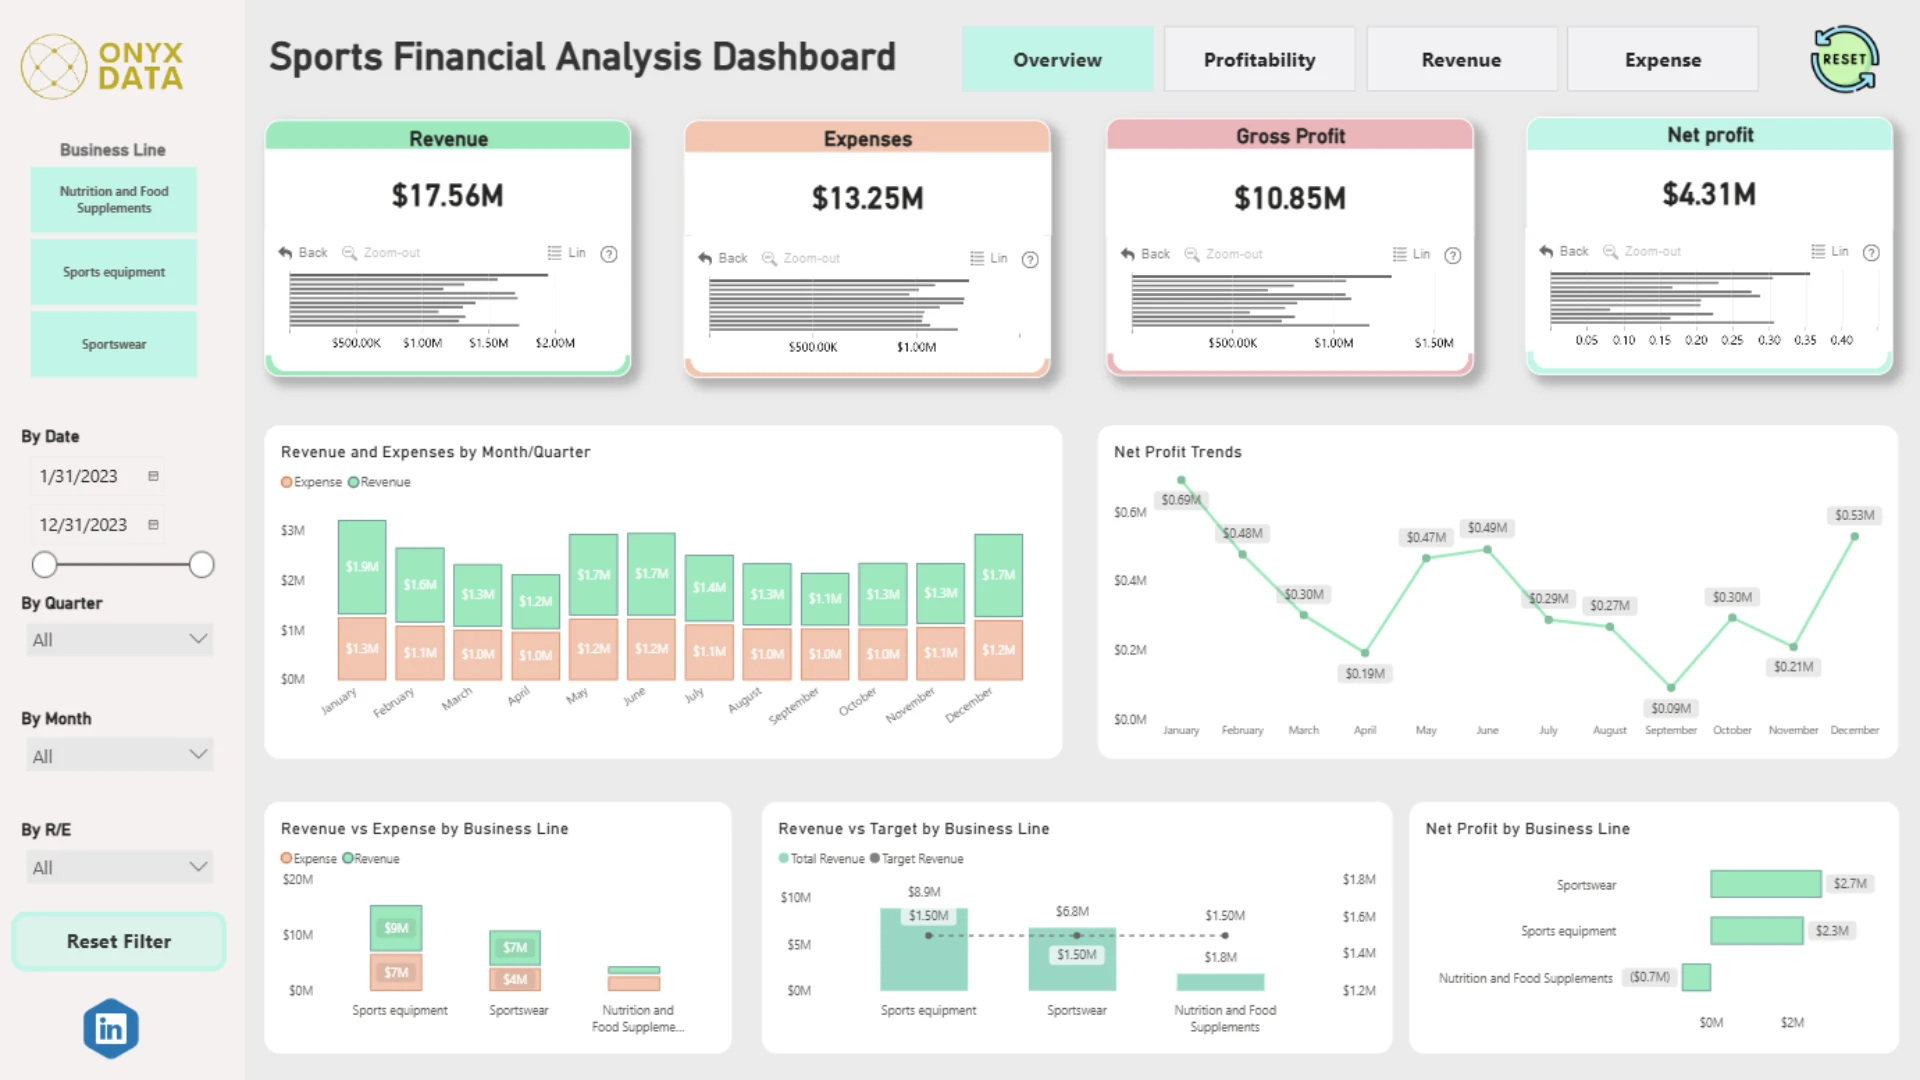
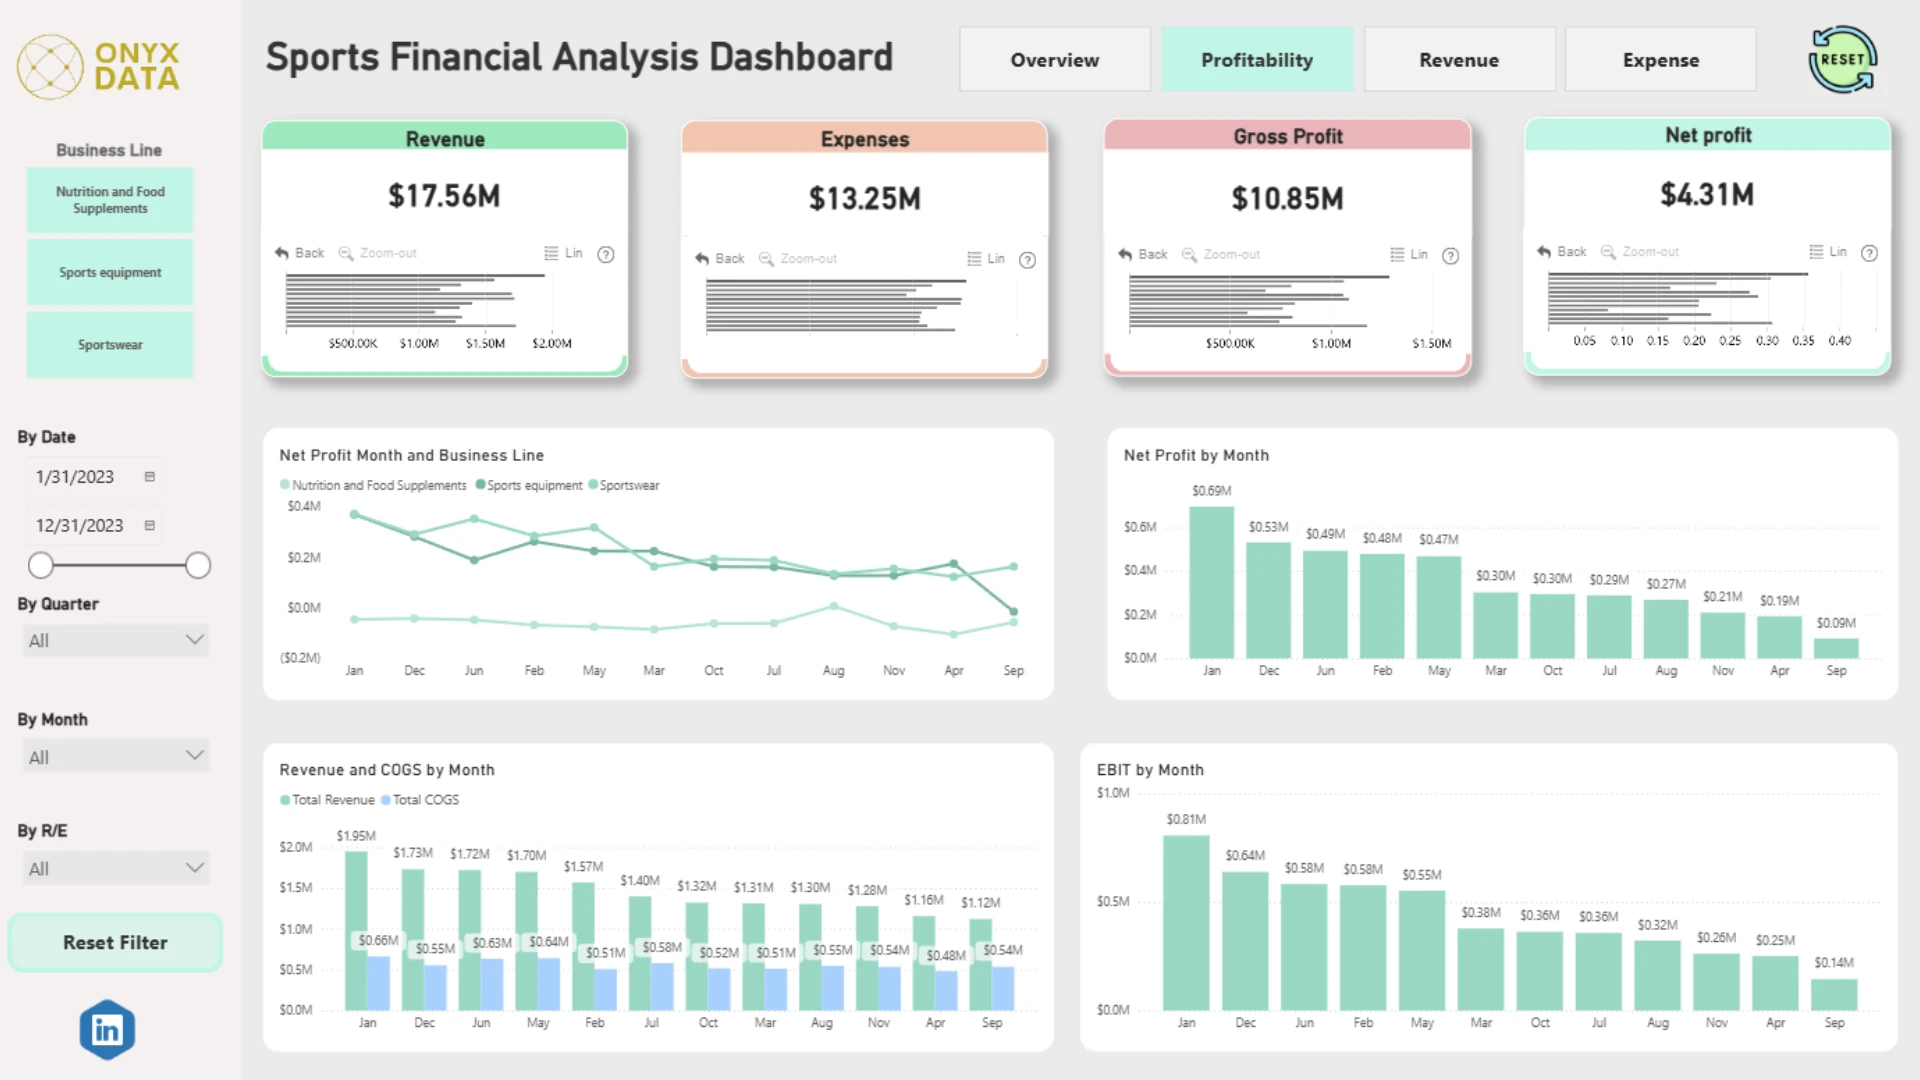
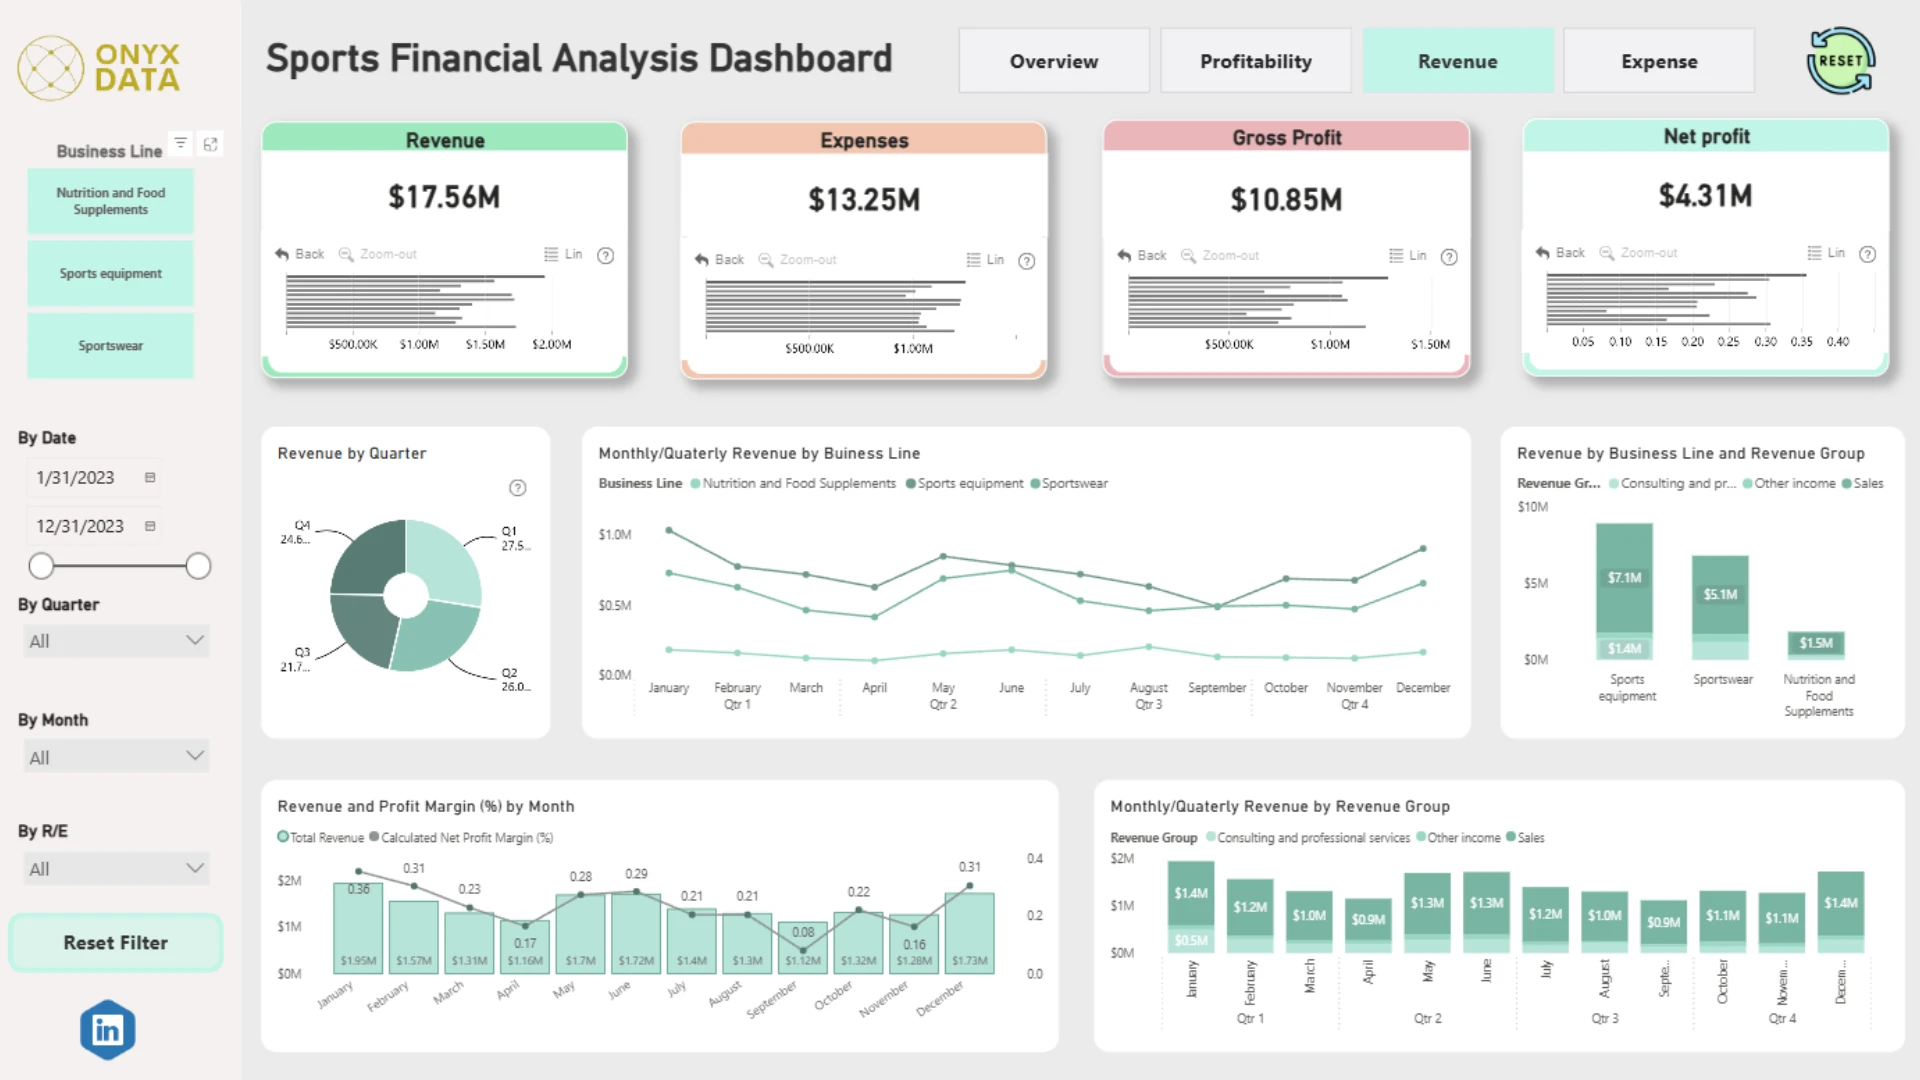
Report submitted for Onyx Data DataDNA ZoomCharts Mini Challenge, August 2024. The report was built based on Fitness Company Finance Dataset and includes ZoomCharts custom Drill Down PRO visuals for Power BI.
Author's description:
I have added a total of 13 ZoomCharts. However, I must admit that I find ZoomCharts a bit complex to work with. I kindly request that you organize a 7-day workshop where participants can ask questions, and you can conduct live classes specifically on ZoomCharts.
I have included the same KPIs across all four of my pages. Each page contains four KPIs, with every KPI using a Zoom Bar Chart. Additionally, on the revenue page, I added my favorite Zoom Donut Chart.


4U Report Challenges
Participate in data challenges, build and submit reports to get free template downloads.
Join CommunityMobile view allows you to interact with the report. To Download the template please switch to desktop view.
How to use a PBIX template
Preview the interactive report, download the PBIX file, open it in Power BI Desktop, and replace the same data connection with your own dataset.
Preview and download
Explore the report online and download the PBIX template file.
Open in Power BI Desktop
Open the downloaded PBIX file in Power BI Desktop.
Connect your data
Replace the sample data source with your own dataset.
Refresh and adjust
Refresh the model and update fields or visual were needed.
Save and share
Save your report and publish it for your audience.


