1145
Sport Health and Injury Report 23
Sport Health and Injury Report 23
More Report pages
Report Author: Odunayo Aliu
1145
Share template with others
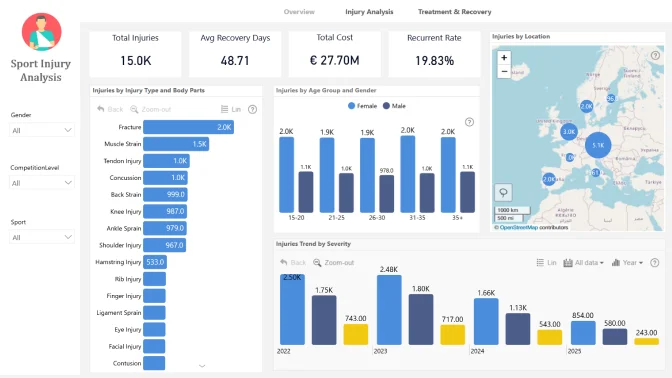
This Power BI report uses the Athlete Health and Injury dataset and features ZoomCharts Drill Down PRO custom visuals for Power BI. It was submitted to the FP20 Analytics ZoomCharts Data Challenge in August 2025.
Author's Description:
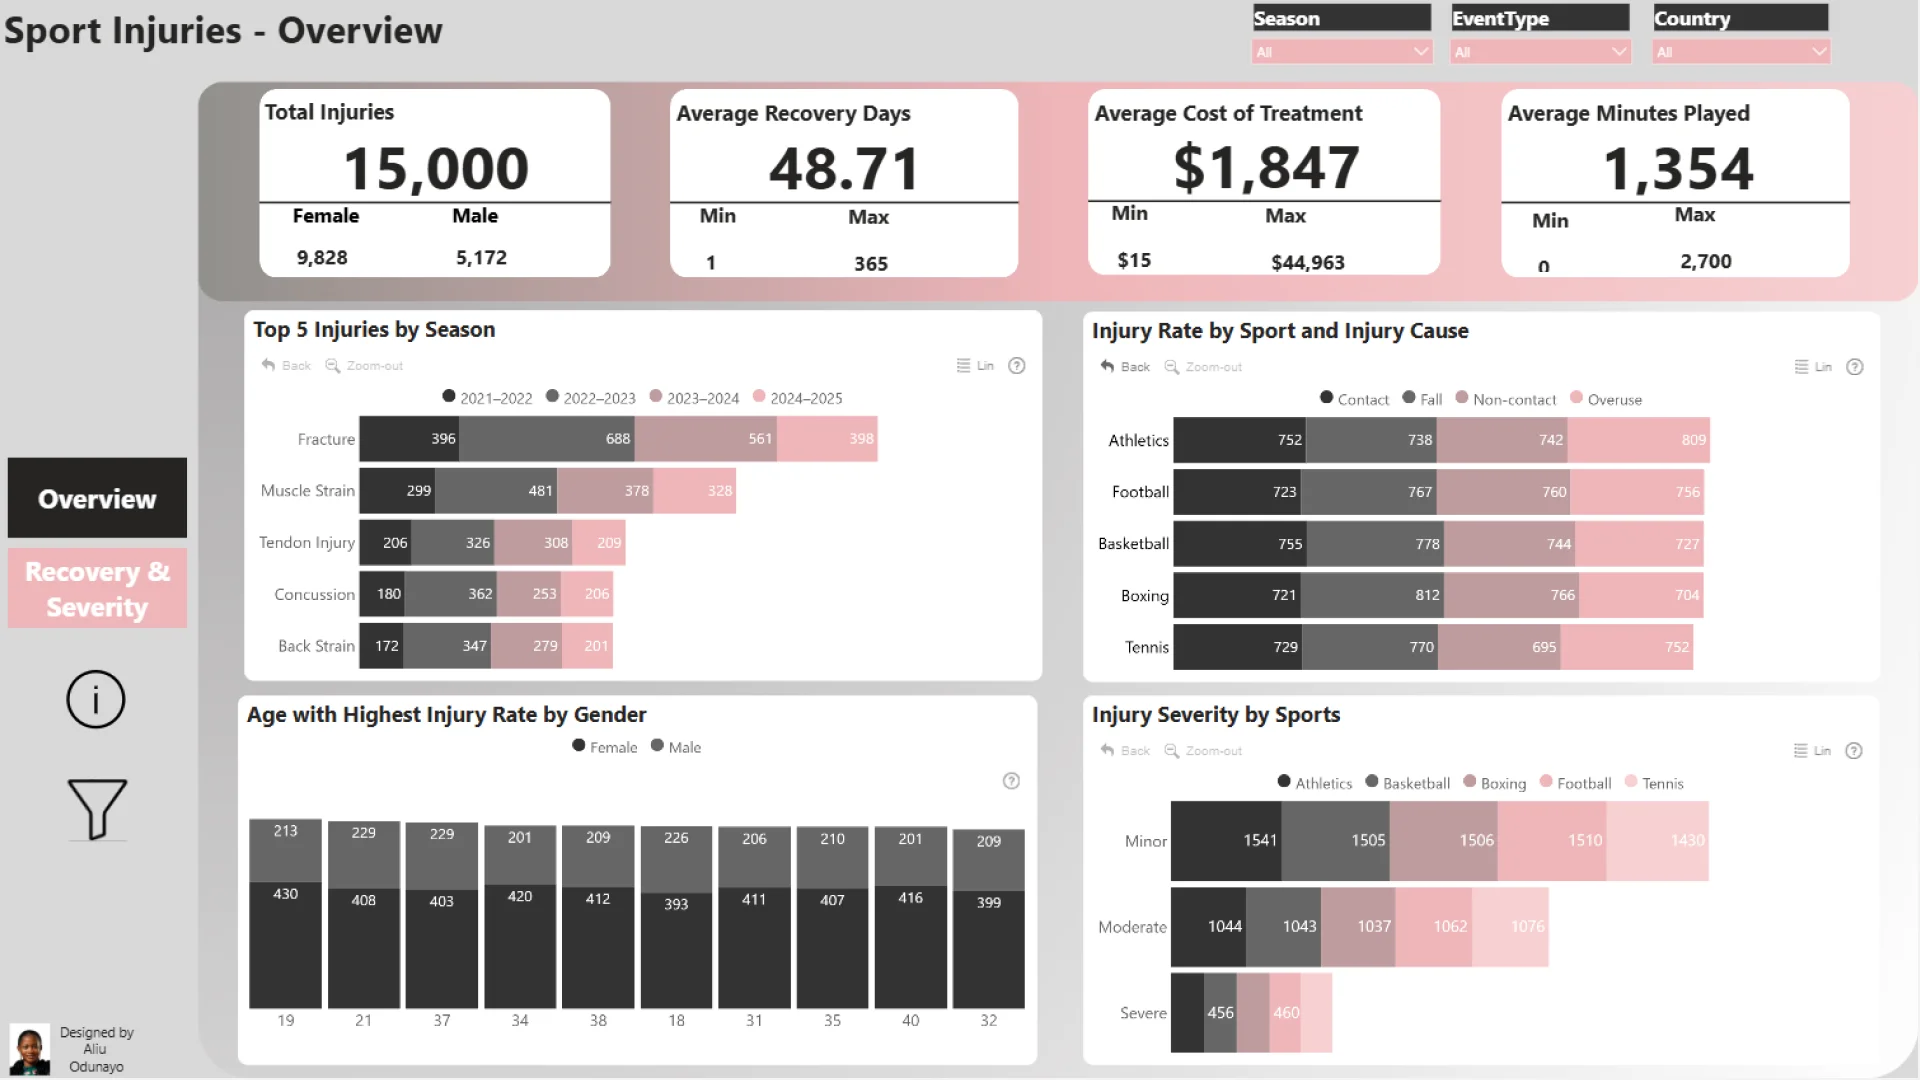
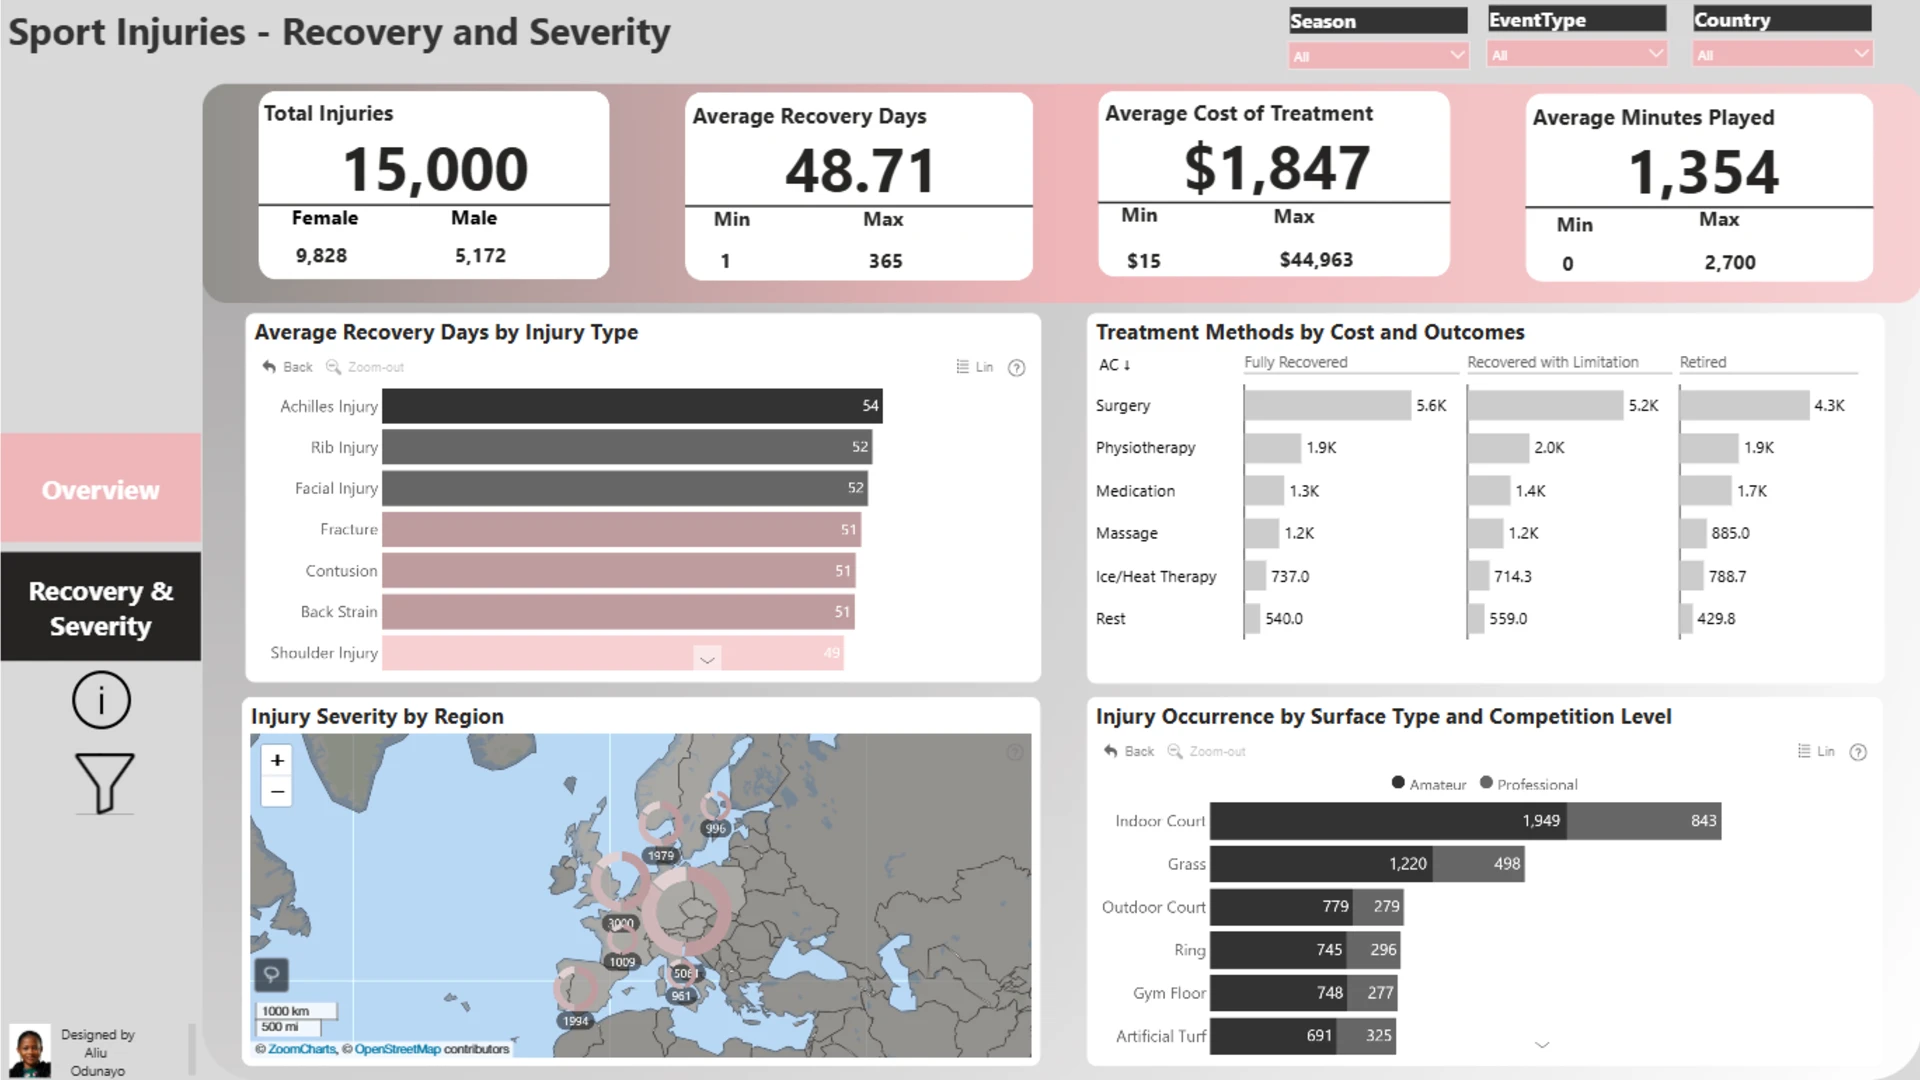
I am participating in FP20 Analytics Challenge 29. i got to explore the injuries of 15,000 athletes; their recovery schemes; the estimated days recovery, cost of recovery and a lot more. Here are my key insights: from my report, i could gather that most of the cases are from women and their are mainly from the 2022-2023 season. The most occurrent injury is fracture. Athletics sports has the highest injury rate but the severities are grossly minor. However, it takes an averages of 51 days of recovery which makes athletics the fourth ranked injury based on the recovery days. Amateurs have more injury occurrence and they are grossly distributed to the Indoor Court surface Type. Surgery is the treatment measure that take most cost because it has highest count of treatment outcome. My recommendations based on these analysis includes: 1. Adopting surface types with less injury severities and outcomes. 2. Increase the preventive measure for athletes within age 19-21 3. Sports with high severity rate should have more precautions involved. 4. Over-stretching of athletics sport should be prohibited. 5. Effective treatment methods should be adopted for cost effectiveness. Thank you. hashtag#FP20Analytics hashtag#FP20SportsInjury hashtag#SportsAnalytics hashtag#builtwithzoomcharts Federico Pastor ZoomCharts EnterpriseDNA



4U Report Challenges
Participate in data challenges, build and submit reports to get free template downloads.
Join CommunityMobile view allows you to interact with the report. To Download the template please switch to desktop view.
How to use a PBIX template
Preview the interactive report, download the PBIX file, open it in Power BI Desktop, and replace the same data connection with your own dataset.
Preview and download
Explore the report online and download the PBIX template file.
Open in Power BI Desktop
Open the downloaded PBIX file in Power BI Desktop.
Connect your data
Replace the sample data source with your own dataset.
Refresh and adjust
Refresh the model and update fields or visual were needed.
Save and share
Save your report and publish it for your audience.


