1071
Sport Health and Injury Report 15
Sport Health and Injury Report 15
More Report pages
Report Author: Nina Ikpe
1071
Share template with others
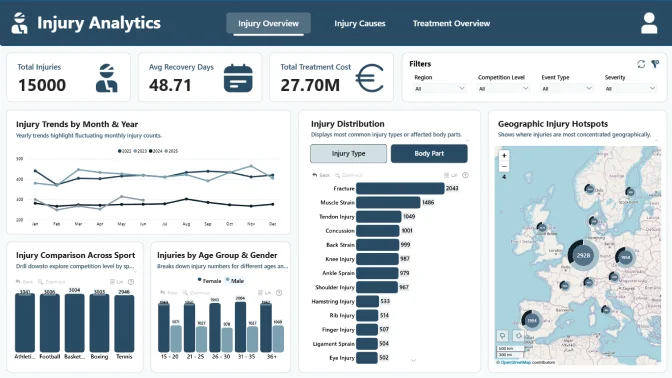
This Power BI report uses the Athlete Health and Injury dataset and features ZoomCharts Drill Down PRO custom visuals for Power BI. It was submitted to the FP20 Analytics ZoomCharts Data Challenge in August 2025.
Author's Description:
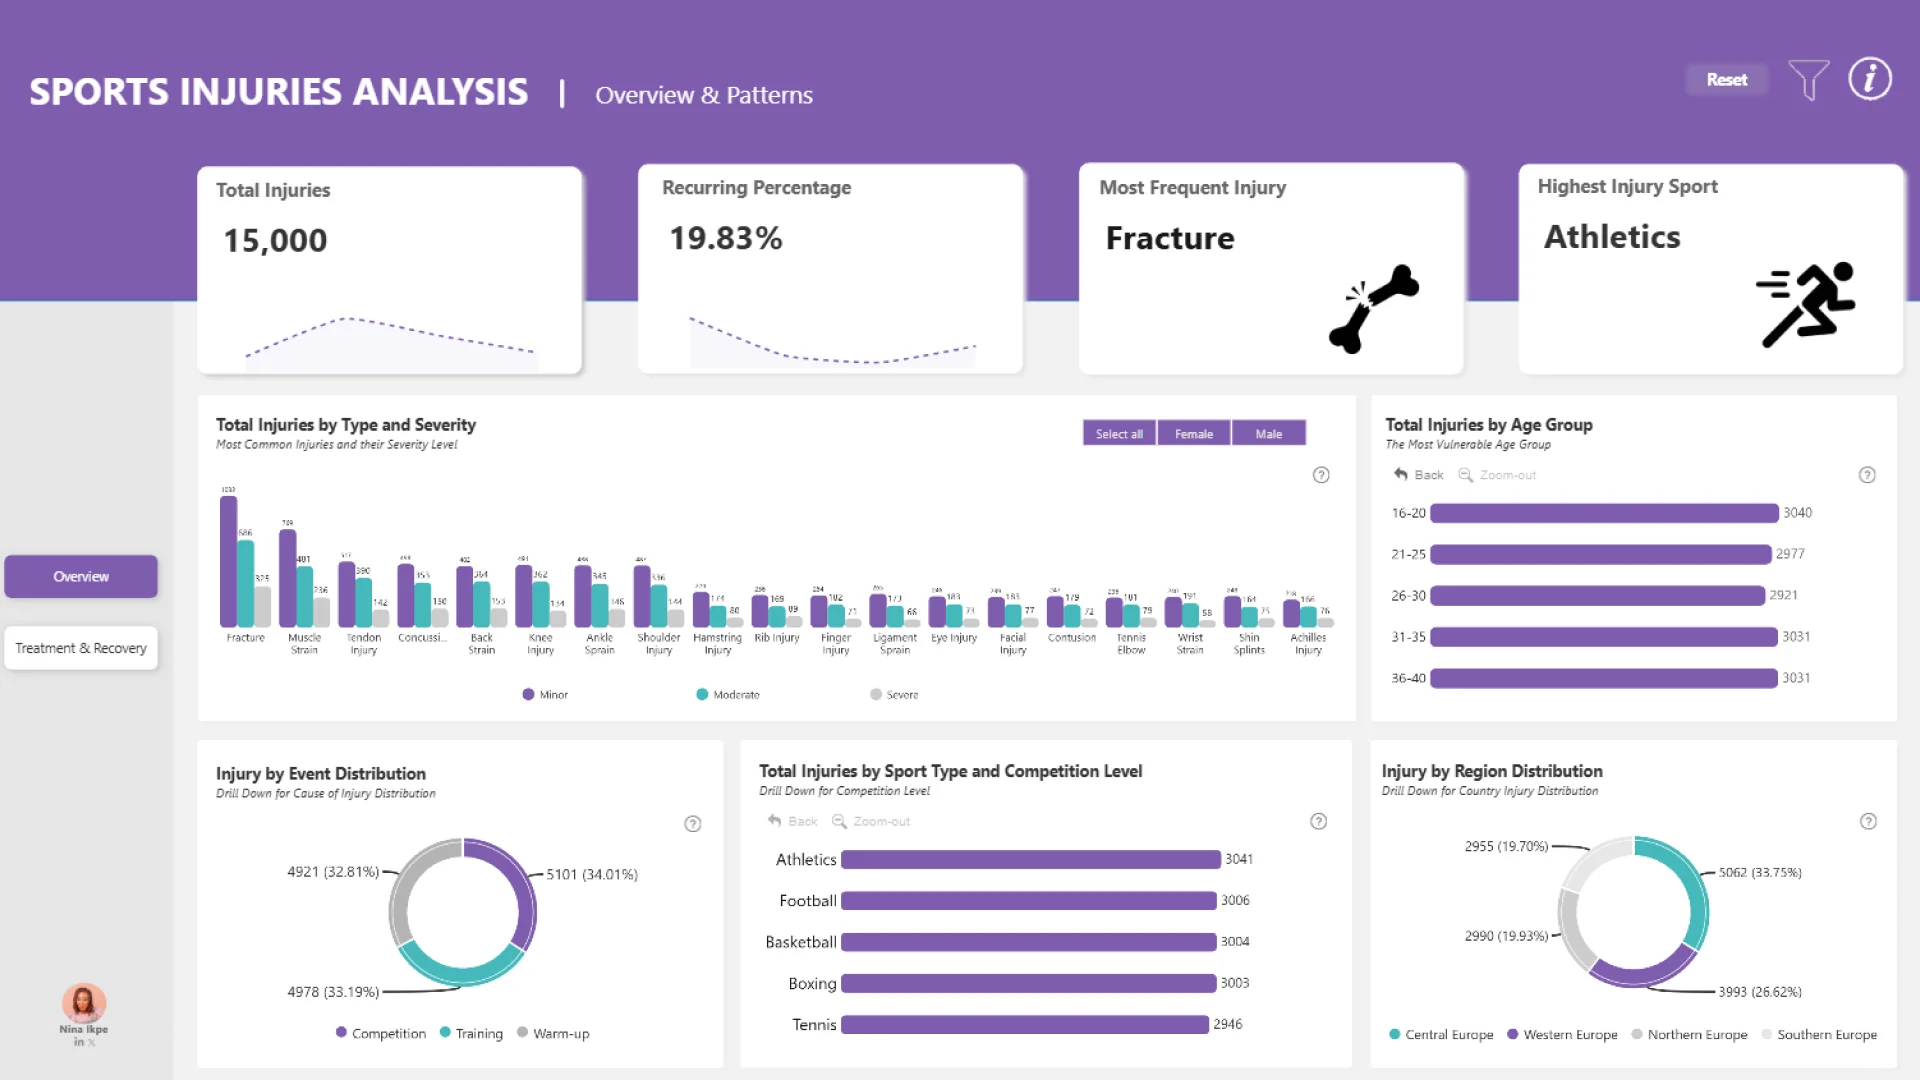
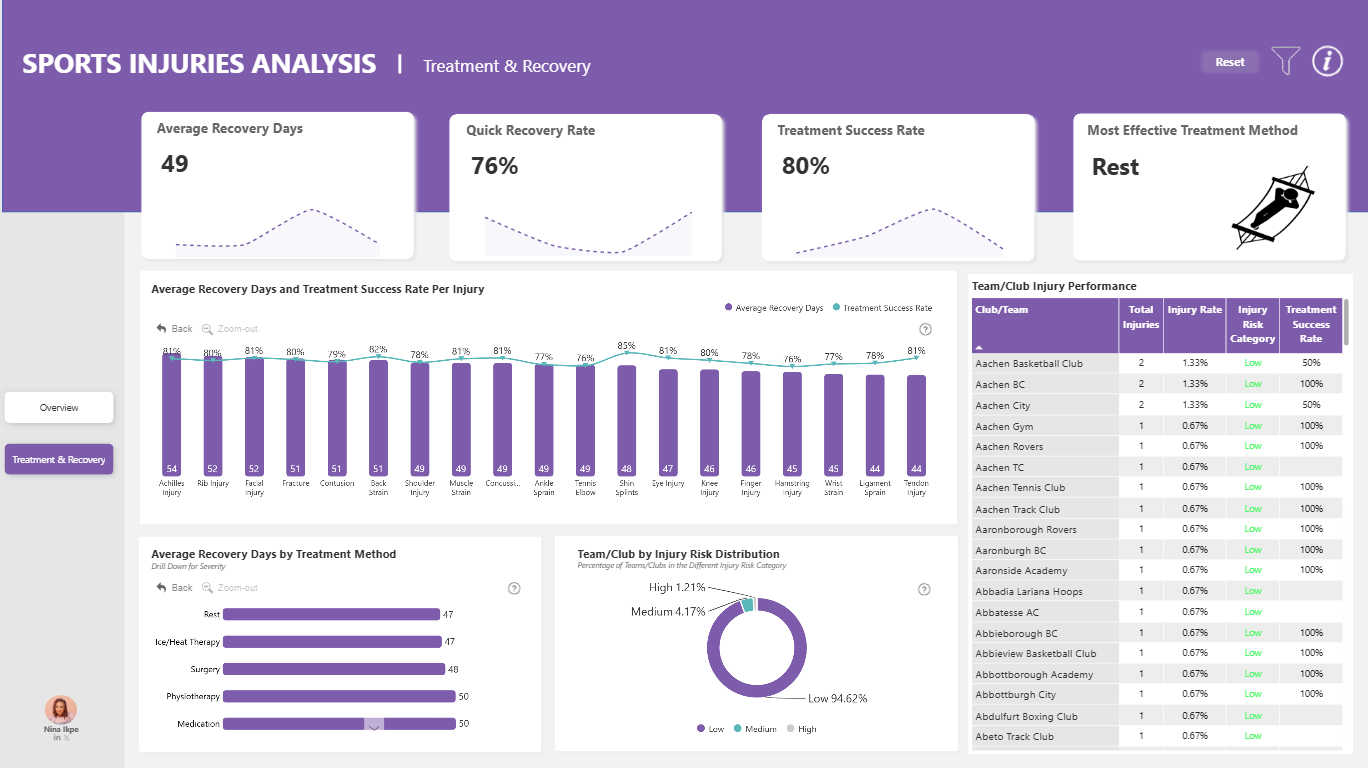
My submission for FP20 Analytics Challenge 29 explores injury risks in sports, uncovering patterns across age groups, regions, and competition intensity. The analysis highlights the most frequent injuries, high-risk sports, vulnerable demographics, and regions most affected. It also evaluates treatment effectiveness, recovery times, and success rates, while identifying teams with varying levels of injury risk.



4U Report Challenges
Participate in data challenges, build and submit reports to get free template downloads.
Join CommunityMobile view allows you to interact with the report. To Download the template please switch to desktop view.
How to use a PBIX template
Preview the interactive report, download the PBIX file, open it in Power BI Desktop, and replace the same data connection with your own dataset.
Preview and download
Explore the report online and download the PBIX template file.
Open in Power BI Desktop
Open the downloaded PBIX file in Power BI Desktop.
Connect your data
Replace the sample data source with your own dataset.
Refresh and adjust
Refresh the model and update fields or visual were needed.
Save and share
Save your report and publish it for your audience.


