792
Sport Health and Injury Report 10
Sport Health and Injury Report 10
Report Author: Olushola Adebayo
792
Share template with others
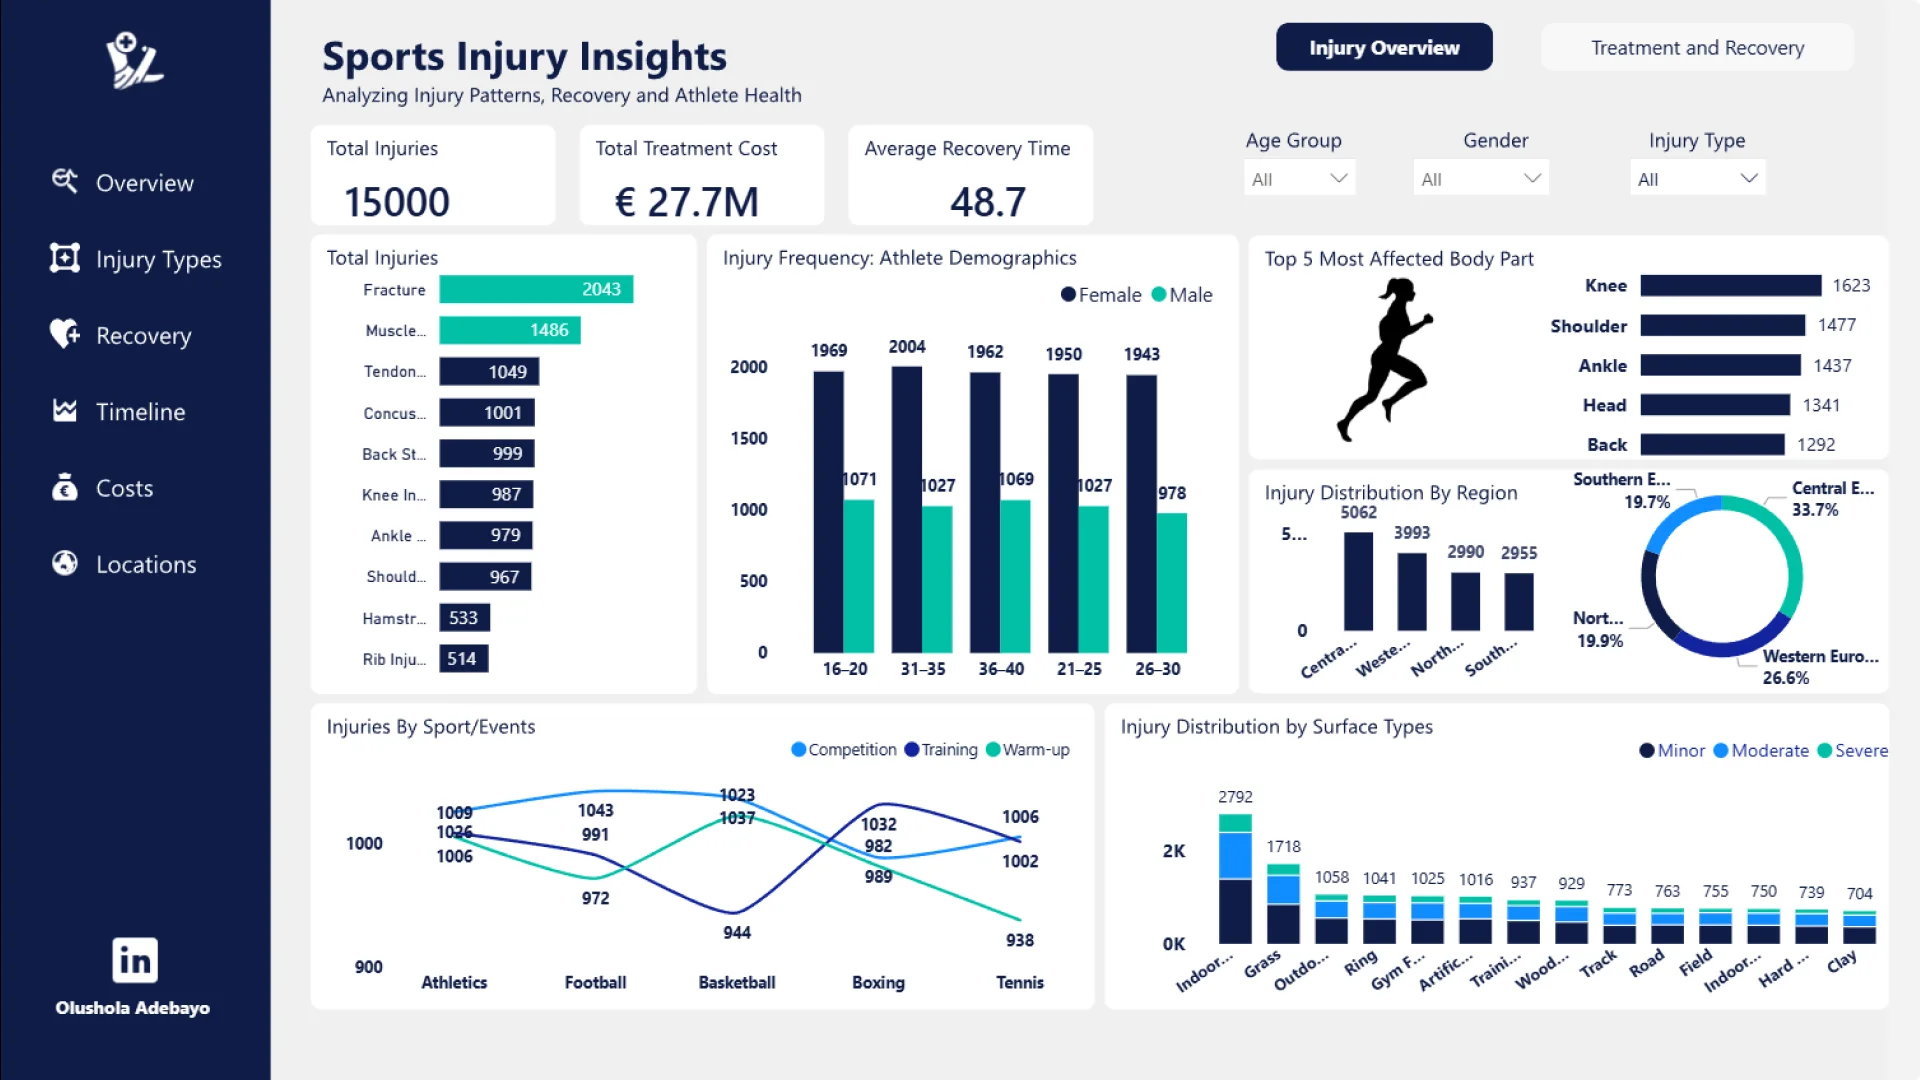
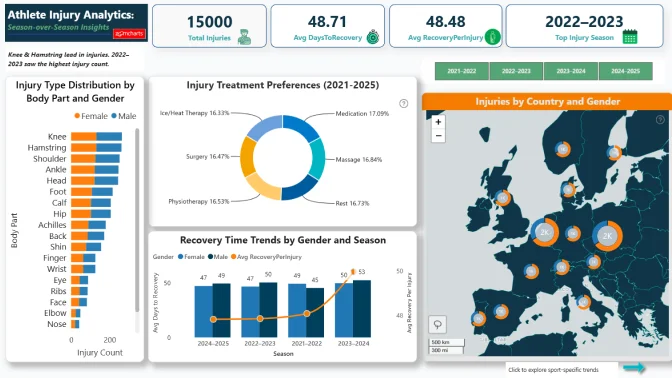
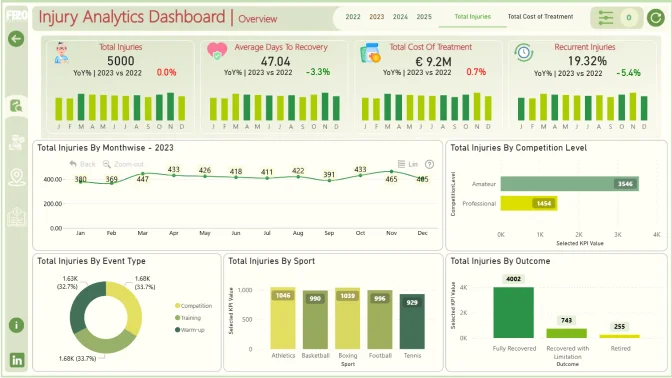
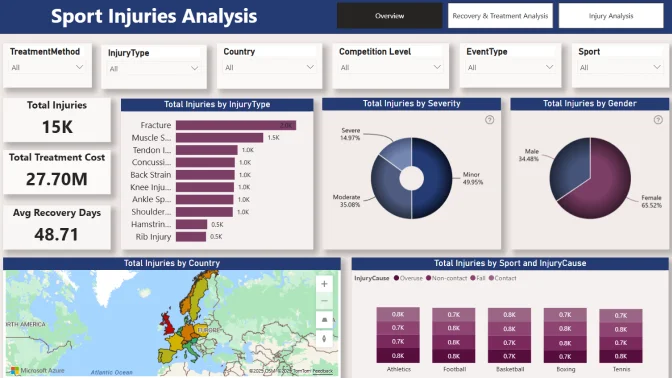
This Power BI report uses the Athlete Health and Injury dataset and features ZoomCharts Drill Down PRO custom visuals for Power BI. It was submitted to the FP20 Analytics ZoomCharts Data Challenge in August 2025.
Author's Description:
An interactive Power BI report leveraging ZoomCharts Drill Down visuals to explore 15,000+ sports injury records. This dashboard helps coaches, medical staff, and sports organizations identify high-risk injury types, assess treatment effectiveness, and understand recovery timelines.
4U Report Challenges
Participate in data challenges, build and submit reports to get free template downloads.
Join CommunityMobile view allows you to interact with the report. To Download the template please switch to desktop view.
Was this helpful? Thank you for your feedback!
Sorry about that.
How can we improve it?