678
South America Urbanization (1960-2023)
South America Urbanization (1960-2023)
Report Author: Ugochukwu Nwasuruba
678
Share template with others
Report submitted for Onyx Data DataDNA ZoomCharts Mini Challenge, February 2025. The report is based on the Demographic and Urbanization dataset and includes ZoomCharts custom Drill Down PRO visuals for Power BI.
Authors Description
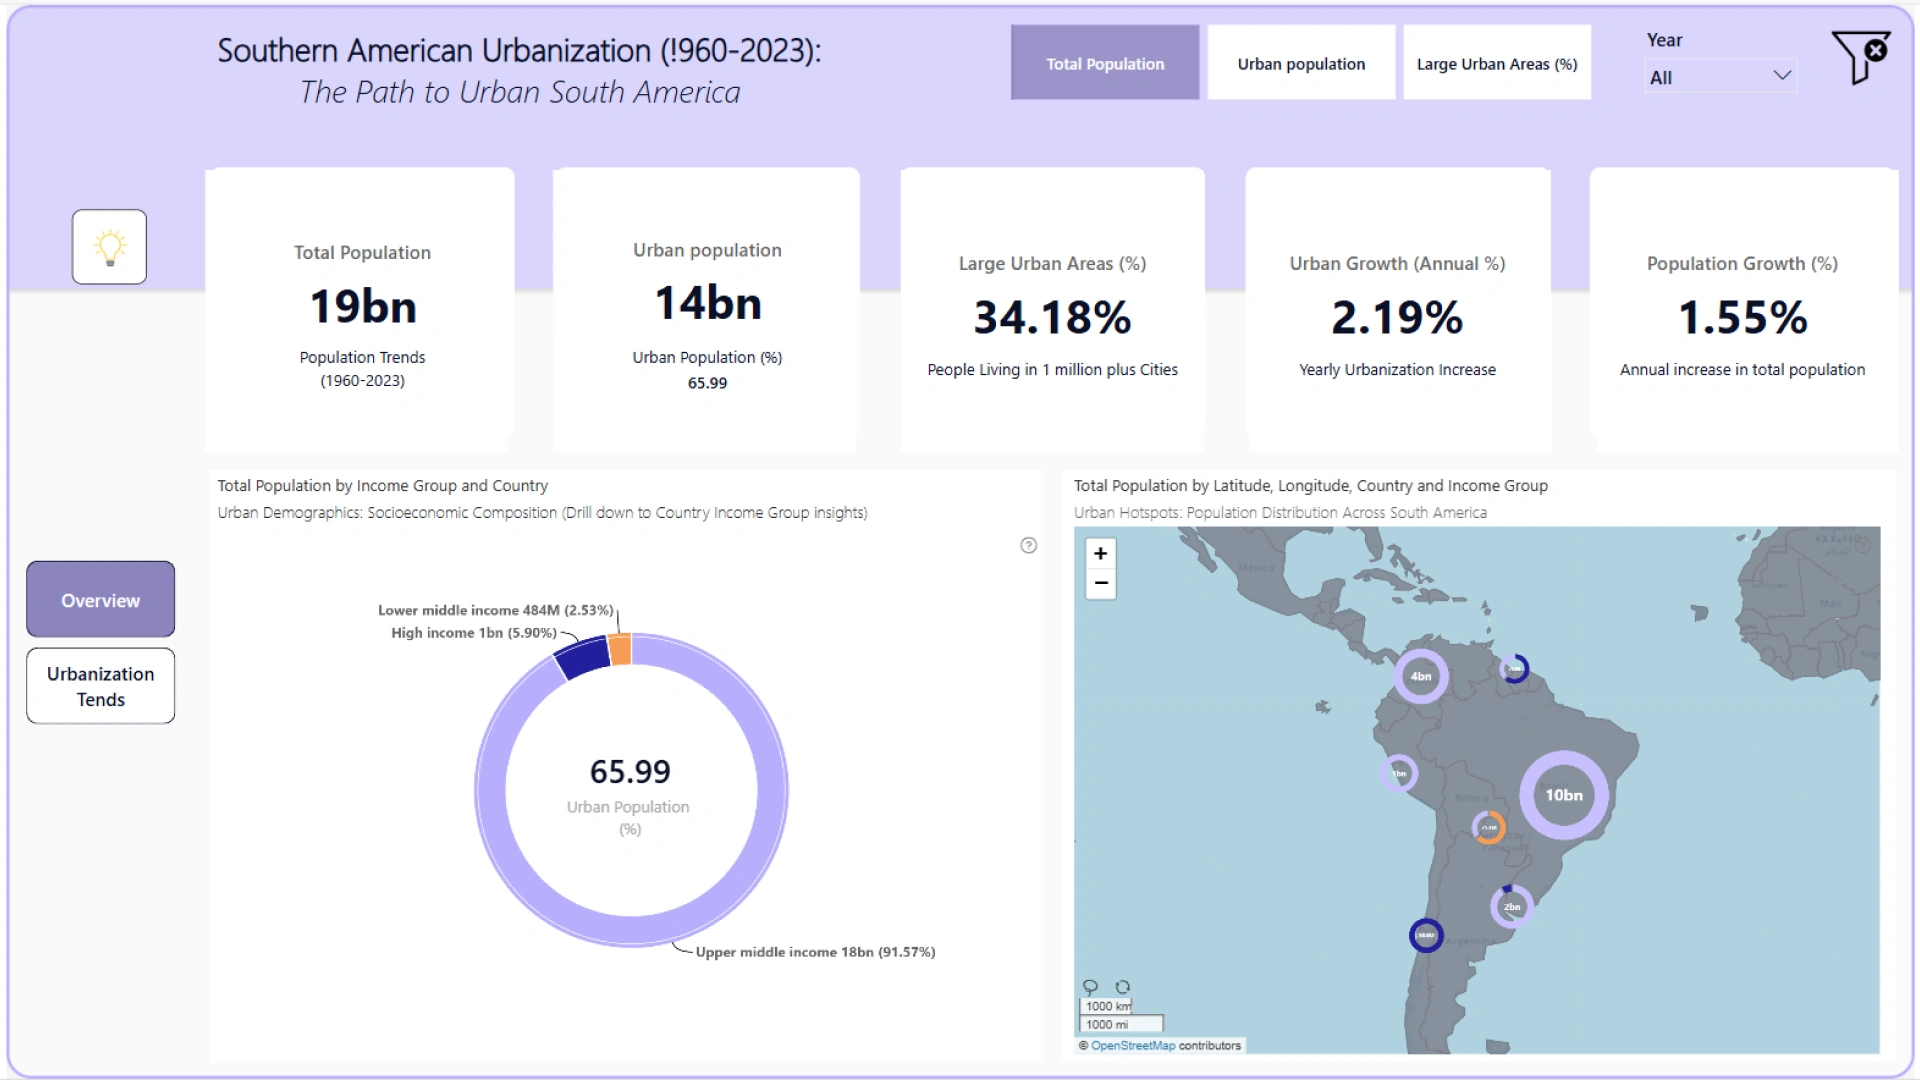
This dashboard explores South America’s urbanization trends, highlighting population growth, urban living patterns, and the concentration of people in large cities. With interactive visuals, users can analyze metrics such as total population, urban growth, and urbanization rates, providing insights into demographic shifts shaping the region.
4U Report Challenges
Participate in data challenges, build and submit reports to get free template downloads.
Join CommunityMobile view allows you to interact with the report. To Download the template please switch to desktop view.


Was this helpful? Thank you for your feedback!
Sorry about that.
How can we improve it?