188
Software Delivery & Quality Power BI Dashboard Example
Software Delivery & Quality Power BI Dashboard Example
More Report pages
Report Author: ZoomCharts
188
Share template with others
Summary
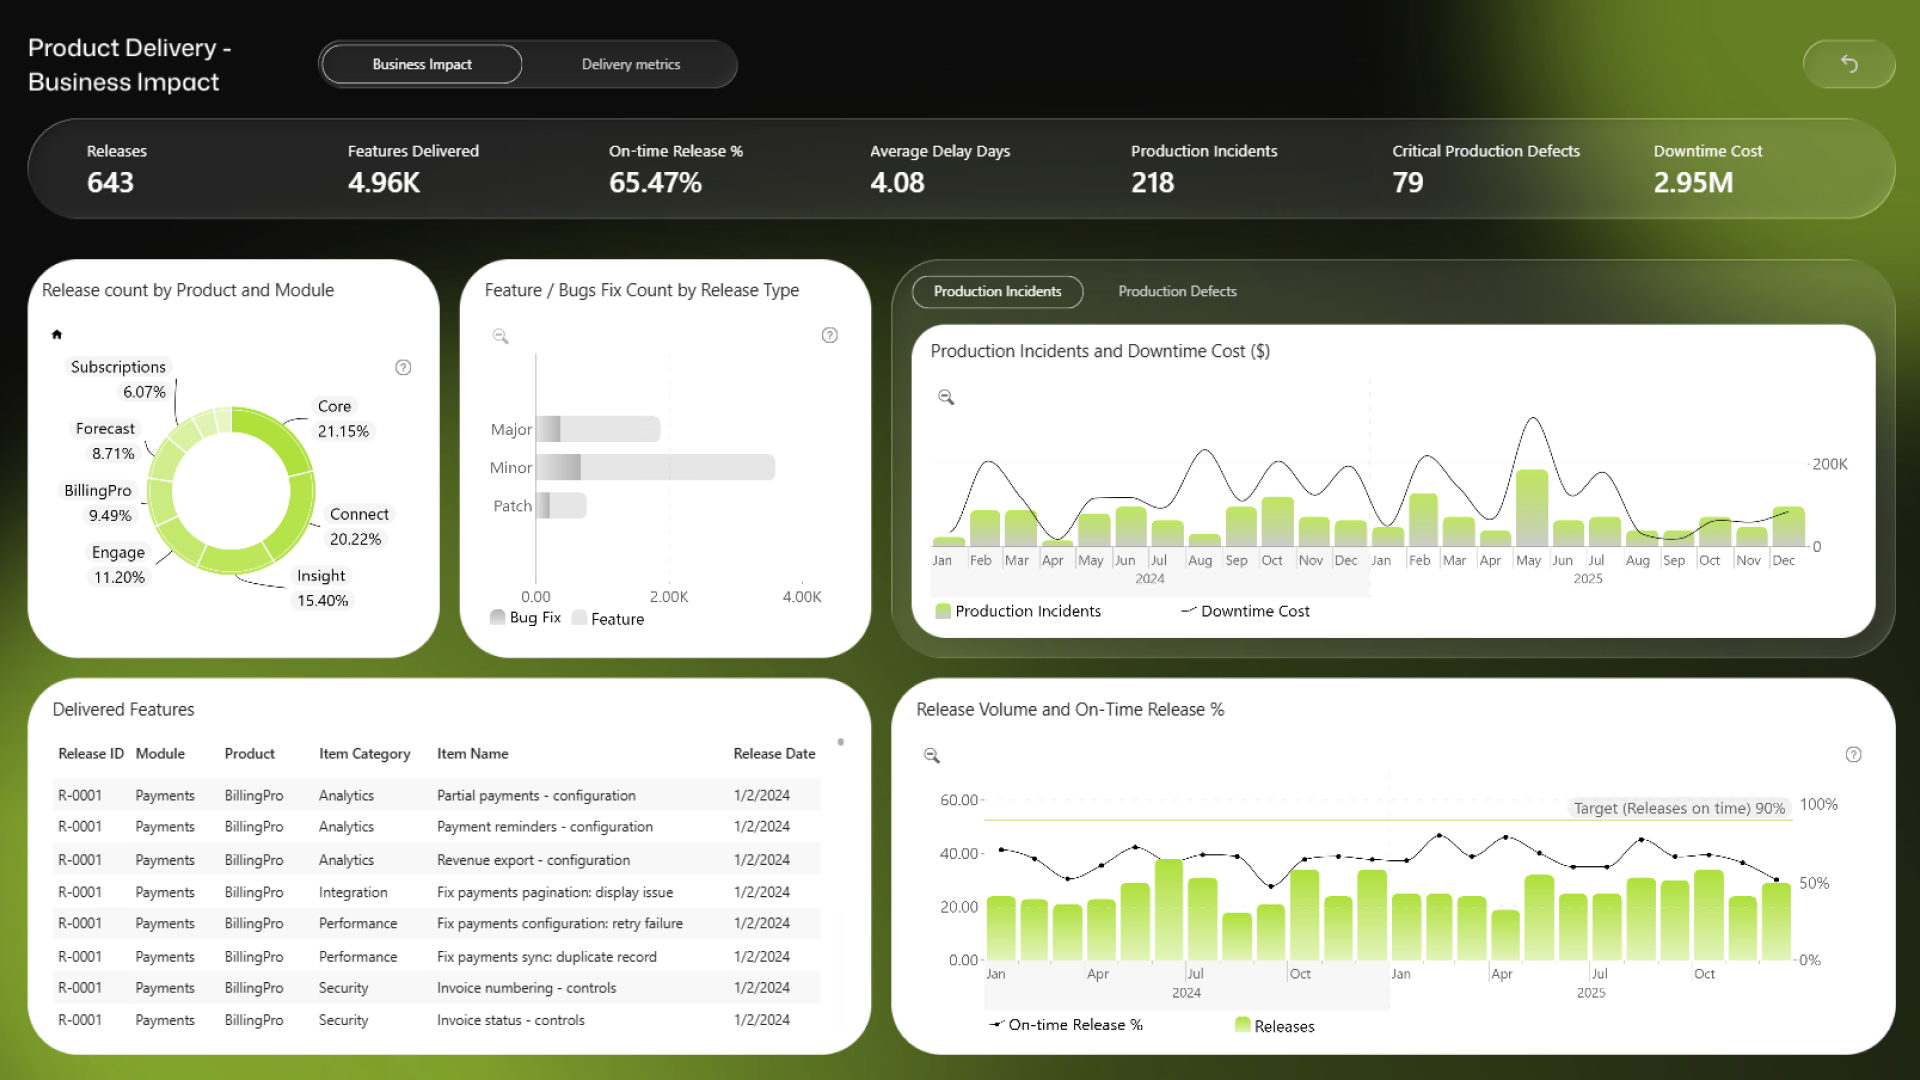
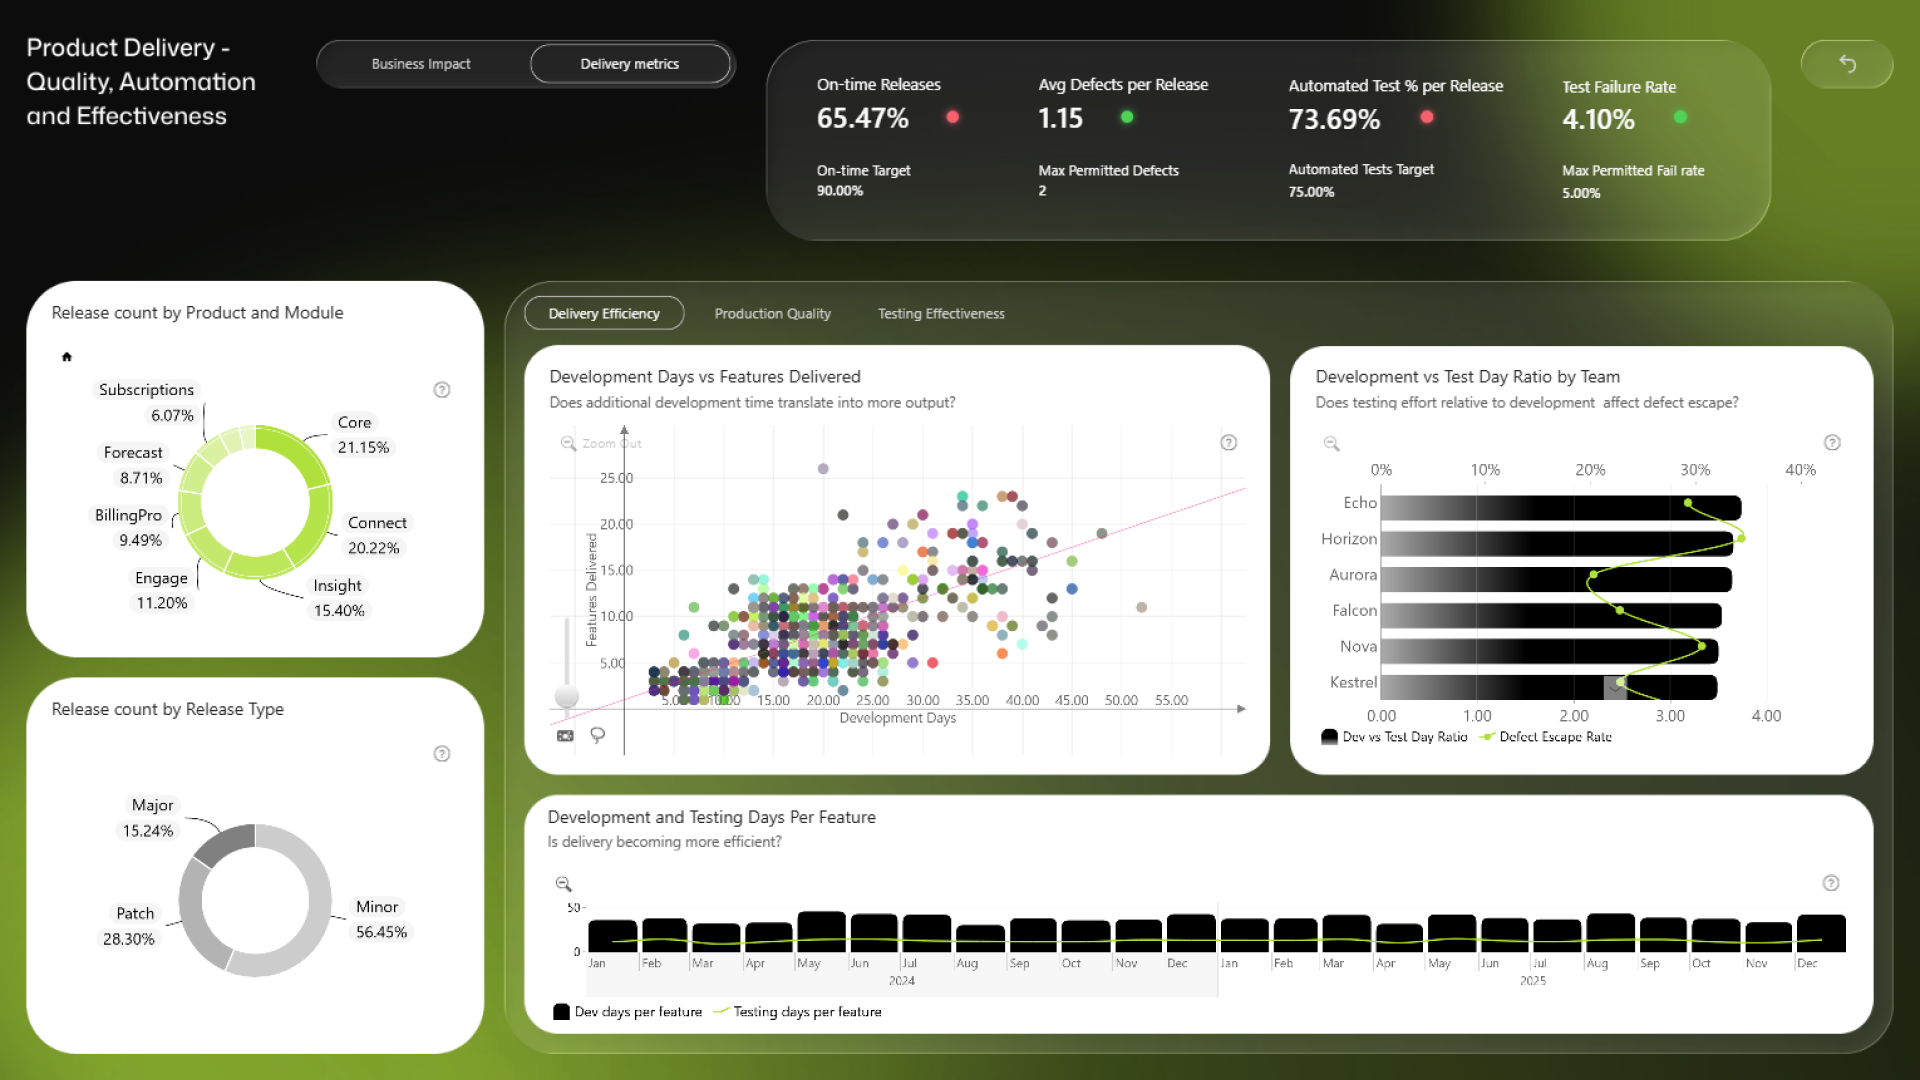
This Software Delivery and Quality Power BI Dashboard is a practical example for anyone exploring Power BI dashboard examples for software development and product delivery. Across two pages, the report connects release performance with software quality, testing effectiveness, production incidents, and business impact.
The dashboard uses a dark theme with light, high-contrast visuals to keep detailed charts and metrics easy to read. It also includes animated, AI-created KPI cards that compare current results with targets for on-time releases, defects per release, automated testing, and test failure rates.
Key Insights
The first page provides a business impact overview, while the second page explores delivery and quality performance in greater detail. Key insights include:
- Release performance: release volume, on-time release rate, and delivery trends over time
- Software delivery: features delivered, average development time, and release distribution by product, module, and release type
- Production quality: incidents, critical defects, downtime costs, and defects per release
- Testing effectiveness: automated test coverage, test failure rate, and development-to-testing ratios
- Delivery efficiency: relationships between development time, testing effort, and delivered features
On the second page, users can filter the analysis by different metric groups, including Delivery Efficiency, Production Quality, and Testing Effectiveness. Interactive charts make it easy to compare teams, products, modules, release types, and reporting periods from multiple perspectives.
How to Use Power BI Dashboard
Use the navigation at the top of the report to move between the Business Impact and Delivery Metrics pages. On the second page, select a metric category to focus the dashboard on the relevant software delivery or quality indicators. Click active chart elements to filter related visuals and explore individual products, modules, teams, release types, and time periods.
Download the Power BI PBIX file to examine the report structure, visual settings, measures, calculations, interactions, and animated AI-created KPI cards. You can customize the dashboard, connect it to your own software delivery data, and adapt the pages and metrics to match your reporting requirements.
ZoomCharts visuals used




4U Report Challenges
Participate in data challenges, build and submit reports to get free template downloads.
Join CommunityMobile view allows you to interact with the report. To Download the template please switch to desktop view.
How to use a PBIX template
Preview the interactive report, download the PBIX file, open it in Power BI Desktop, and replace the same data connection with your own dataset.
Preview and download
Explore the report online and download the PBIX template file.
Open in Power BI Desktop
Open the downloaded PBIX file in Power BI Desktop.
Connect your data
Replace the sample data source with your own dataset.
Refresh and adjust
Refresh the model and update fields or visual were needed.
Save and share
Save your report and publish it for your audience.


